Prototype 2 Development

By: Alex Krejci

Abstract/Introduction
This light-weight, low-cost weather station is being designed as a solution for collecting weather data while the station is mounted to a temperature-sensing fiber optic cable that is suspended by a weather balloon. After mounting to the fiber, the station will be lifted into the air up to several hundred meters, where it will collect auxiliary data and corroborative data to support temperature, humidity, and wind speed data collected by the fiber. The station is designed to be low cost such that it could also be used for a variety of other weather monitoring applications.

Parts

  • Electronics
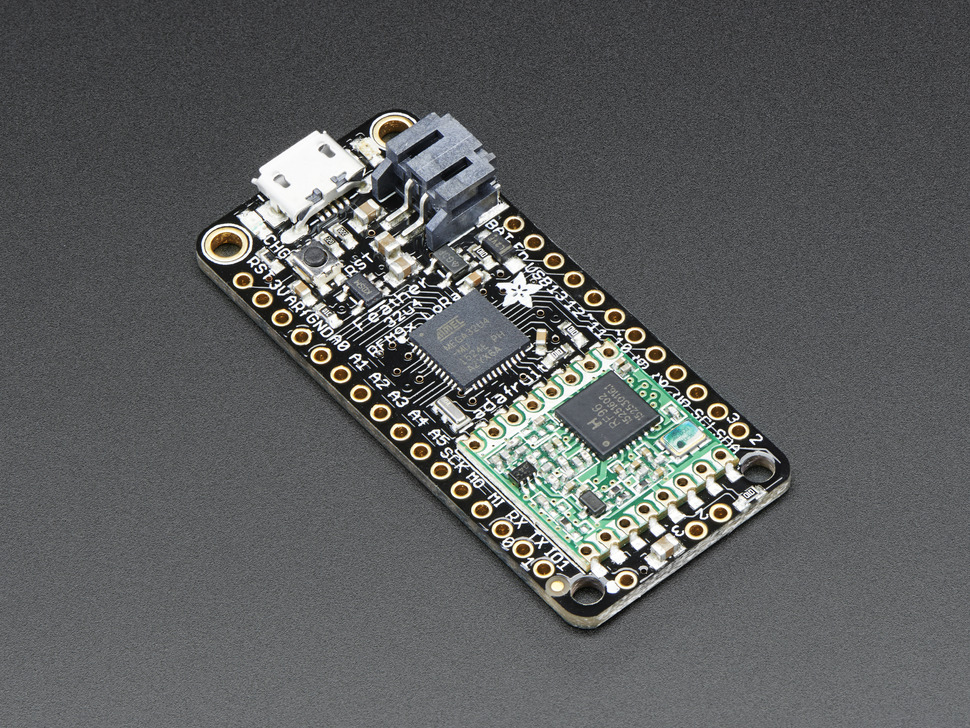
    • Teensy 3.2 microcontroller
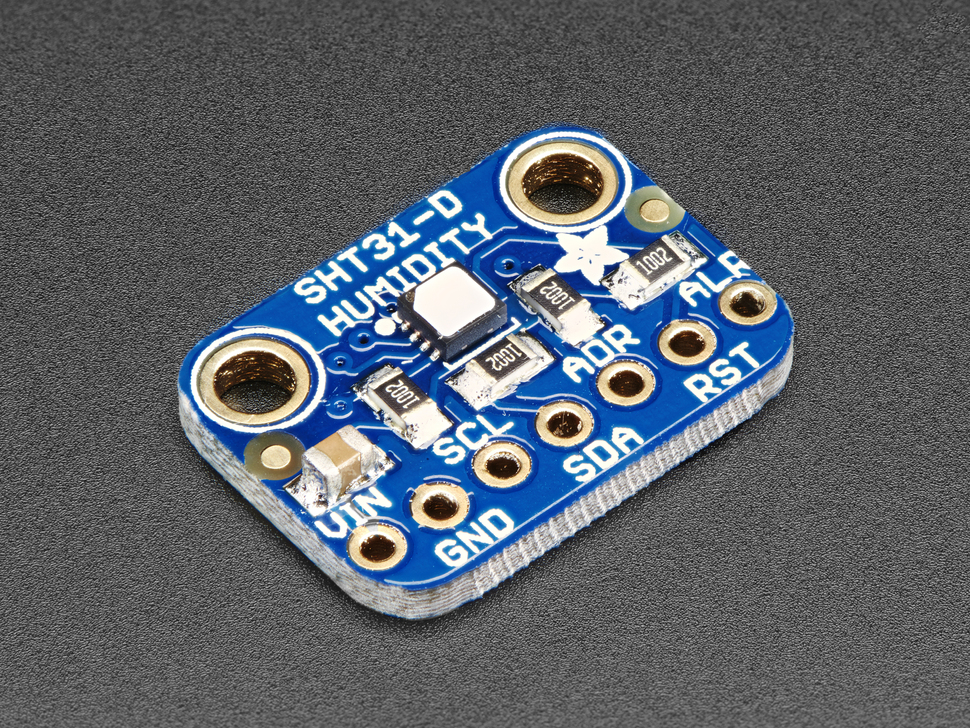
    • SHT31 – Temperature and humidity sensor
    • BMP280 – Pressure sensor
    • IR led and receiver with LM358 op-amp comparator – wind speed
    • BNO055 – 3-axis orientation sensor as well as 9 dof imu
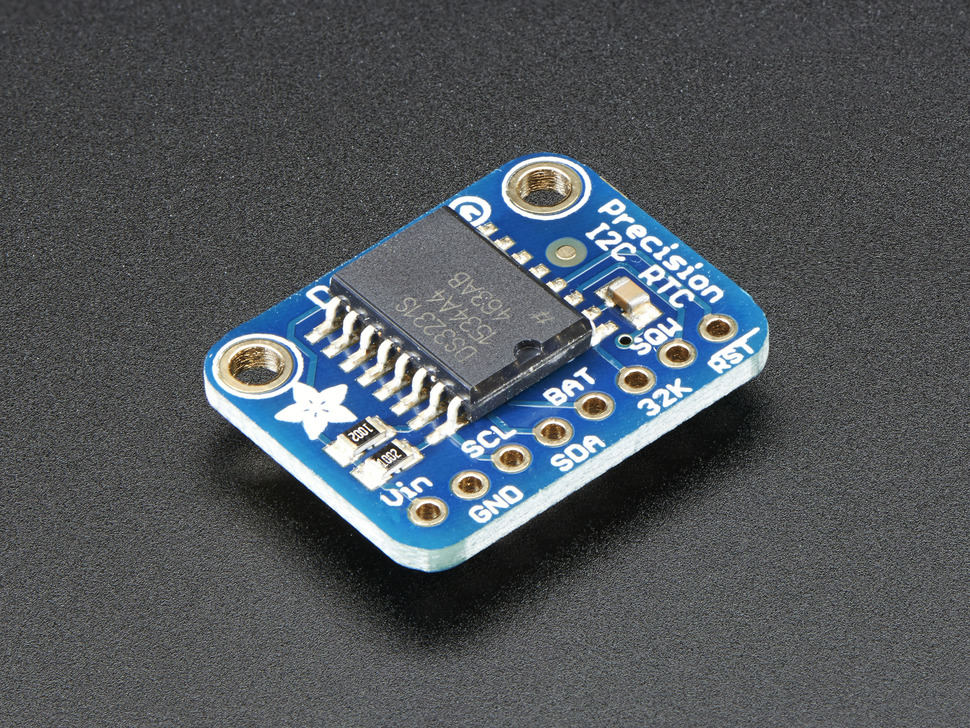
    • DS3231 – real-time clock
    • MicroSD port
    • RGB LED
    • Lithium polymer battery – 350 mAh
    • Custom PCB
  • Housing
    • 3D printed body and head
    • O-ring to seal from water
    • Propeller with housing for IR led and receiver
  • Mounting
    • 3D printed mounting clip to attach device to bearings
    • Thrust bearings with washers
    • 3D printed bearing support post
    • 3D printed fiber grippers
    • Wood frame to attach fiber grippers to bearing post

Measuring Capabilities
•    Temperature
•    Humidity
•    Pressure
•    Pitch, roll, yaw/wind direction – pitch tells us how much the head of the vane tips up or down so we can correct for the wind speed as this reduces wind cross section. Roll isn’t as critical, but is important to monitor for anomalous events. Yaw gives us the device orientation; this should be the same as the wind direction.
•    Acceleration, magnetic field, and angular velocity – The values are combined into a sensor fusion algorithm to give pitch, roll, and yaw. Recorded separately, they give us an idea of what is happening especially during anomalous events. The recorded data can’t be used to calculate pitch, roll, and yaw in post-processing as the recording frequency is lower than the in-situ sensor fusion algorithm update.
•    Wind Speed – using the propeller, we get an idea of wind speed. This will be combined with pitch measurements to correct for cross-sectional changes as the device will oscillate as it hangs on the fiber.
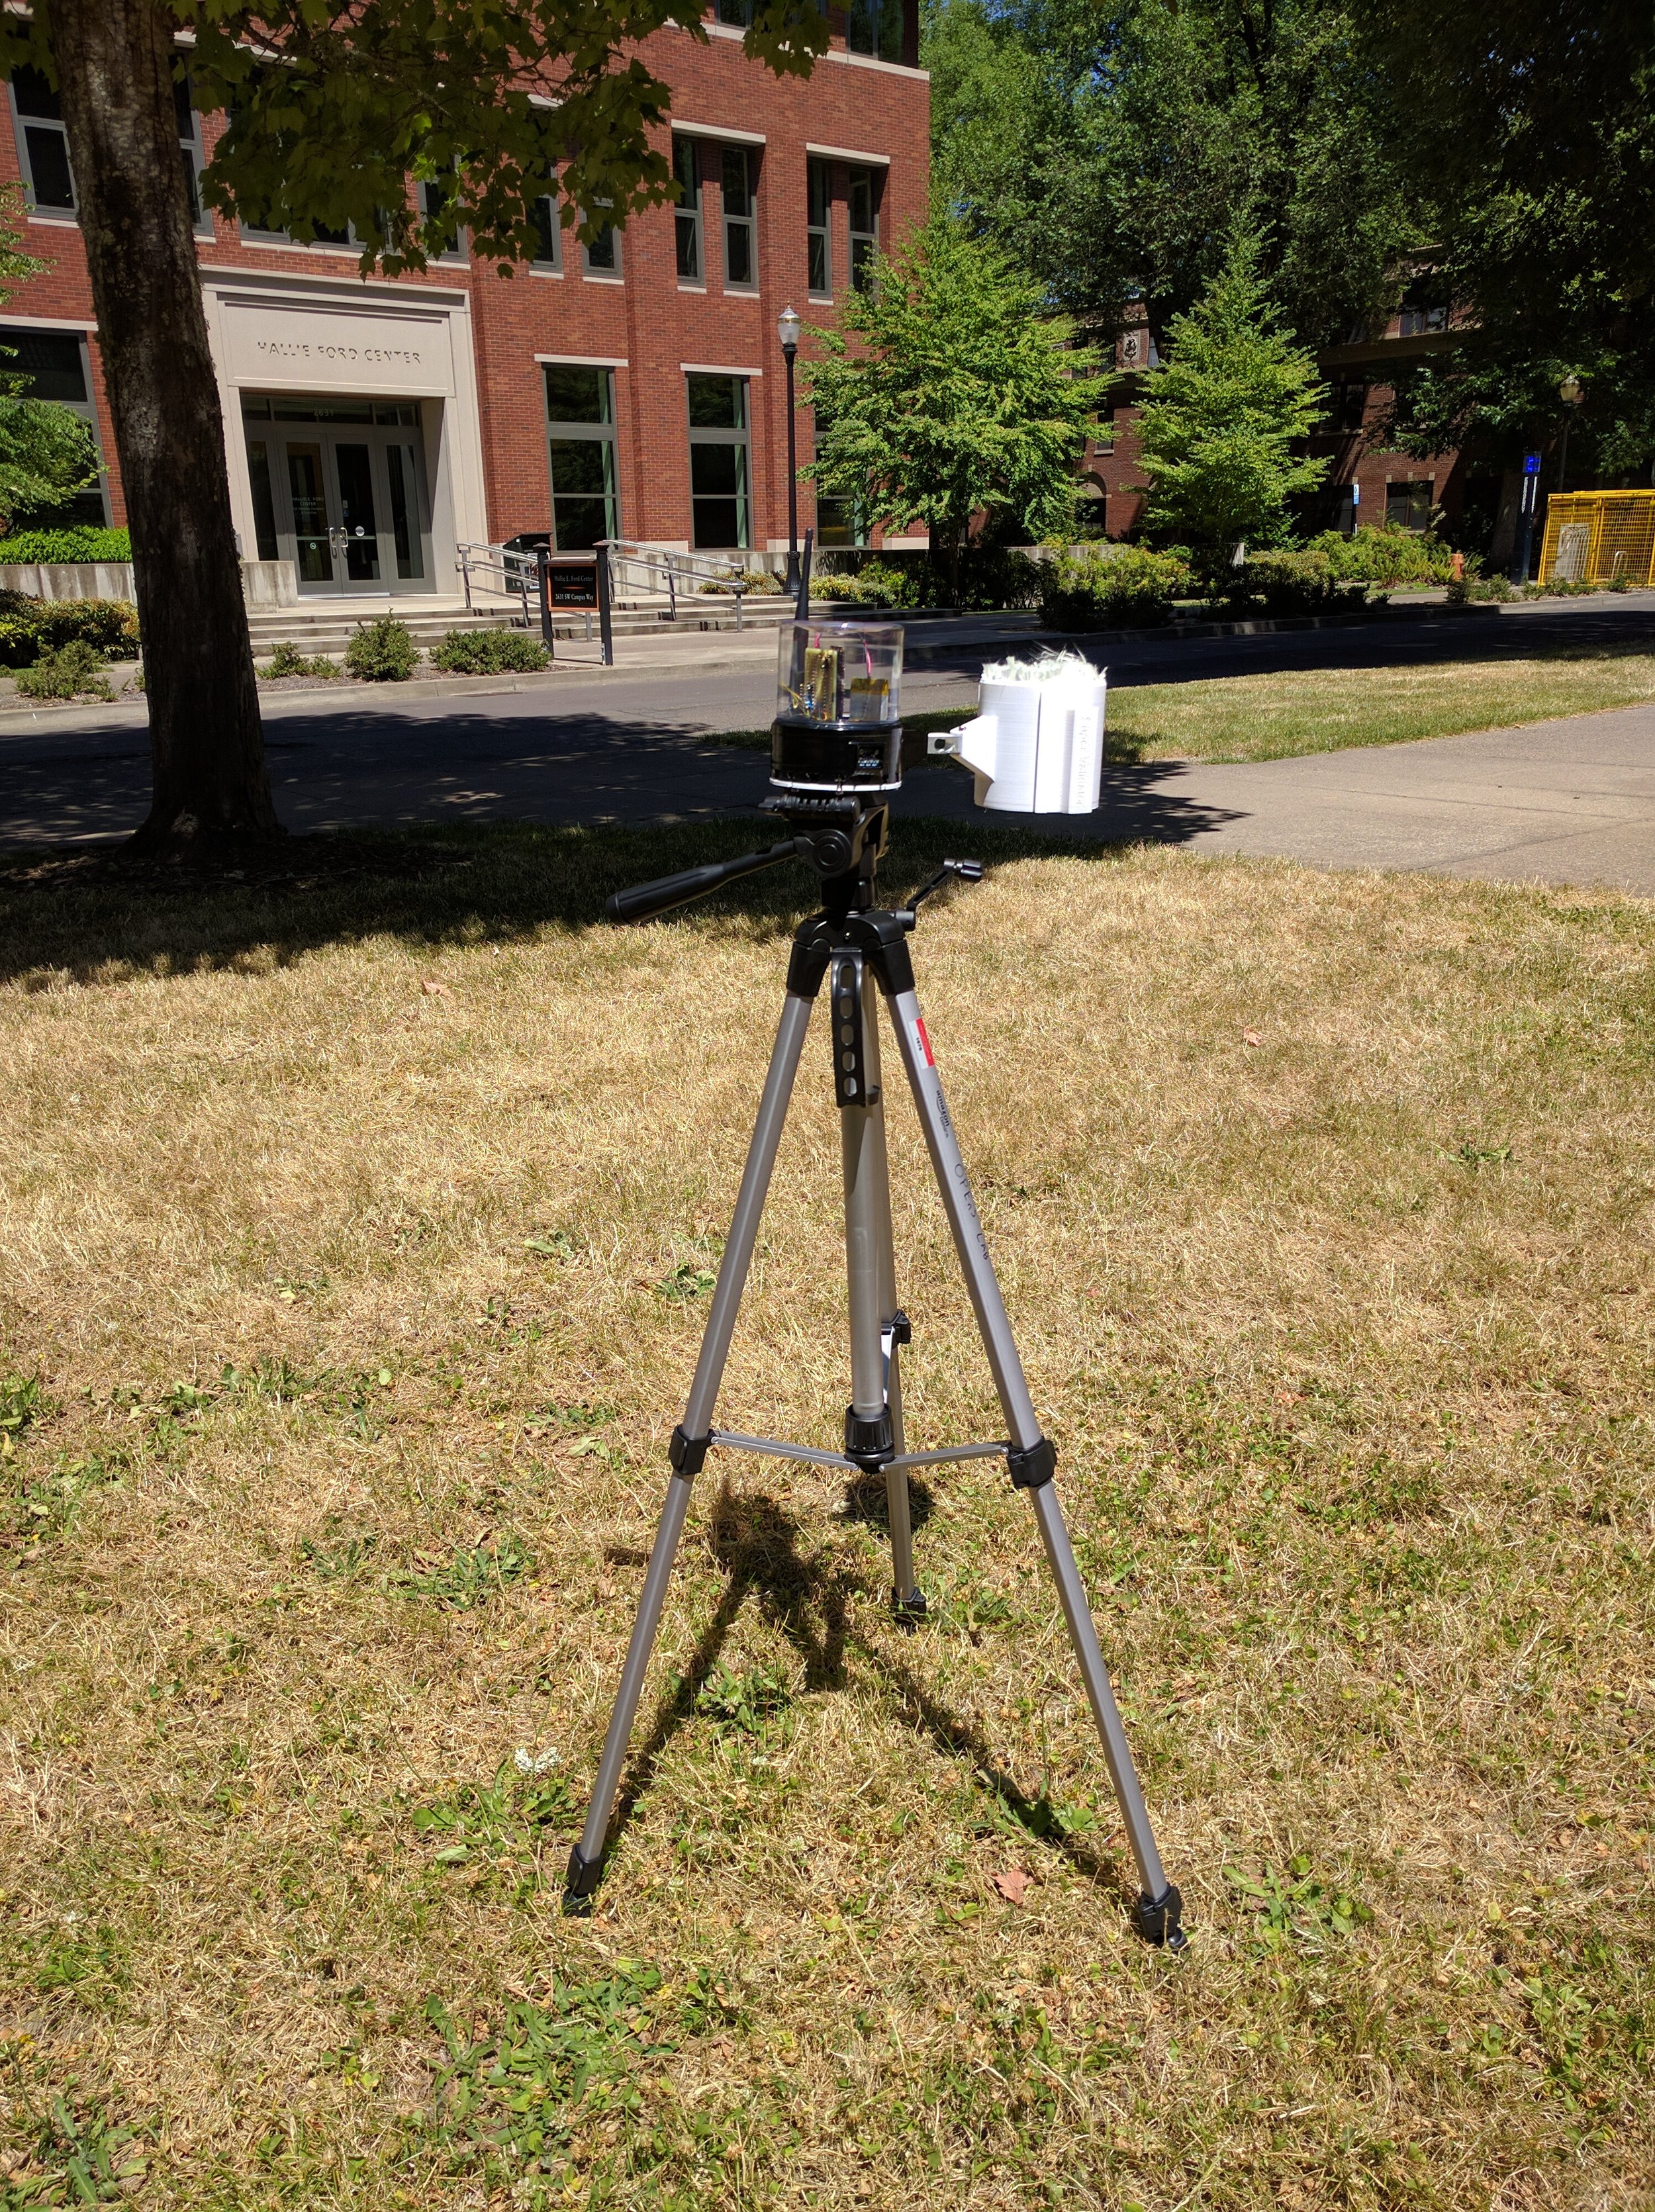
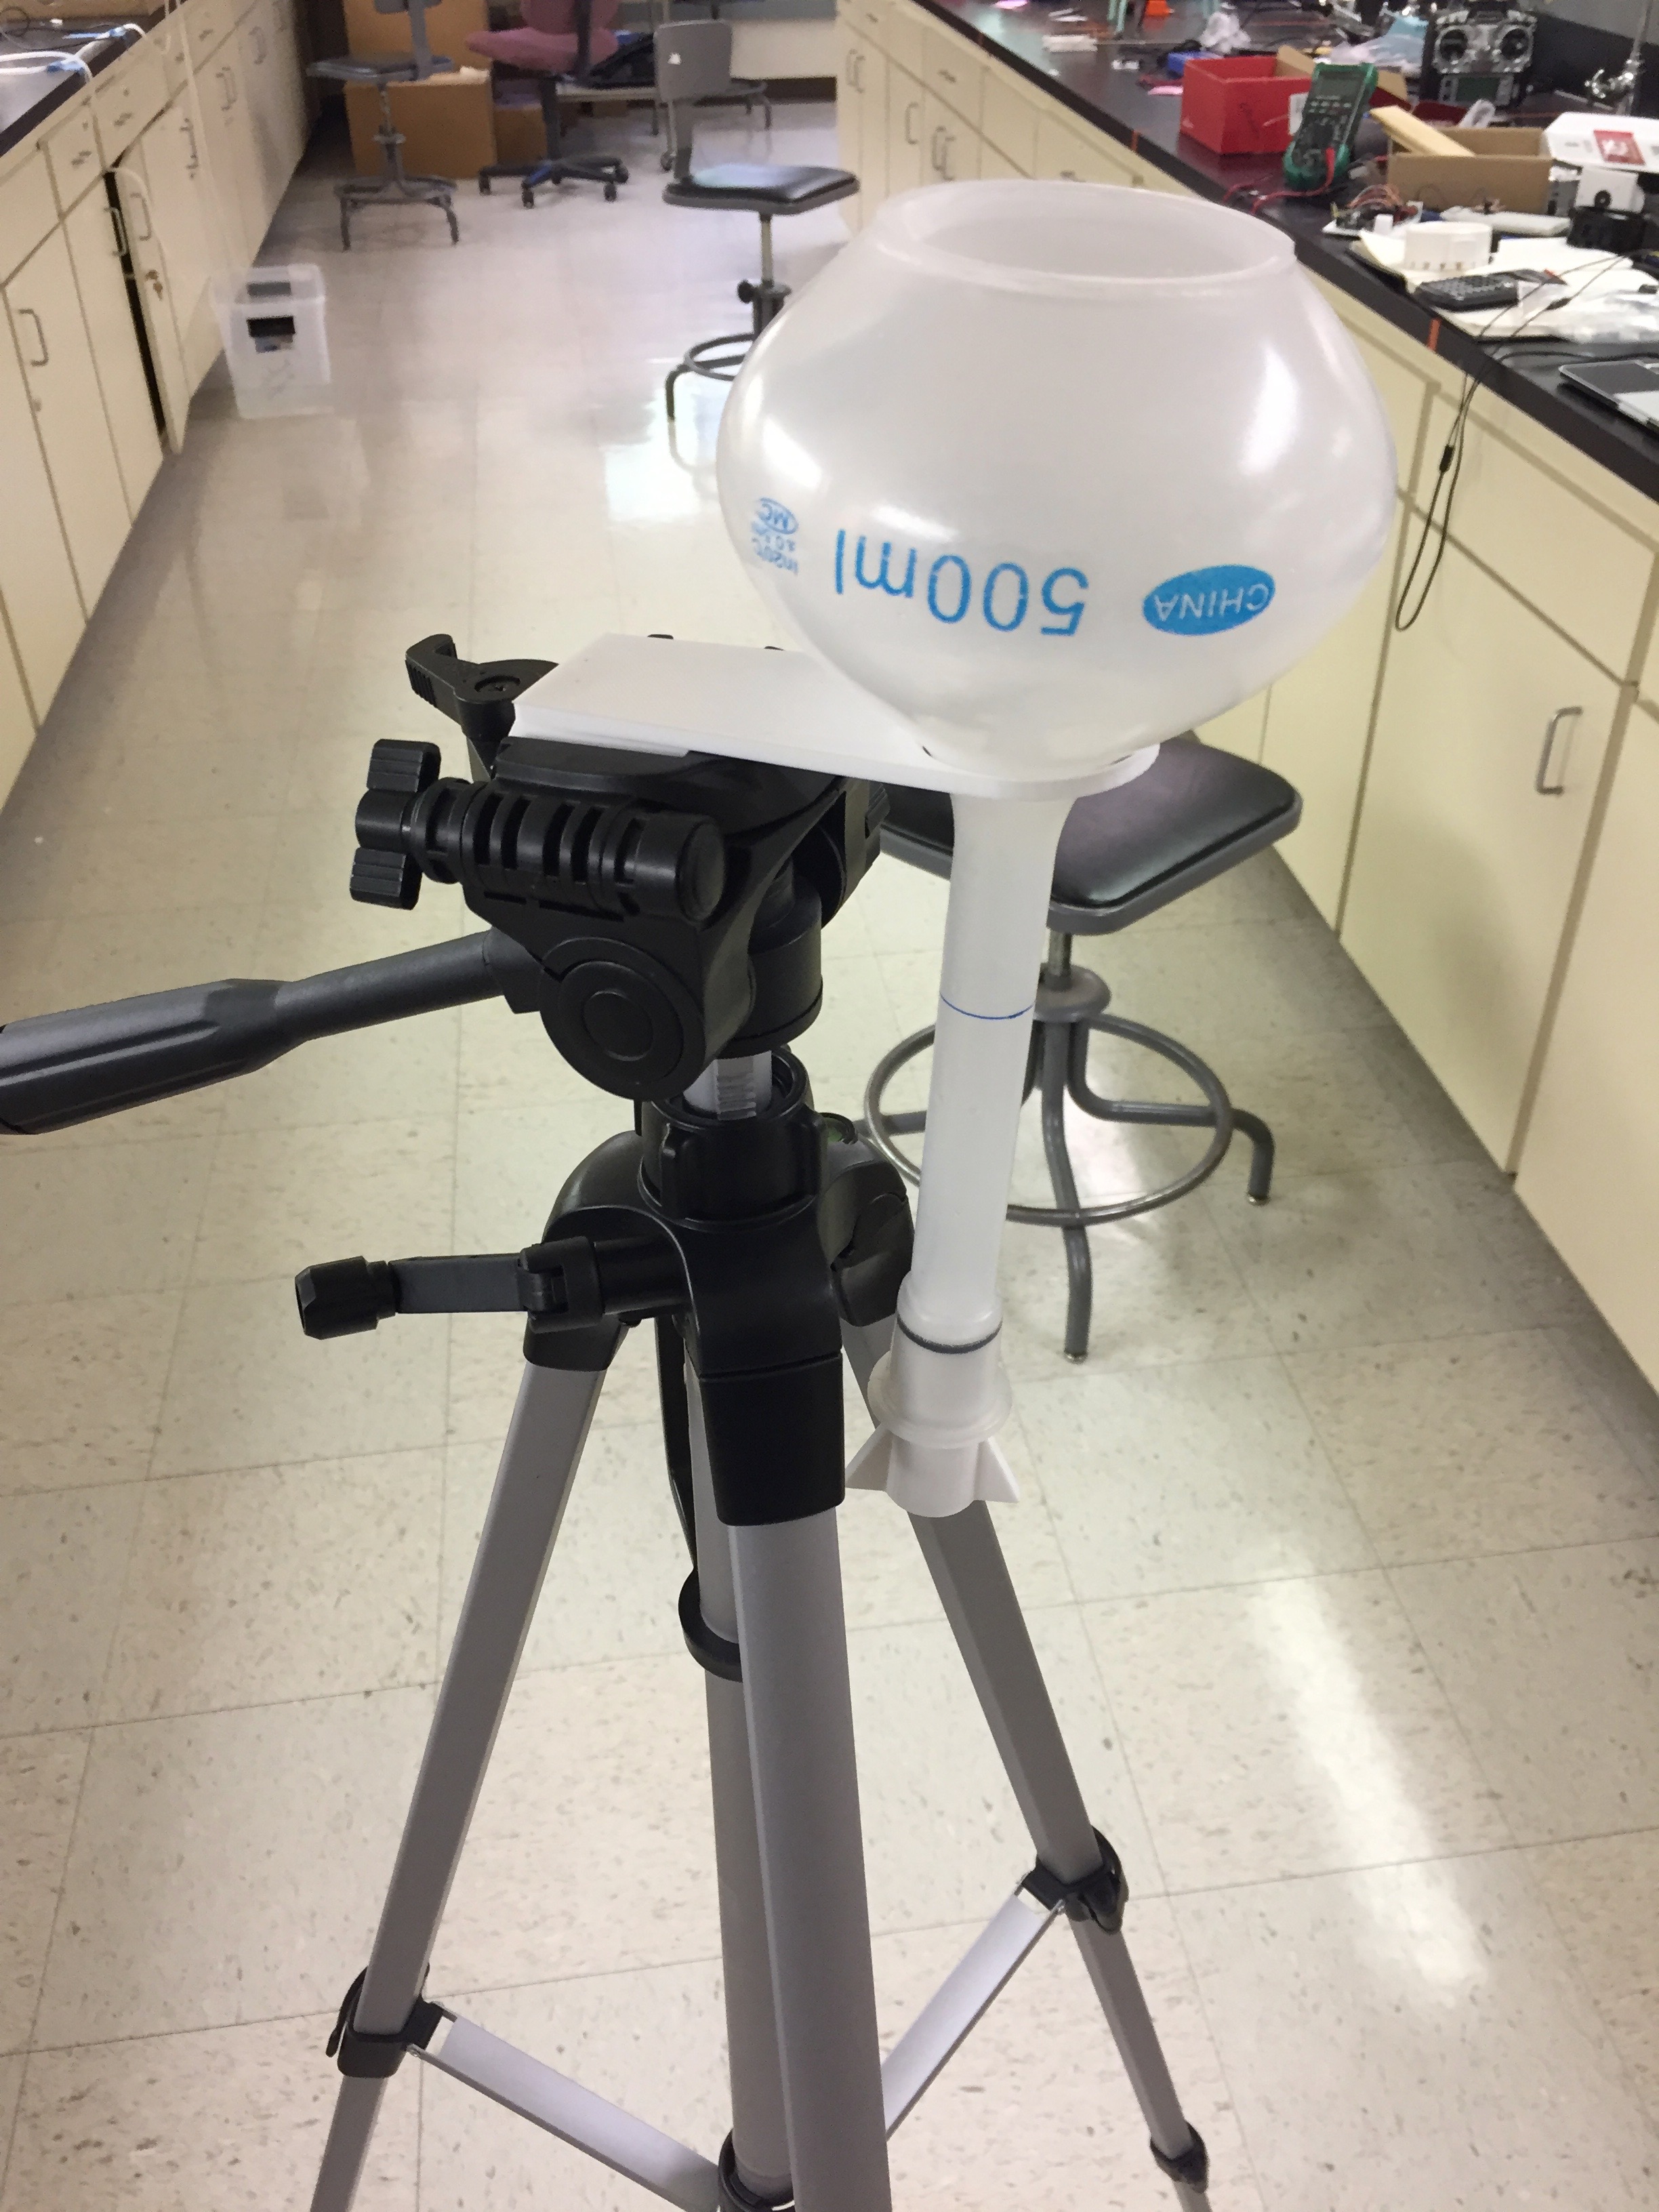
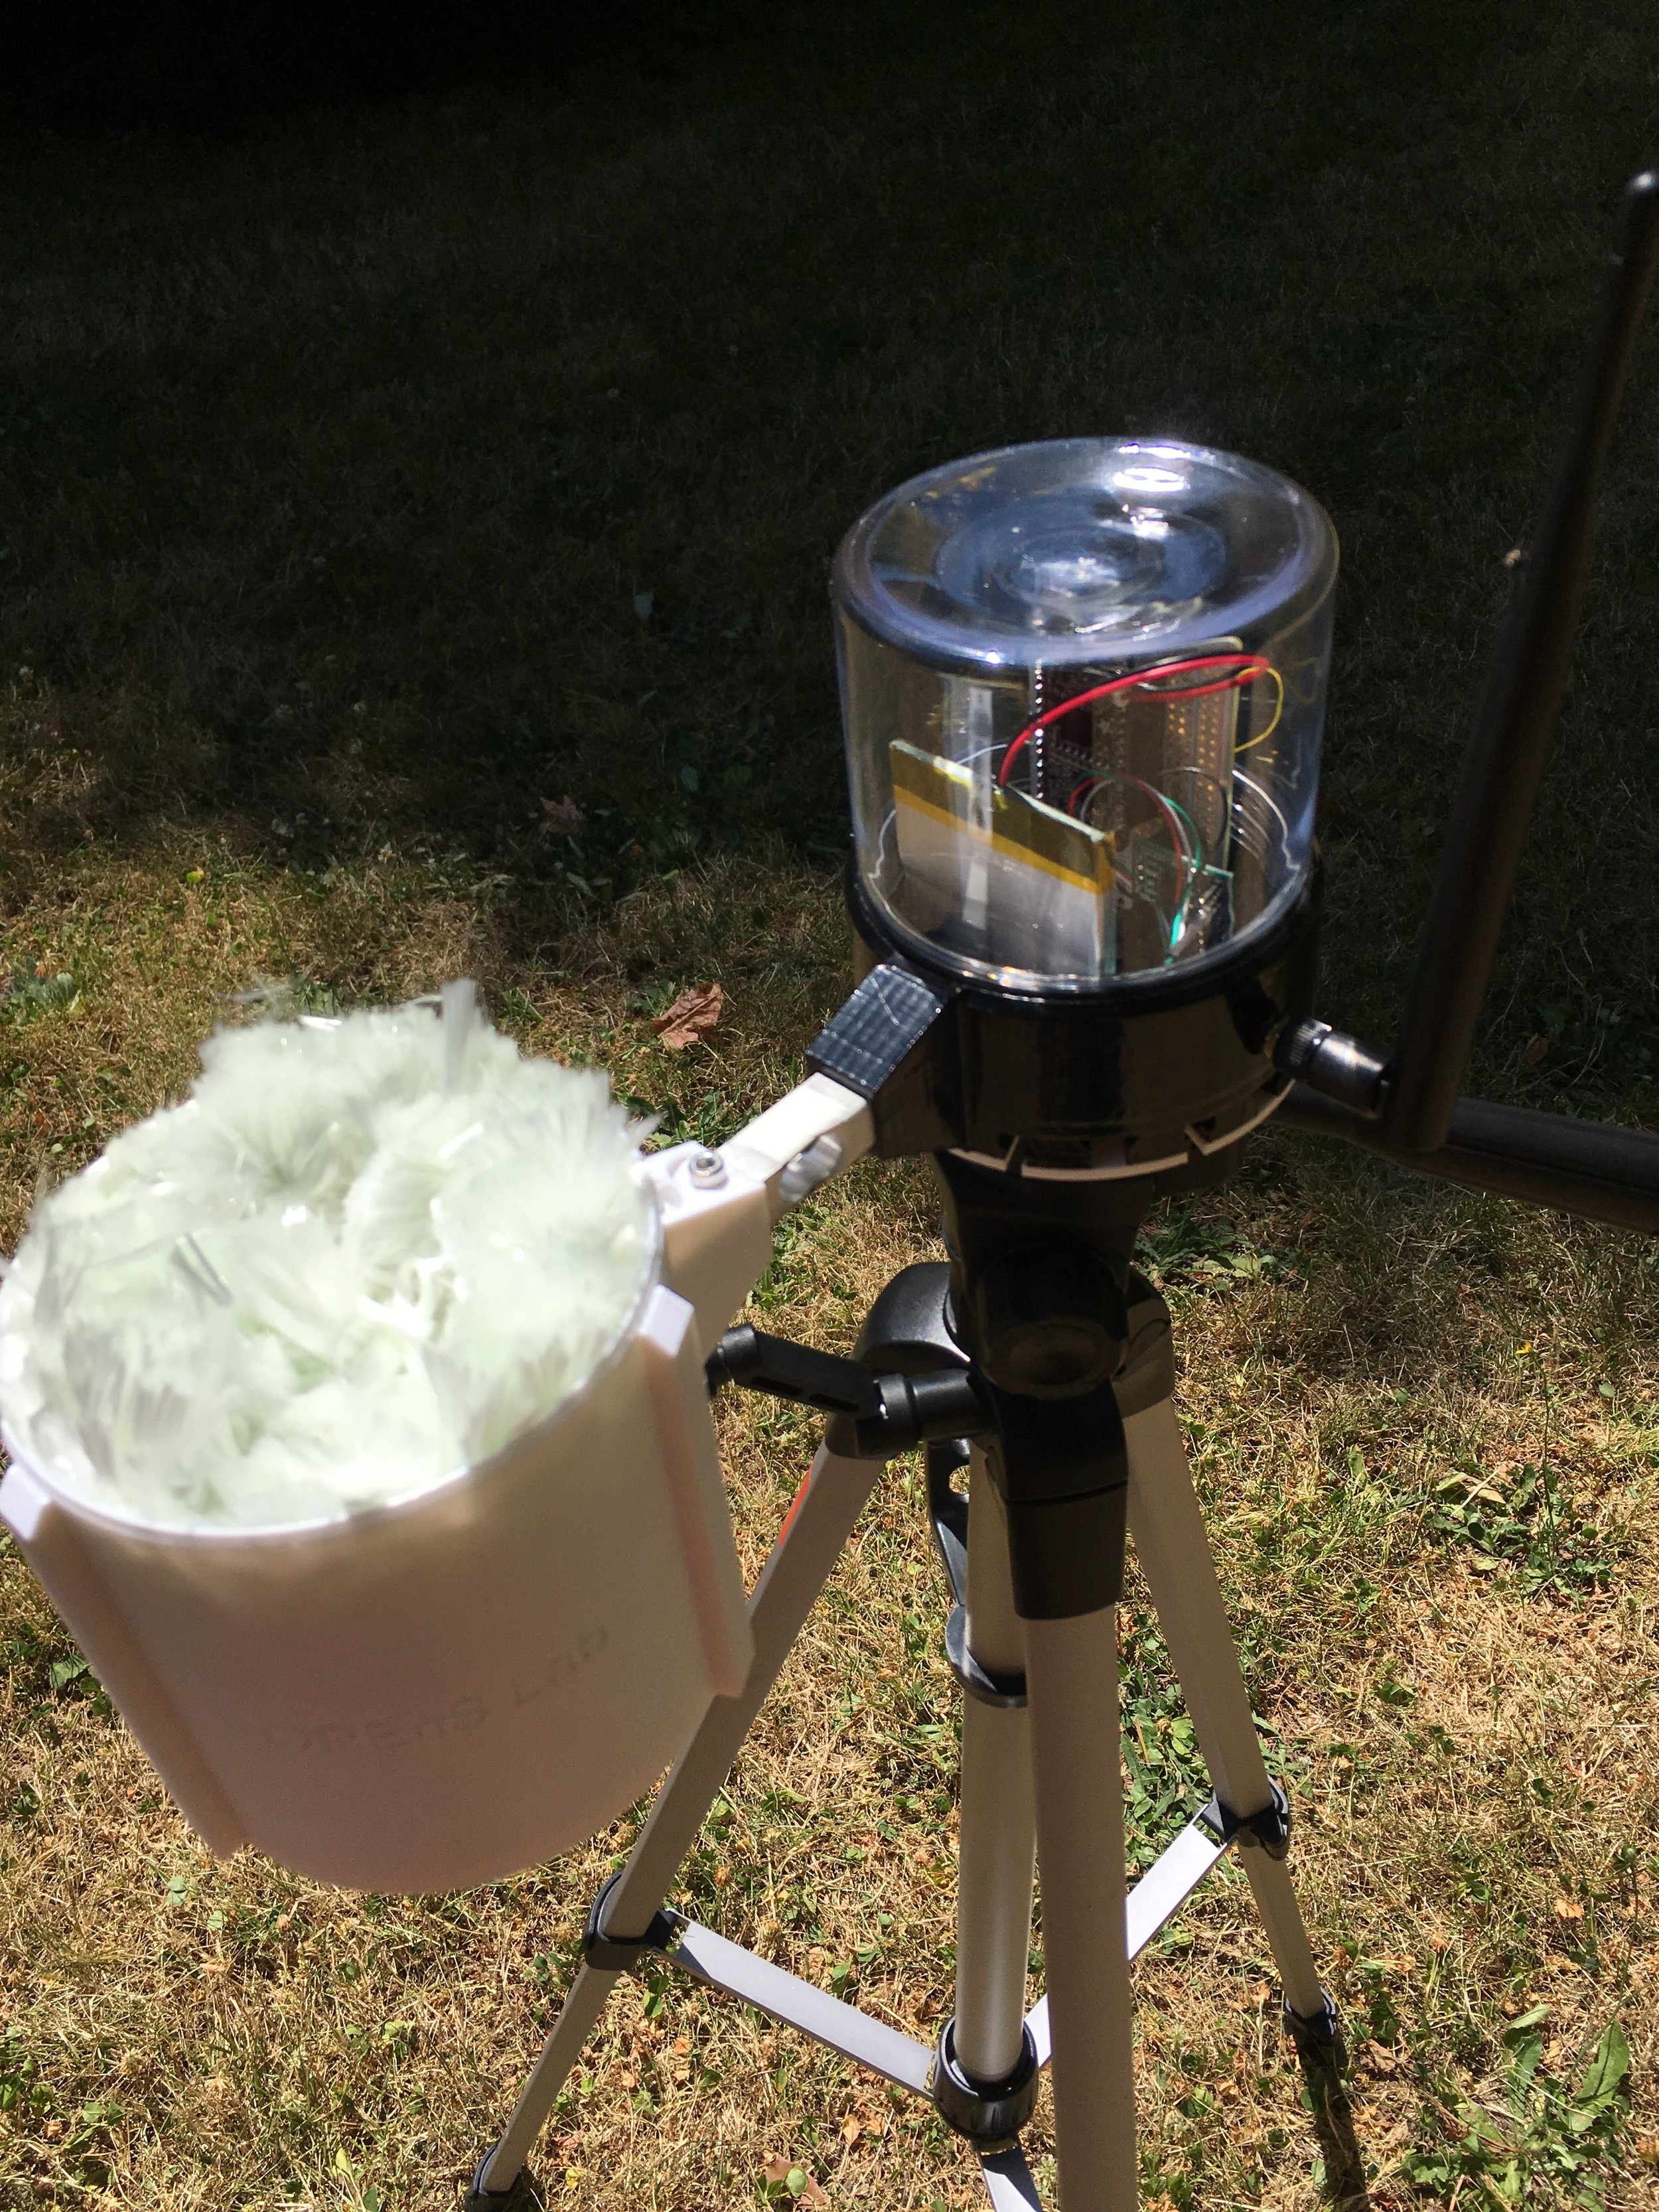
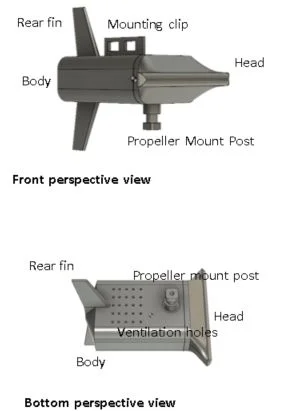
Housing Design
The housing for prototype 2 is composed of two parts, the body and the head. The body is where the electronics will be house. It has a large rear fin for orienting the device into the wind. The mounting clip is used with a 3D printed mounting bracket that allows the devices to hang from a thrust bearing assembly. The propeller mount post is where the propeller will hang below the station when assembled; this includes a hole for wires to run through. The head is easily removable and creates a water tight seal for the electronics as well as housing the battery. When the head is removed, you will have easy access to the SD memory card, an indicator light letting you know the status of the device, the battery connector for charging, and the microcontroller USB port for reprogramming. The bottom side has ventilation holes to allow airflow for the temperature, humidity, and pressure sensors that are all positioned just above the ventilation holes. The holes are also angled so that air can easily flow in from the front and out the back.
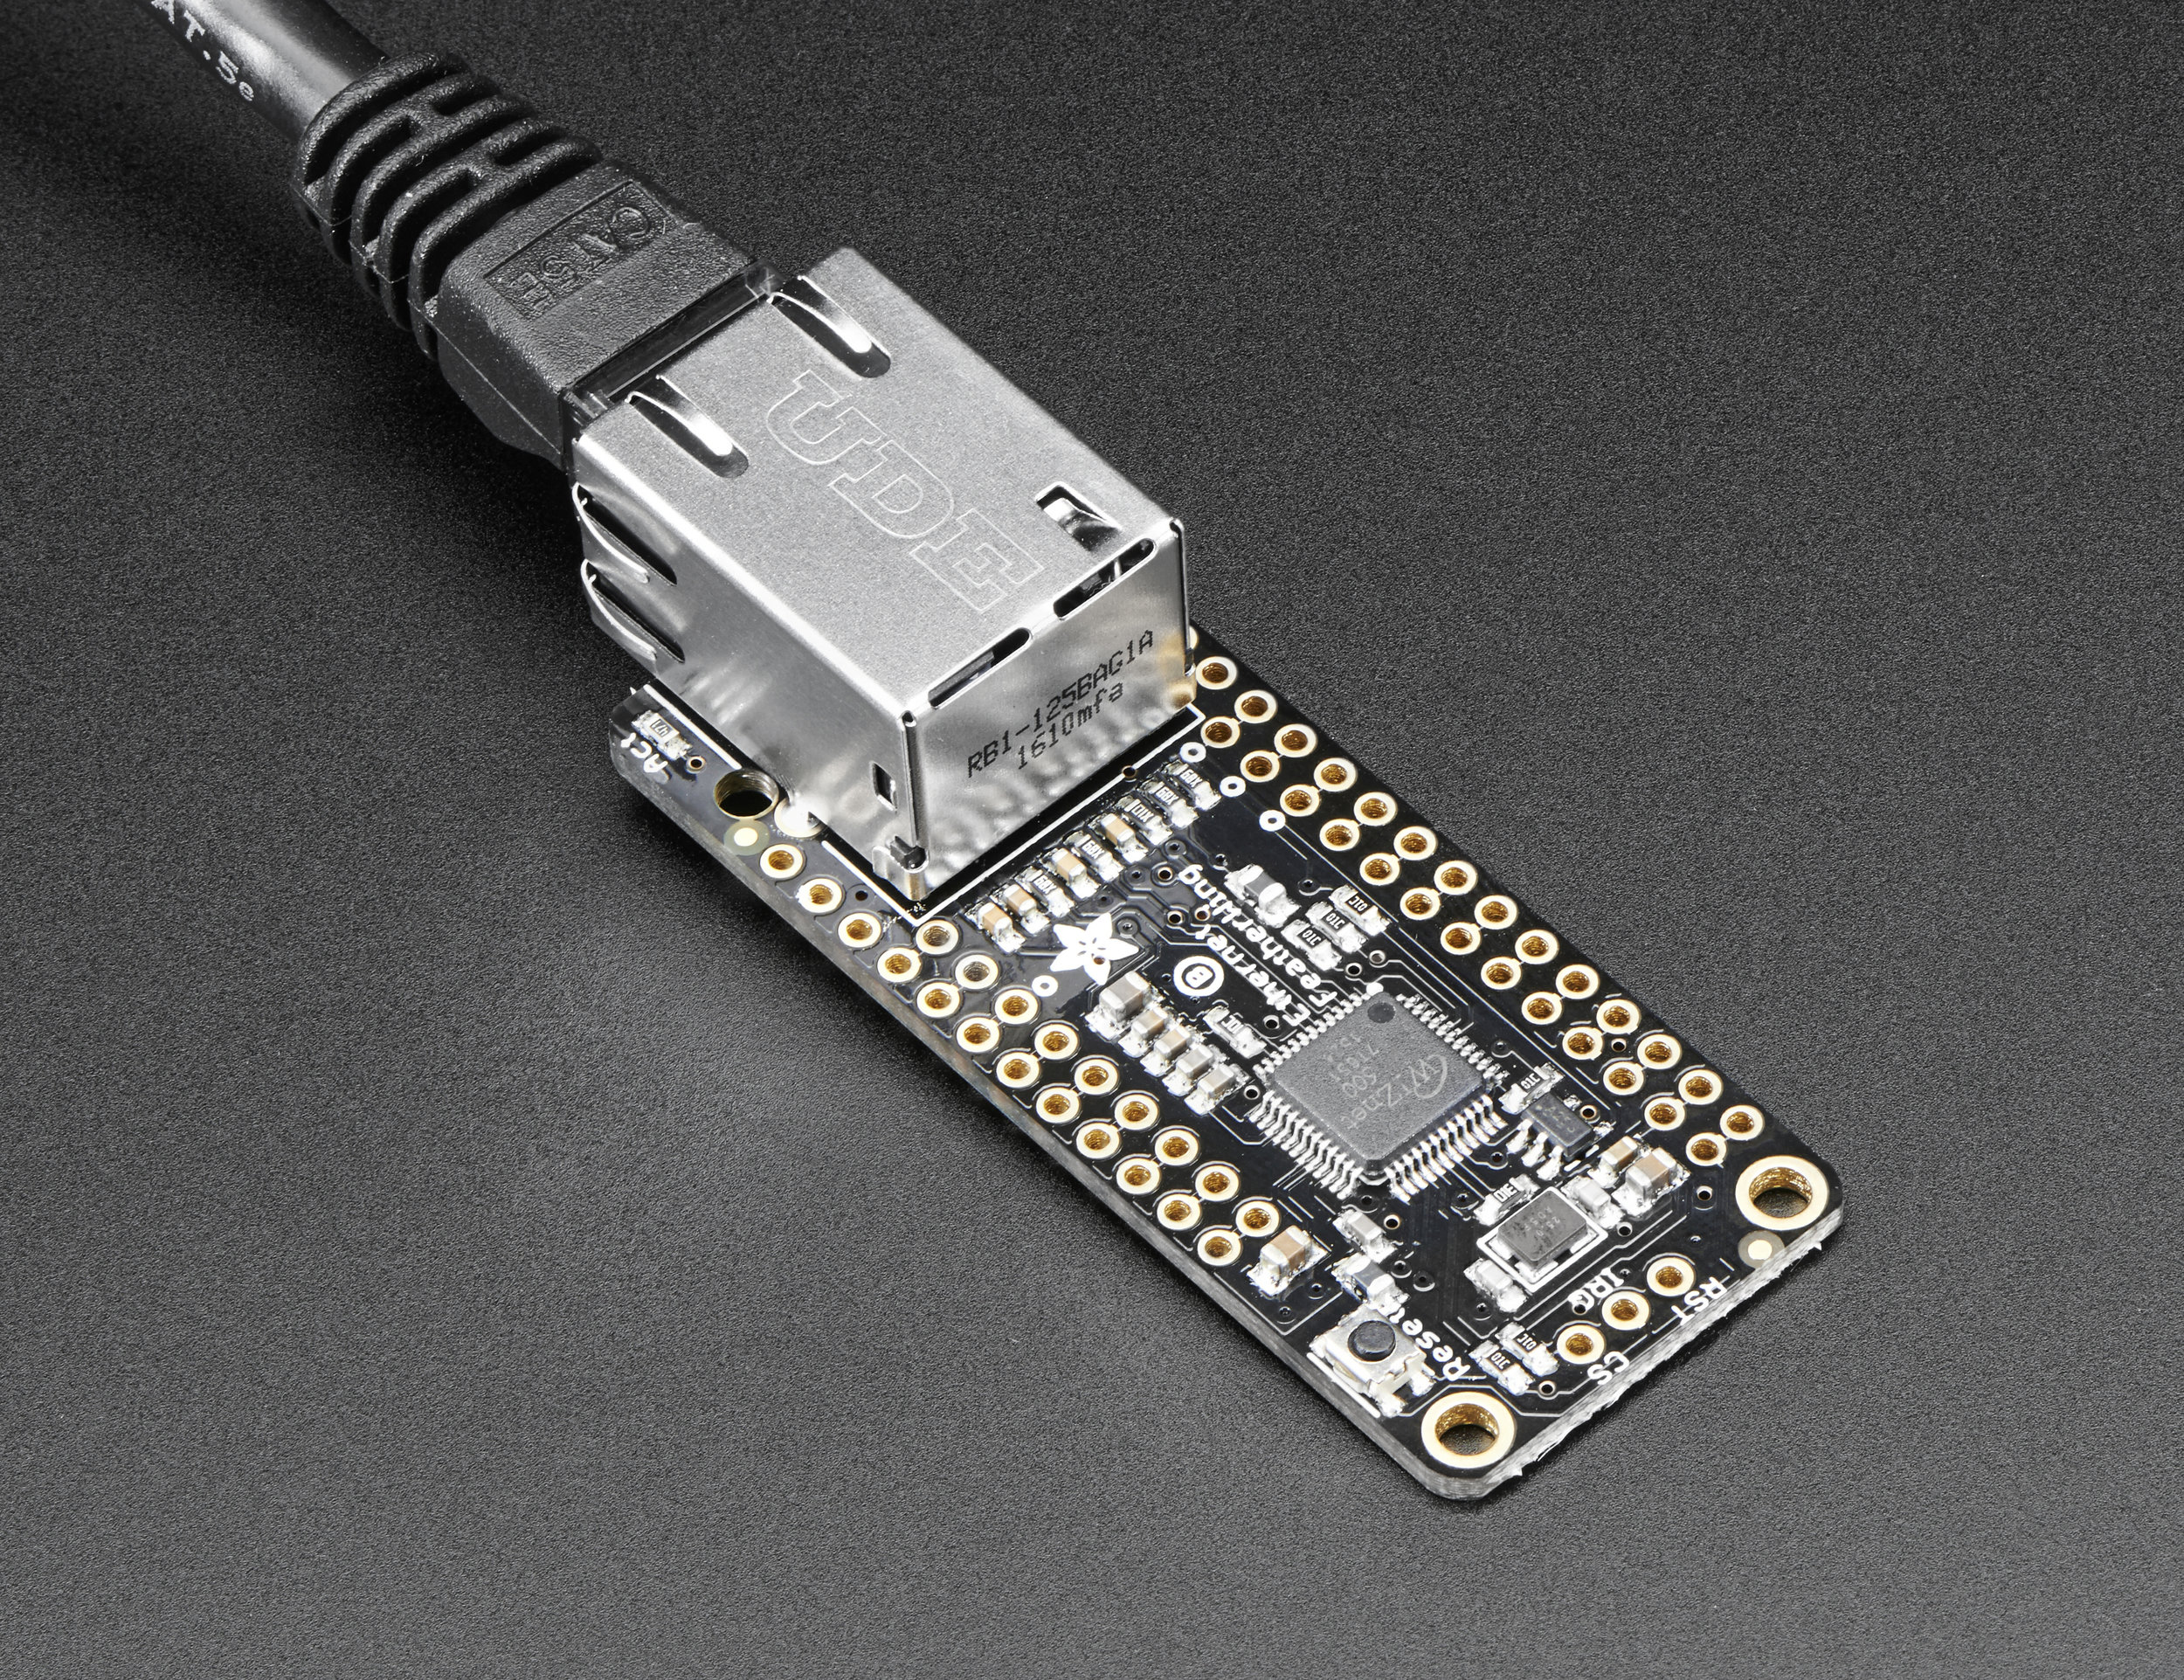
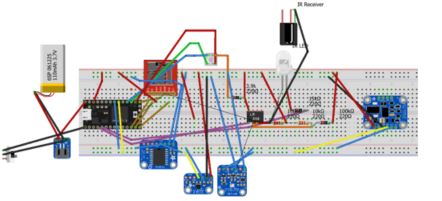

Electronics Design
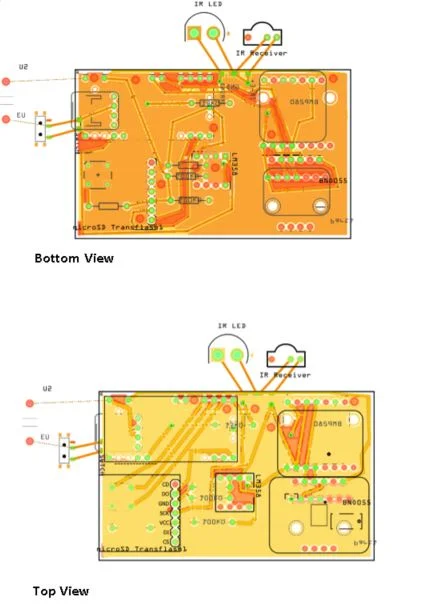
The circuit design is shown below in breadboard view as well as the two sides of the PCB. Currently the circuit is built by printing a custom PCB and soldering the breakout boards for each chip onto our custom PCB. The wind speed sensor is shown as an IR led, IR receiver, and an op-amp comparator circuit. A teensy 3.2 with a Cortex M4 processors is used as the microcontroller.
All devices are chosen to run at 3.3V, and most devices communicate over I2C protocol. This limits the number of wires needed, and also makes it easy to add or swap out I2C parts.
The device is programmed to sleep between measurements to save on power. The orientation sensor, however, stays awake currently. Shutting it down will interfere with the calibration. And sleeping interferes with the orientation calculations that require constant input of data.


Operation
When operating, the station is turned on with a switch. The station undergoes a startup sequence with a color-coded Morse code sequence. Each device is checked for operation. If the morse code is green, the device is operation, if red, it is not. For example, the real-time clock is coded as the Morse letter r (dot dash dot). If a red light is flashed in this pattern, the clock has a problem, if green, it is good. Blue lights indicate some other status.
If all green lights occur, then the device is ready to calibrate. The BNO055 is calibrated by going through a sequence of steps. First, the device should be left stable for ~5 seconds. This calibrates the gyroscope. Each time the gyro is started, it has a different offset value. Allowing the device to sit still lets the device determine the offset and correct future values.
Then, the device should be orientated with each of the six sides facing downward. Slowly wobble the downward face. The goal here is to let the sensor read the earth’s gravitational field on only one axis. It does this by finding the peak value of that axis as you wobble the downward face. Hold each axis downward for about 5 seconds.
Finally, the move the device in as many orientations as possible. This is often done by sweeping the device in a figure-8 pattern. If you do this will spinning around (an entertaining dance for sure), it will provide better results. As you do this, the device creates a map of the magnetic field that it measures on each of the sensor axes. It then calculates hard and soft iron corrections for the magnetometer. This is usually the most difficult sensor to calibrate, and calibration often changes as the device is left out. This can be done for ~60 seconds.
When the device collects a data point, it flashes the indicator LED before collection (short flash) and when storing (long) the data. If the light is green, the device was calibrated during the previous reading. If the flash is red, the device was not completely calibrated.
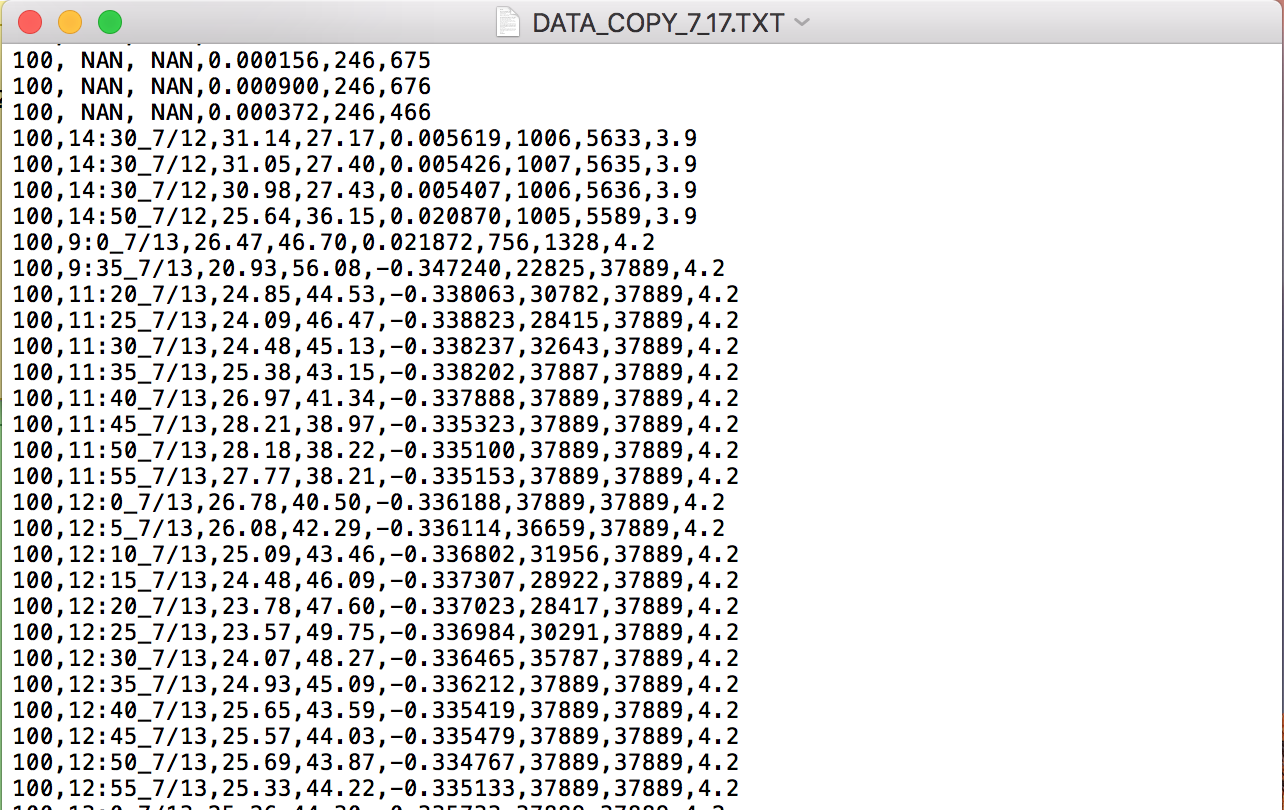
The station will collect data at a pre-programmed time interval and store the data on an SD card. It is powered using a 350 mAh lithium polymer battery, giving a battery life of 15 hours.  When done, the SD card can be removed and the data uploaded to your computer.

Developing an altitude hold algorithm for a quadcopter

Author: Jonah Siekmann

For the past few months, the drone portion of the RFID moisture project has been focused on the altitude hold algorithm of the drone flight controller as a sort of first step towards autonomy.

Abstract

Currently, the user is responsible for throttle, pitch, roll and yaw – in theory, altitude hold would remove the need for the user to moderate throttle while GPS navigation would remove the need for the other three. The user would just need to flip a switch on the remote control, and the drone would use a sonar sensor to determine the altitude from the ground. The sonar is mounted on a gimbal so that regardless of the drone’s orientation, it is always pointing at the ground.

Materials & Description

We constructed a gimbal from two digital servos and used an MPU 6050 to get positional data. We also used an HC-SR04 sonar sensor and arduino to process the data. Initially, the sonar sensor was located directly underneath two propellors, which resulted in propwash interfering with the sensor receiving pings. This meant the flight controller could go for seconds without a single reading indicating its position relative to the ground – an extremely unsafe predicament. It could have crashed or flown dozens of meters into the air in the meantime.

 Some online research revealed that the best place for a sonar sensor was in the exact center of the frame. So the drone’s battery, Arduino, and gimbal were removed and reassembled in a spot that allowed the gimbal to be in the center. The result looks like this:

This allowed for much more consistent readings. Afterward, the problem arose of using a PID controller that assumed a constant time interval to control drone altitude. Normally, a PID controller looks something like this.

  integral += error; //integrate errors by adding them together
  derivative = (error - prevError); //get derivative by finding difference
  prevError = error;
  output = KP * error + KI * integral + KD * derivative; //multiply by gains

And this worked fine for previous flight controllers that I’d written. However, this is because they used a constant loop time of exactly 4ms – meaning that the flight controller would poll sensors for new data exactly every 4ms.

However, in the case of a sonar sensor, the time it takes to get a reading depends on how far away an object is. If a drone is hovering 20 feet in the air, it can take around 40ms to get a ping back from the ground – an extremely long amount of time in computational terms. So instead, an interrupt subroutine was used as described in this instructable:

https://www.instructables.com/id/Asynchronously-Reading-the-HC-SR04-Sensor/

However, this meant that the time in between readings is not constant and can vary hugely. For a PID controller, this is a massive problem – say two readings are taken, the first at 3m and the second at 2m. If there is a one second difference between those readings, then they can be taken to mean that the drone is dropping at 1m/s and needs to be corrected immediately. If there is a ten second difference, it is only dropping at 0.1m/s and the correction should be a lot less forceful. However, the PID controller as above would consider both of these cases to be identical and react inappropriately.

Essentially, it’s necessary to take time into account when reading data from a sensor that does not provide readings at a constant rate. The resulting PID subroutine looks like this:

  int dt = micros() - timeOfLastExecution;
  timeOfLastExecution = micros();

  integral += error * dt; //multiply error by time interval since last reading
  derivative = (error - prevError)/dt; //divide rise over run - dY/dt
  prevError = error;
  output = KP * error + KI * integral + KD * derivative; //multiply by gains

Results

This steps described in this post allowed the altitude hold algorithm to be realized. Below is a video of a rough working version of the altitude hold algorithm – the PID values are not yet tuned. The throttle was not touched for the entirety of the following video after about 0:07 seconds – the only axes controlled were pitch and roll.

Evaporimeter System Testing

Abstract:

The system has been completed and we are now testing the components’ response to semi-realistic conditions. I say semi because it is only being tested right outside the lab. Here is what our setup looks like. 

Objective: 

With these tests that we are running, we aim to verify the functionality of the whole system. We need to make sure that the receiver and transmitter are communicating. On the receiver side, we want to see that it can run on the power supply and no connection to a computer. On the transmitter side, we want it to run on battery and be able to transmit all the data coming in from the sensors. We also intend to verify the data coming in from the sensors.

Materials and Methods:
We are going to implement an evaporimeter system right outside the lab and test the components’ response to the local enviroment. 

To simulate a rainfall we will use the OPEnS Lab rain catcher calibrator with the 20 min setting. Here is the setup:  


OPEnS Lab Evaporimeter TransmitterOPEnS Lab Evaporimeter Transmitter

OPEnS Lab Evaporimeter Transmitter

The image above displays the evaporimeter in action. 


OPEnS Calibrator SetupOPEnS Calibrator Setup

OPEnS Calibrator Setup

We set the calibrator setup above the evaporimeter and allowed it to drip 500ml of water in 20min. 

We have been testing the system and fixing anything to have it ready for deployment; this was all done during July 17th-21st. We will be doing more testing on the 24th to finalize the data collection and begin the analysis. 

One final thing to do is to print the electronics casing in white to prevent the humidity and temperature sensor from reporting incorrect data from the heat absorption of the black plastic. 

Data Logging Using The Ethernet Featherwing.

The Birth of The OPEnS HUB

Abstract

For the past several weeks the primary focus of myself and the other undergraduate researchers at the OPEnS Lab has been to get a working, deployable prototype of an Evaporometer (link here) sensor for use for a partner research group. This project required numerous data transmission protocols and untimely it is our hope to add remote data-logging capabilities using the Ethernet Feathering.  


Our Ethernet Featherwing Shield integrated with the Adafruit  FEATHER 32u4 RFM95   LoRa   Radio  board. Our Ethernet Featherwing Shield integrated with the Adafruit  FEATHER 32u4 RFM95   LoRa   Radio  board. 

Our Ethernet Featherwing Shield integrated with the Adafruit FEATHER 32u4 RFM95 LoRa Radio board. 

Objective

The goal of this project is to establish a means of remotely data logging sensor data to a google sheet via the Ethernet Featherwing shield and the third party cloud based API, PushingBox. For more on how to set up the google sheet and PushingBox service please see a previous project I did using the ESP8266 WIFI chip found here

Materials and Methods

The key components required for this project  were 1) the Ethernet FeatherWing Shield , 2) The Adafruit FEATHER 32u4 RFM95 LoRa Radio – 915 MHz (or Feather board of preference), 3) an authorized Ethernet port with access to the internet, 4) Ethernet cable, 5) Solder, Header pins, and basic electronic skills, 6) and of course a computer with the Arduino Integrated Development Environment (Latest Version downloadable here). 


Bare Ethernet Featherwing ShieldBare Ethernet Featherwing Shield

Bare Ethernet Featherwing Shield


More About the Featherwing

The Ethernet FeatherWing plugs into any Feather (all in one microcontroller made by Adafruit, more info here)  and adds hard-wired networking. To make it as cross-platform compatible as possible, the board is set up using SPI, plus one extra configurable pin. This Ethernet option allows for a strong reliable connection to the internet and can allow for fast, real-time updates via any wired access point. 

Results/Discussion

Preliminary testing of the Ethernet Featherwing showed promising results, however more testing and code modification will be needed in order to log data to google sheets using Domain Name Servers. However, below is some sample code used to determine if a connection has been made to the internet using Adafruit servers. 

  1. /*
  2. Web client
  3.  
  4. This sketch connects to a website (http://www.adafruit.com)
  5. using an Arduino Wiznet Ethernet shield/FeatherWing.
  6.  
  7. created 18 Dec 2009
  8. by David A. Mellis
  9. modified 7/14/2017
  10. by Tom DeBell, For use in the OPEnS Lab
  11.  
  12. */
  13.  
  14. #include <SPI.h>
  15. #include <Ethernet2.h>
  16.  
  17. // Enter a MAC address for your controller below.
  18. // Newer Ethernet shields have a MAC address printed on a sticker on the shield
  19. byte mac[] = { 0x(), 0x(), 0x(), 0x(), 0x(), 0x() };
  20. // if you don’t want to use DNS (and reduce your sketch size)
  21. // use the numeric IP instead of the name for the server:
  22. //IPAddress server(74,125,232,128); // numeric IP for Google (no DNS)
  23. #define URLHOST “www.adafruit.com” // name address for Adafruit (using DNS)
  24. #define URLPATH “/testwifi/index.html” // url to grab
  25.  
  26. // Set the static IP address to use if the DHCP fails to assign
  27. IPAddress ip(192, 168, 0, 177);
  28.  
  29. // Initialize the Ethernet client library
  30. // with the IP address and port of the server
  31. // that you want to connect to (port 80 is default for HTTP):
  32. EthernetClient client;
  33.  
  34. unsigned long lastConnectionTime = 0; // last time you connected to the server, in milliseconds
  35. const unsigned long postingInterval = 10L * 1000L; // delay between updates, in milliseconds
  36. // the “L” is needed to use long type numbers
  37.  
  38. //#define WIZ_RESET 9
  39.  
  40. #if defined(ESP8266)
  41. // default for ESPressif
  42. #define WIZ_CS 15
  43. #elif defined(ESP32)
  44. #define WIZ_CS 33
  45. #elif defined(ARDUINO_STM32_FEATHER)
  46. // default for WICED
  47. #define WIZ_CS PB4
  48. #elif defined(TEENSYDUINO)
  49. #define WIZ_CS 10
  50. #elif defined(ARDUINO_FEATHER52)
  51. #define WIZ_CS 11
  52. #else // default for 328p, 32u4 and m0
  53. #define WIZ_CS 10
  54. #endif
  55.  
  56.  
  57. void setup() {
  58. #if defined(WIZ_RESET)
  59. pinMode(WIZ_RESET, OUTPUT);
  60. digitalWrite(WIZ_RESET, HIGH);
  61. delay(100);
  62. digitalWrite(WIZ_RESET, LOW);
  63. delay(100);
  64. digitalWrite(WIZ_RESET, HIGH);
  65. #endif
  66.  
  67. #if !defined(ESP8266)
  68. while (!Serial); // wait for serial port to connect.
  69. #endif
  70.  
  71. // Open serial communications and wait for port to open:
  72. Serial.begin(115200);
  73. delay(1000);
  74. Serial.println(“\nHello! I am the Ethernet FeatherWing”);
  75.  
  76. Ethernet.init(WIZ_CS);
  77.  
  78. // give the ethernet module time to boot up:
  79. delay(1000);
  80.  
  81. // start the Ethernet connection:
  82. if (Ethernet.begin(mac) == 0) {
  83. Serial.println(“Failed to configure Ethernet using DHCP”);
  84. // no point in carrying on, so do nothing forevermore:
  85. // try to congifure using IP address instead of DHCP:
  86. Ethernet.begin(mac, ip);
  87. }
  88.  
  89. // print the Ethernet board/shield’s IP address:
  90. Serial.print(“My IP address: “);
  91. Serial.println(Ethernet.localIP());
  92. }
  93.  
  94. void loop() {
  95. // if there’s incoming data from the net connection.
  96. // send it out the serial port. This is for debugging
  97. // purposes only:
  98. if (client.available()) {
  99. char c = client.read();
  100. Serial.write(c);
  101. }
  102.  
  103. // if ten seconds have passed since your last connection,
  104. // then connect again and send data:
  105. if (millis() – lastConnectionTime > postingInterval) {
  106. httpRequest();
  107. }
  108.  
  109. }
  110.  
  111. // this method makes a HTTP connection to the server:
  112. void httpRequest() {
  113. // close any connection before send a new request.
  114. // This will free the socket on the WiFi shield
  115. client.stop();
  116.  
  117. // if there’s a successful connection:
  118. if (client.connect(URLHOST, 80)) {
  119. Serial.println(“connecting…”);
  120. // send the HTTP PUT request:
  121. client.println(“GET ” URLPATH ” HTTP/1.1″);
  122. client.println(“Host: ” URLHOST);
  123. client.println(“User-Agent: arduino-ethernet”);
  124. client.println(“Connection: close”);
  125. client.println();
  126.  
  127. // note the time that the connection was made:
  128. lastConnectionTime = millis();
  129. }
  130. else {
  131. // if you couldn’t make a connection:
  132. Serial.println(“connection failed”);
  133. }
  134. }

Below is a screenshot of what the Serial Monitor should print out fallowing a successful test.


Successful Internet Connection Test!Successful Internet Connection Test!

Successful Internet Connection Test!

Future of Project

More updates will be posted here once a connection to Google Sheets has been made. 


– Tom DeBell, Beginning/Continuing Researcher Support Program Researcher

Evaporimeter Deployment Outside OPEnS lab

Author: Marissa Kwon

ABSTRACT

This post is dedicated to our testing results and a few comments about why the Evaporimeter’s first test took so long to complete!

OVERCOMING OBSTACLES


The Evaporimeter on its first test run - mainly for the purpose of debugging and monitoring battery consumptionThe Evaporimeter on its first test run - mainly for the purpose of debugging and monitoring battery consumption

The Evaporimeter on its first test run – mainly for the purpose of debugging and monitoring battery consumption

Ambitious First Testing: While the basic Evaporimeter was fitted with a transmitter and load cell long ago in previous posts, this fairly simple (in C language) task left plenty of room for other functions to be added to our micro controller’s memory.  For quite some time new sensors and features to better our transmitter just kept coming, causing our Evaporimeter to evolve into more of a multipurpose climate sensor.   To have the best first testing experience, we decided to implement those components to collect useful data about the environment and save battery that eventually made it into our final design.

“It Was Just Working Yesterday…”: Prior to testing on Thursday, temperature and humidity data was printing as NaN.  We made sure this was not due to a coding error or a broken sensor and determined the problem was with a faulty I2C connection.  This issue was fixed by switching out the wire wrapped connections with female wire connectors.

TESTING DETAILS

On Thursday 7/13 and Friday 7/14 the Evaporimeter was placed outside and set to record data from 9 am to – 5 pm.  The receiver was left inside connected to an SD card writer, but for this test no data was recorded online.

We programmed alarms to occur every five minutes, so the timestamps below should show data collection at 5 min intervals.  Data to the SD card reads dev ID, timestamp, temperature, humidity, load cell, infrared light, full spectrum light, and battery voltage.  Data from the transmitter is sent as a string separated by commas in a way that is compatible with online google spreadsheets, the final destination for our data once the Evaporimeter is deployed in HJ Andrew’s Experimental Forest.

We placed the Evaporimeter outside with a fully charged battery (at 4.2 volts) we could see how the voltage dropped gradually over the course of a few hours while time stamps could indicate exactly how much time the Evaporimter could run before the battery is cut off (approaching 3.2 volts).  Roughly .2-.3 volts were lost over 24 hour’s time with data being sent at 5 min intervals.  By calculating the total amount of cycles that can be completed with these values, we can safely estimate that the battery would last anywhere from 1.3 – 2 months when data is transmitted on an hourly basis.


A sample of data written to SD card - with NaN data and test data with timestamp and voltage.&nbsp;&nbsp;Data on each line reads dev ID, timestamp, temperature, humidity, load cell, infrared light, full spectrum light, and battery voltage.A sample of data written to SD card - with NaN data and test data with timestamp and voltage.&nbsp;&nbsp;Data on each line reads dev ID, timestamp, temperature, humidity, load cell, infrared light, full spectrum light, and battery voltage.

A sample of data written to SD card – with NaN data and test data with timestamp and voltage.  Data on each line reads dev ID, timestamp, temperature, humidity, load cell, infrared light, full spectrum light, and battery voltage.

Note: We continued to double check and tweak parts of the Evaporimeter during the test on 7/13 explaining the timestamps jumping from 9 – 9:35 and 9:35 – 11:20 at the beginning.

Editor’s note:  After reviewing the data written from our SD card it was evident that closer to .2-.3 volts was being used per day and the first estimation was overly optimistic.  This information was overlooked at first due to the transmitter being off for quite some time on 7/14/17, and more accurate battery life estimations have replaced the incorrect information below:

 [Roughly .2 volts was lost over the course of two days when the transmitter runs continuously waking at 5 min intervals – giving the battery a maximum of 10 days to run if fully charged.  With these values the microcontroller can enter and wake from sleep mode 288 times before the battery drops 0.1 volt. With hourly alarms and we can reasonably estimate the battery will last a few months].

   – Marissa Kwon, Summer REU Student Researcher

The Evaporometer 2.0: Improvements After a Return from a Brief Vacation

Author: Marissa Kwon

ABSTRACT

It has been some time since any updates were posted on development of the Evaporimeter device designed to remotely transmit evaporation data via LoRa transmission to a central receiver and then to an internet hub.  There have been A LOT of changes – so many additions and revisions to the overall design that perhaps now it is best to introduce the Evaporimeter as an entirely new model with an expanded focus on reporting data for a multitude of environmental factors.

And now introducing the OPEnS Lab’s “newest” take on the remote sensing…

COMPONENTS

The aim of our transmitters is to become as powerful and “invisible” to the surrounding environment as possible.  To achieve this we have added and removed various components to make our sensors more efficient and send a wider range of data.  Here is a breakdown of all components attached to our new transmitter.


 - ADAFRUIT FEATHER 32u4 RFM95 LoRa Radio - 915 MHzThis new development board is roughly the same length and width of the ProTrinket, and comes with built-in LoRa transmission capabilities as well as a place to solder in a ufl connector.  The Feather also includes a portable battery attachment which we will be using for our power source 
3078-00-2.jpg

ADAFRUIT FEATHER 32u4 RFM95 LoRa Radio – 915 MHz

This new development board is roughly the same length and width of the ProTrinket, and comes with built-in LoRa transmission capabilities as well as a place to solder in a ufl connector.  The Feather also includes a portable battery attachment which we will be using for our power source


3013-01.jpg

ADAFRUIT DS3231 PRECISION RTC

This external “real time clock” breakout gives our transmitters the ability to enter sleep mode and awaken periodically to collect and transmit data.  While in sleep mode, the microprocessor’s routines are halted and the battery power is conserved.


 - ADAFRUIT SHT31-D Temp/Humidity SensorThis breakout allows our sensors to report back temperature (where 100 degrees F is signified by a 1) and humidity (as a percentage) values using I2C communication.  This breakout will be exposed to the outdoor environment through a small reinforced opening in the sensor housing.  
2857-04.jpg

ADAFRUIT SHT31-D Temp/Humidity Sensor

This breakout allows our sensors to report back temperature (where 100 degrees F is signified by a 1) and humidity (as a percentage) values using I2C communication.  This breakout will be exposed to the outdoor environment through a small reinforced opening in the sensor housing.


 - ADAFRUIT TSL2591 FULL/INFRARED SENSORThe TSL2591 has built in infrared and full spectrum diodes that allow it to separately measure infrared, full-spectrum, and visible light in three modes - simple, advanced, and API.  We will be using the advanced mode to simply report light intensity in the full and infrared spectrum.  As for visible light, we would like to add another RGB color sensor in the near future.  

ADAFRUIT TSL2591 FULL/INFRARED SENSOR

The TSL2591 has built in infrared and full spectrum diodes that allow it to separately measure infrared, full-spectrum, and visible light in three modes – simple, advanced, and API.  We will be using the advanced mode to simply report light intensity in the full and infrared spectrum.  As for visible light, we would like to add another RGB color sensor in the near future.


 - HX711 LOAD CELL and STRAIN GAUGEThis hasn't changed since the update and will be used to help measure evaporation by calculating the difference in the weight of the water in the catchment over time. 
next.png

HX711 LOAD CELL and STRAIN GAUGE

This hasn’t changed since the update and will be used to help measure evaporation by calculating the difference in the weight of the water in the catchment over time.

– Our battery was also replaced from 1000 mAh to a larger 2000 mAh one, allowing us to leave the sensors in the field undisturbed for a longer period of time.

More updates on the new transmitter and a discussion on our sensor’s potential use for wide range of studies to come.

Another post describing the results of field testing on the Evaporimeter equipped with RTC and sensors will be posted hopefully by the end of next week.

– Marissa Kwon URSA/Summer REU Student Researcher

Modeling at HyperRail Speed!

Abstract:

We have decided to go with the 20x40mm V-Slot aluminum extrusion for the rail version of the hyperspectral mount. It balances strength, function, and price. Here is an update of the CAD model of the design. 

Objective:

To design the whole system to have a visual and have all parts ready for printing when the aluminum extrusion, boards, and motors come in. 

Materials and Methods:

I will be using Fusion360 to CAD the model and design all the parts that will be 3D printed. Some parts already have models from the manufacturer, so theses will only require assembly in the model.

Results:

The following are the assemblies of the parts and the designs of the parts to be 3D printed. Most of the HyperRails will be straight forward to assemble, this is because the extrusion is made for linear motion systems. The pieces that will be 3D printed will be the motor mount, string roll, extrusion connectors, tripod connectors, and rope guide. 

This is the assembly of the whole system with the major pieces. 

Preparing Evaporometer for Andrew’s Cyber Forest Deployment

Author: Chet Udell


Evaporometer team meeting at OPEnS Lab. Bo Zhao (OSU GeoVisualization) and Chet Udell (Director, OPEnS) center holding Evaporometer transmitter node. Marissa Kwon and Manuel Lopez (far right) Evaporometer technical team. Shaozeng Zhang (front-right) from Anthropology plans to study the interplay of data, translation, mapping, and public engagement with this project.Evaporometer team meeting at OPEnS Lab. Bo Zhao (OSU GeoVisualization) and Chet Udell (Director, OPEnS) center holding Evaporometer transmitter node. Marissa Kwon and Manuel Lopez (far right) Evaporometer technical team. Shaozeng Zhang (front-right) from Anthropology plans to study the interplay of data, translation, mapping, and public engagement with this project.

Evaporometer team meeting at OPEnS Lab. Bo Zhao (OSU GeoVisualization) and Chet Udell (Director, OPEnS) center holding Evaporometer transmitter node. Marissa Kwon and Manuel Lopez (far right) Evaporometer technical team. Shaozeng Zhang (front-right) from Anthropology plans to study the interplay of data, translation, mapping, and public engagement with this project.

Abstract

The Evaporometer wireless star network system is weeks away from being prepared for the Andrew’s Cyber Forest! This post details the features and improvements leading up to the current state of the system.

Objectives

Bo Zhao (OSU GeoVisualization) and Chet Udell (Director, OPEnS) have teamed up to deploy a number of wireless environmental sensors in the Andrews Cyber Forest. The Evaporometer wireless star network currently consists of one receiver hub connected to the web and a group of sensor transmitter devices. Devices communicate through LoRa long-range low-power radios up to 20km line of sight. Data will be publicly accessible and visualized in realtime by Bo Zhao’s group.

Devices

Transmitter nodes consist of the following:

Hub consists of:

Method of use

Multiple Transmitter nodes will be distributed in a star network arrangement around the central hub. They will each transmit data from their sensors in 15min intervals. Receiver Hub will log each transmission onto a local micro SD card. It also uploads transmissions in near real-time onto a secure Google spreadsheet. Bo Zhao’s bots will dynamically pull data from this sheet for visualization.

Deployment will take place July 27.

OPEnSampler Update, Bertha

By: Chet Udell

Abstract

Our efforts over the past moths have culminated in a robust lab-tested prototype of the OPEnSampler we endearingly call “Bertha.” We’ve determined this will be our in-house lab prototype that we will use as a testing bed for integrating new features and hardware. Lessons learned experimenting with Bertha will directly translate into field-deployable OPEnSampler versions to be distributed for use. This post details the technical specifications of Bertha, features, Serial Commands, and use cases.

Technical Specs

  • Frame dimensions are 24in x 12in x 12in and made out of 40mmx40mm extrusion.
  • 2 12VDC Peristaltic pumps (250ml water pumped in 2min)
  • 24 250ml aluminum-lined Mylar bags (spout packs)
  • 25 12VDC valves (24 valves attached to bags, 25th valve is used as a system flush outlet valve)
  • Arduino Uno, Microprocessor
  • Custom PCB with TPIC power-shits registers for handling valve actuation
  • Motor driver board
  • High Precision, Temp-compensated Real-Time Clock, for microprocessor sleep/wake(sample) scheduling.
  • Mode switch toggles between Sampler operation modes: standard operation mode, serial command mode.
  • EEPROM saves configuration of sampler parameters (sample duration, flush duration, next valve to sample, etc).
  • Serial command set for configuring the sampler’s behavior out in the field and for sending discrete commands (puppet-string) to turn on/off discrete components of the sampler. e.g. turn pups on/off/reverse and open/close specified valves.
  • Power-save Sleep mode, for ling battery life in the field. At the moment, drawing 24 250ml samples should require just 1 Amp Hour of a 12VDC battery. In standard operation mode, sampler stands by in low-power sleep in between taking samples. In serial command mode, electronics remain awake and stand by for configuration commands from computer.

Modularity

In consultations with many different researchers hoping to use this OPENSampler, we identified that the technical specifications of the sampler will vary depending on the context of use. This includes: What kind of water source is being sampled, what is being tested or analyzed, and environmental conditions and considerations in the field. To this end, we decided to make a “core” system that would be extensible using attachments for particular deployment contexts. This architecture is not dissimilar with many vacuum cleaner systems, where the core remains immutable but changes utility based on the attachments used.

Packaging: The frame is designed to be dropped into a variety of different “packages” depending on the field requirements. In many instances, a waterproof duffle bag may suffice for carrying the device into back-country environments. Rigid stack-able boxes made from corrugated plastic may be desirable for other deployments. For field deployments requiring samples be temperature protected (from wither extreme heat or cold), dropping this into a rolling lockable travel cooler such as the Pelican 80qt Elite.

Use

Switch the sampler into “serial command mode.” Not required, but should be done for best practice. After programming the Uno over USB, you may either switch the sampler directly into standard operation mode or send serial commands to configure your sampler’s parameters. Switching modes back and fourth may be done at anytime. In operation mode, a sample cycle is initiated whenever the specified time has elapsed.

Each sample cycle consists of the following states:

  1. System Flush
  2. Sample Draw (in next bag in sequence)
  3. System Sleep/standby

Samples may be removed from the device without manually removing bags. This is achieved by switching the sampler into serial command mode and typing commands into the Arduino Serial Monitor window to draw samples out one by one in any desired order. See commands below. This process may be automated (and should be) using a program to send a sequence of timed commands. A sample python script can be found on the project GitHub site.

Sampler Configurable Parameters and Factory Defaults Are:

  • IsDaily = True (Take a sample either daily or at a set periodic rate throughout the day)
  • 8:00 (default daily time to take sample)
  • Sampler Duration = 100 seconds (takes 120 seconds to fill 250ml)
  • Flush Duration = 30 seconds (this will need to be set based on the length of tubing away from main sampler – longer tubing requires longer flush duration for full system purge)
  • Sample volume = 250 (in ml, this isn’t being used right now, but there in case features need in the future)
  • Sample Valve Number = 1 (next bag to draw sample into)
  • Sample Period = 3 (if the IsDaily flag is FALSE,

The above parameters may be changed at anytime by switching into Serial Command Mode. Parameters are saved in EEPROM and are preserved even if the sampler looses power. Sampler operation will proceed with the new configuration behavior when switched back into operation mode.

Serial Command Set

  • CLK, Checks the current RTC time, Hr:Min:Sec – useful for checking before using SA to set sample alarm
  • SAD (int)X (int)X, sets “Daily Sample Alarm” Hr:Mn to take samples daily at time. Uses 24hr format.
    ex: SAD 9 30 sets sample alarm to 9:30AM daily.
    ex: SAD 16 22 sets sample alarm to 4:22PM daily.
    Also sets Is_Daily flag for initialization if power-down restart, clears Is_Hourly flag
  • SAP (int)X, sets “Periodic Sample Alarm” to take samples at specified period duration in Min.
    ex: SAH 30 sets sample alarm to go off every 30min.
    ex: SAH 47 sets sample alarm to go off 47min.
  • FD (int)X, sets “Flush duration” period in ms, should be about 20sec, but will change with the length of tubing you use to get from sampler to water source
  • SD (int)X, sets “Sample Duration” time that pumps run water into each bag in milliseconds
    ** removed for this version : SV (int)X, sets “Sample Volume” in ml, a transform of Sample Duration, may not be 100% accurate, 2min per 250ml,
  • VN (int)X, Sets the next valve/bag to place sample. Sampler saves curent valve number during operation in EEPROM in case of power failure, it picks up where it left off. This ensures you can reset the valve count before each new deployment, or manually skip to next available bag should the sampler malfunction
  • RST, Full system “factory” reset – set default sample period, sample duration, reset vlve counter, writes defaults to EEPROM (over-wirghting previous settings)

Pupet-String Commands:

  • Vx (int)#, Turn valve on/off where x is valve number (starting at 1, V0 is flush valve). # is 1 for on (open) and 0 for off (close) example: V1 1 opens valve 1. V1 0 closes it.
  • M #, turn motor on/off and direction. #=0 for off, #=1 for draw water into sampler, #=-1 for draw water out of sampler    example: M 1 will begin drawing water into sampler.

From here, you may use Arduino IDE, Python, or other software to send timed sequences to sampler. For example: V0 1 followed by M 1will begin flush.  The sequence (press return where you see / ) V0 0 / V1 1 / M 1will disable flush and draw water into bag1
You could also make a “macro” or timed program in something like Python for drawing water out of the sampler sequentially into your analysis machine without removing bags! Example of this is on the project GitHub site.

Features to be integrated for Zurich Version

The Zurich version is underway, with frame being constructed out of much lighter 15mmx15mm extrusion. This will make the total sampler weight (without filled with water) about 10lbs!

Packaging: The frame is designed to be dropped into a variety of different “packages” depending on the field requirements. The package for Zurich is intended to be a waterproof duffle bag. However, for field deployments requiring samples be temperature protected (from wither extreme heat or cold),

Currently, all sampler status messages are reflected on the Arduino IDE Serial Monitor window when sampler is attached to host computer. We’re evaluating an OLED display that will show all status information during sampler operation.  There will also be a wake button for the display that will show the status of the sampler at anytime during its sleep cycle.

Features for future versions

One major issue is not knowing the operational status of your sampler when left out in the field. Instead of being forced to check in on the sampler in person, we plan to integrate a GSM extension for the core, which will send updates over texts or emails using any 2G SIM card.