A probe was built as described in this build guide. The following data was returned from the sensor. This probe is was designed by Dongjun Lee and Jonathan Fookes using the previous design from Brett Stoddard.
Methods
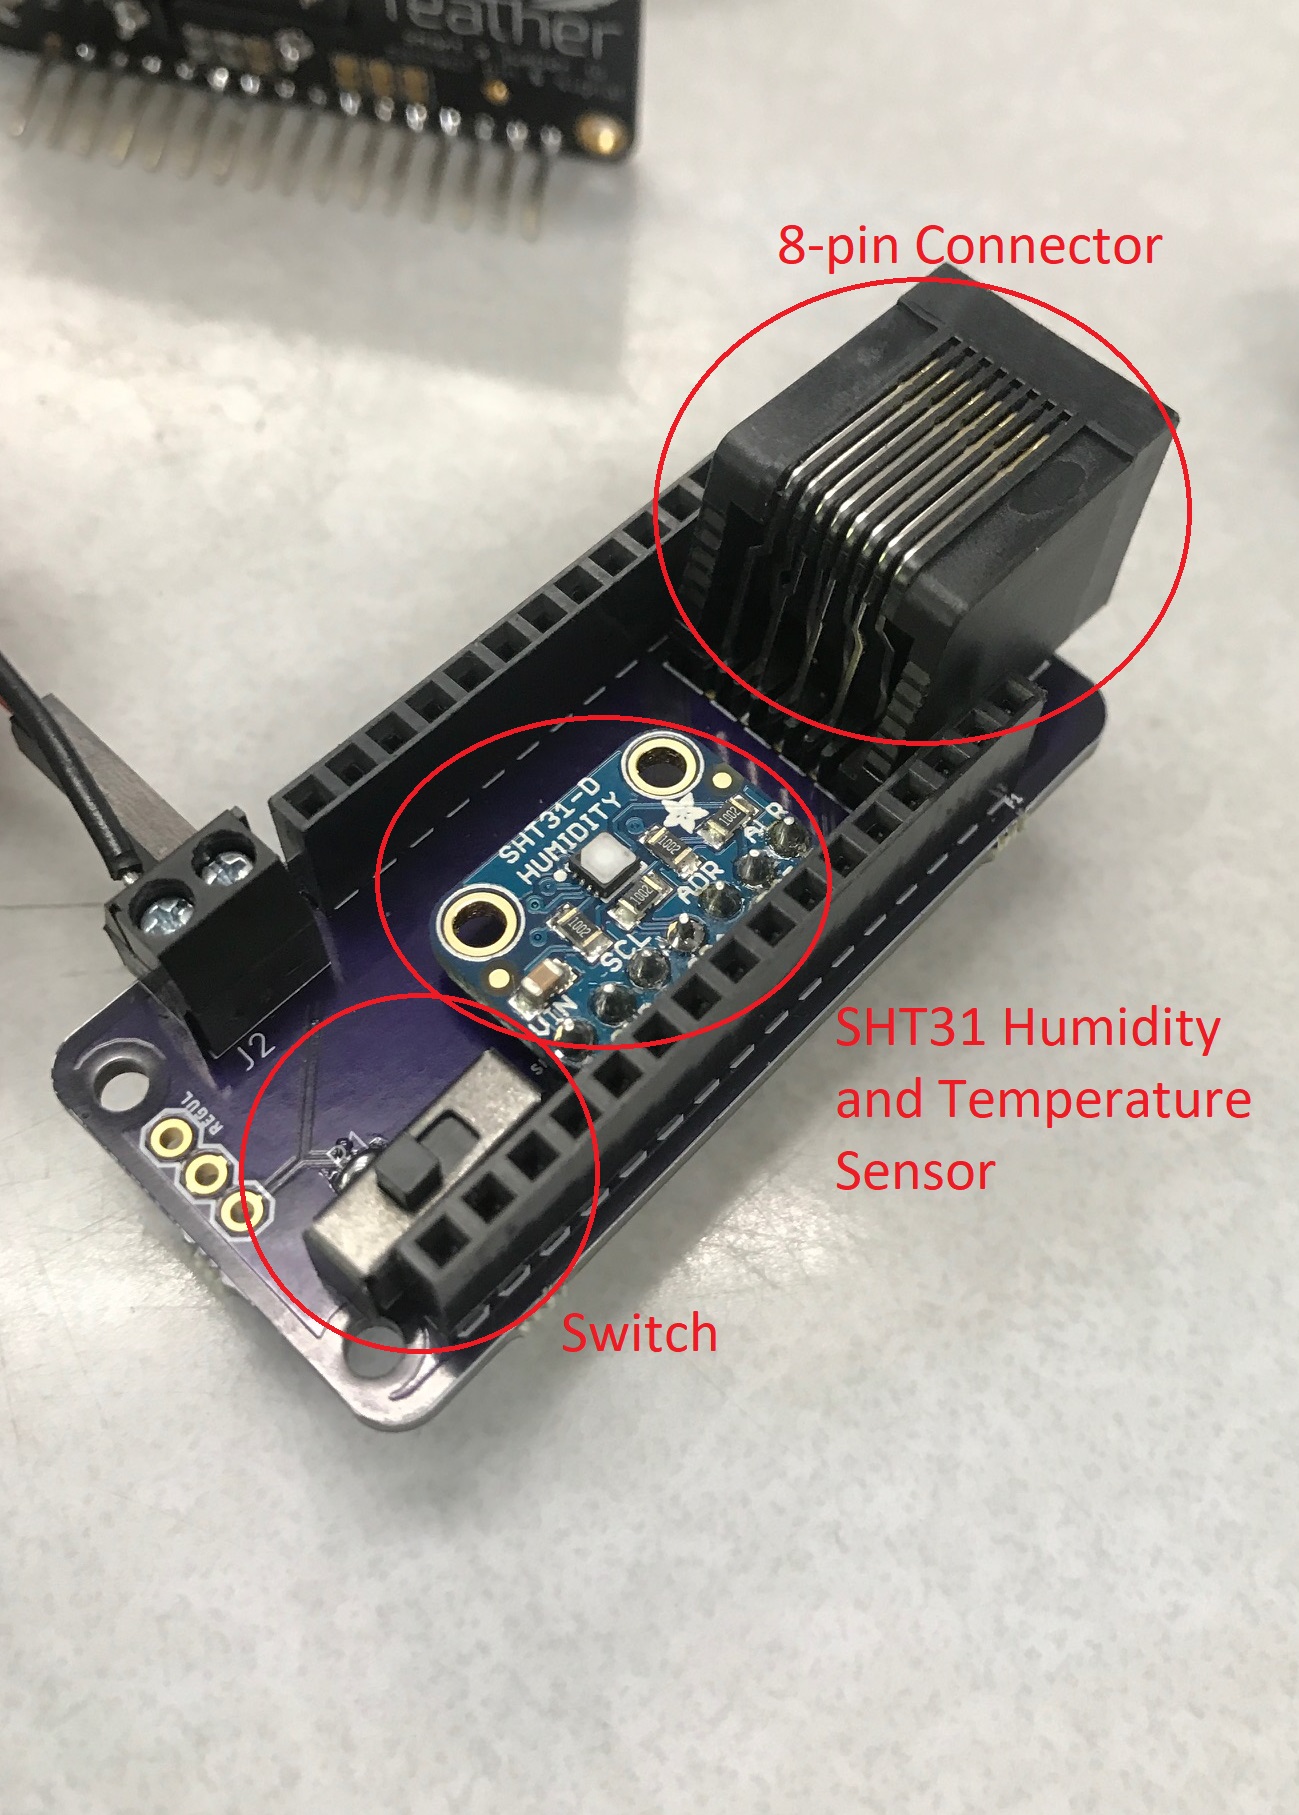
Because our probe was designed with an Ethernet connection, we created a PCB with an eight pin connector that sat directly on top of our Adafruit Feather M0 with Lora capabilities. Instead of using an NPN mosfet similar to the one used in the Orchid Test, a voltage regulator kept the voltage across the heater at a steady 3.3 V. These device was fully integrated with the LOOM interface for easy setup and implementation, as laid out in our LOOM implementation guide. The electronics were run with two batteries: 12 V, 2 AH to power the heater in pulses, and a 3.7 V, 2.5 AH battery to power the M0.
Similar to the Orchid Test, analog values were recorded by the board’s dedicated analog in pins. As per default, these readings were 10-bit although the M0 chip has the capability to do 12-bit ADC (detailed in this link), therein increasing the theoretical precision four-fold.These raw values were logged onto an SD card.
The waterproof enclosure was built to contain the fully constructed circuit and each of the batteries. Even though the tree was too far away from the lab to successfully transmit and received LORA data, there is space for an antenna and LORA can be set up using the LOOM interface if desired. The waterproof Ethernet connector is where the probe can connect to the circuitry, ensuring a secure connection. A hot glue gun was used to add an extra waterproof seal.
Energy Saving: The Power Problem
Our design uses heat pulses in order to save energy. Given the current models and code for both the TDM and HRM sapflux measuring methods, we conducted a current draw test with the batteries we had on hand to see if our designs will be able to run continuously in the field for 2 weeks as requested.
TDM Probe
Current Draw: 20.88 to 20.91 mA while on, 0.13 mA while off (not negligible)
TDM heater Pulse: 4 minute pulse every 30 minutes, aka 8 minutes an hour, 192 minutes per day. This is 3.2 hours.
The TDM probe uses: 67 mAh per day(Heater on) + 2.7mAh per day(Heater off) ~= 70mAh per day. The TDM heater probe can be on for 28.5 days with a 2,000 mAH battery.
TDM base
Assume we measure SHT31D + probe temperatures + soil moisture
M0 Current draw: 25 mA in Idle, and +130mA when measuring and transmitting data. (25mA * 24h per day) + (130mA * 48sec per day) = 600 mAh(idle) + 1.73mAh(Transmit data) = 601.73 mAh per day. The M0 can run for 16.6 days when we use a 3.7V 10,000mAh battery.
HRMProbe
Current Draw: 225 to 237 mA
HRM Heater pulse: 2.5 sec on and 2.5 sec off. It works on 2 minutes every 30 min, aka 2 minutes an hour, 48 minutes(0.8 hours) per day. 180 mAh to 190 mAh per day. The HRM heater can run for 10.5 days when we use a 12V 2,000mAh battery. For 2 weeks test, we need higher capacity of battery.
HRM base
M0 Current draw: 25 mA in Idle, +130mA when measuring and transmitting data, and 156 mA when relay switch is on.
Relay switch is on for 2.5sec and off for 2.5 sec. It works on 2 minutes every 30 min, aka 2 minutes an hour, 48 minutes(0.8 hours) per day. (156mA *0.8h per day) + (25mA *23.2h per day) + (130mA * 48sec per day) = 124.8mAh(Relay on) + 580mAh(Relay off and idle) + 1.73mAh(Transmit data) = 706.53mAh per day. The M0 can run for 14 days when we use a 3.7V 10,000mAh battery.
TDM Test: Return of the Data
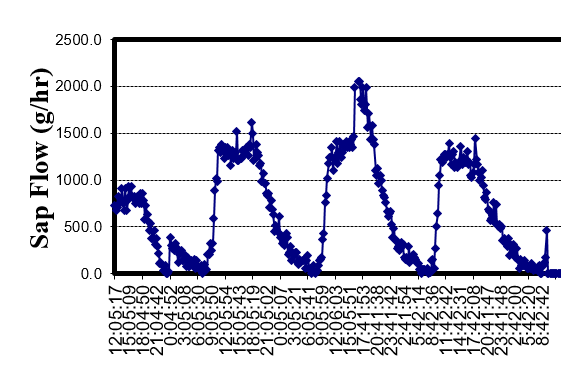
After a couple of failed test runs, we were finally able to graph data using our TDM probe. We used the Dynamax data calculation example from their website and created the following graph for the sap flow in a wild Cherry tree for about
The trend of this data is consistent and promising!
We have a two-week long test of our TDM probes coming up in the following weeks, where we will be able to show more conclusively if our probes are providing accurate sap flow data.
HRM Test: The Phantom Data
Our first HRM test was a success, however we are still working on a method to calculate sap flow from the data we have collected. Below is the data we collected in the wild cherry tree. We are continuing to work with the Heat Ratio equation to plot Sap Flow in grams per hour with respect to time.
This plot shows all of the data points we measure on our HRM test. The y-axis is degrees Celsius. Because we collected data every 15 minutes during this test, the x-axis is time, and represents X*(15 minutes)
Here we have the difference between the temperatures of the two probes you see in the first graph. The y-axis is still in degrees Celsius and the x-axis shows time of day.
While we do not have calculations for Sap Flow yet, we know that a lower difference means that there is an increase in sap movement up the trunk of the tree, and a higher difference means less. We can infer this from the Heat Ratio Equation. The HRM difference data shows that the lowest difference occurs between ~11:30am and 7:00pm. This is consistent with our TDM data, shown in the section above. While our TDM measuring method is more complete and can render Sap Flow calculations, we are confident that our HRM measuring method can be used to produce accurate readings as well.
Our TDM probe prototype in the wild cherry tree! (8/03/2018)
Our HRM probe prototype in the wild cherry tree! (8/16/2018)
What’s next for the Sap Flow Team?
Now that we have gathered promising data from a tree, we will be deploying both our TDM and HRM prototypes in an orchard, where we will attempt to gather data for two weeks continuously. More on this to come!
This post will provide step by step instructions on how to build your own thermal dissipation sap flow sensor using everything provided on this blog and the following steps: ordering / creating parts, soldering the probes, applying the thermal epoxy, wiring to an Ethernet cable, implementing the circuit, programming the microcontroller, and installing into the tree.
Index
Order and Create Parts
Solder Probes
Apply Thermal Epoxy
Wiring the Probe
Creating the Circuit
Programming the Microcontroller
Designing Enclosure
Install in a Tree
Step 0: Required Tools
Before jumping into the project, it’s important to mention that this project requires a few specialty devices to make.
Below are two different bills of materials (BOM) that contain all that is required to build one of these sensors. The files for the pcb board can be found in this zip file. Base_v1 is the version we used in the design listed here. Base_v2 includes an updated switch to easily switch between TDM and HRM implementations (coming soon?). To edit, you will need to download Eagle by Autodesk as well as a few part libraries including Brett’s personal library of Eagle PCB parts. The total cost of a sensor is estimated to be just under $170! The comprehensive list of all parts used to make either an HRM or TDM probe run in working order are included in the Bill of Materials below.
Additionally, an Adafruit Feather M0 LoRa is needed with a 3.7 volt battery (suggested 4AH) for the sake of this build guide ($34.95 + $19.99 resp.). It also requires our custom build PCBS, the probes (we recommend ordering 2 more probes than needed) and our 8-pin routing board that connects directly to the Feather M0.
The Feather M0 can be substituted for any micro controller with analog-in pins with some changes to the code to accommodate these new pins (mentioned briefly in Step 4) and if a different voltage batter is used, you should take a look at this blog post and change the heater resistor value. We used the Adafruit because their boards work well with each other. In addition, the Feather M0 with LoRa can transmit data for remote data gathering and troubleshooting. See more on that here.
When ordering the electronic parts I would highly suggest you buy spare parts, especially any 0603 resistors (baked into the single sensor BOM).
Step 2: Solder Probes
Once you’ve received all the parts, it’s time to break out the soldering iron, tweezers, and reading glasses (optional) to tackle the most difficult step of this build: soldering on US0603 sized resistors. Soldering these on is a major test of patience even for veteran electrical engineers, but not impossible for first-time solders. Here are a few tips and tricks that should help: article from build-electronic-circuits.com, video from Engenuics Technologies.
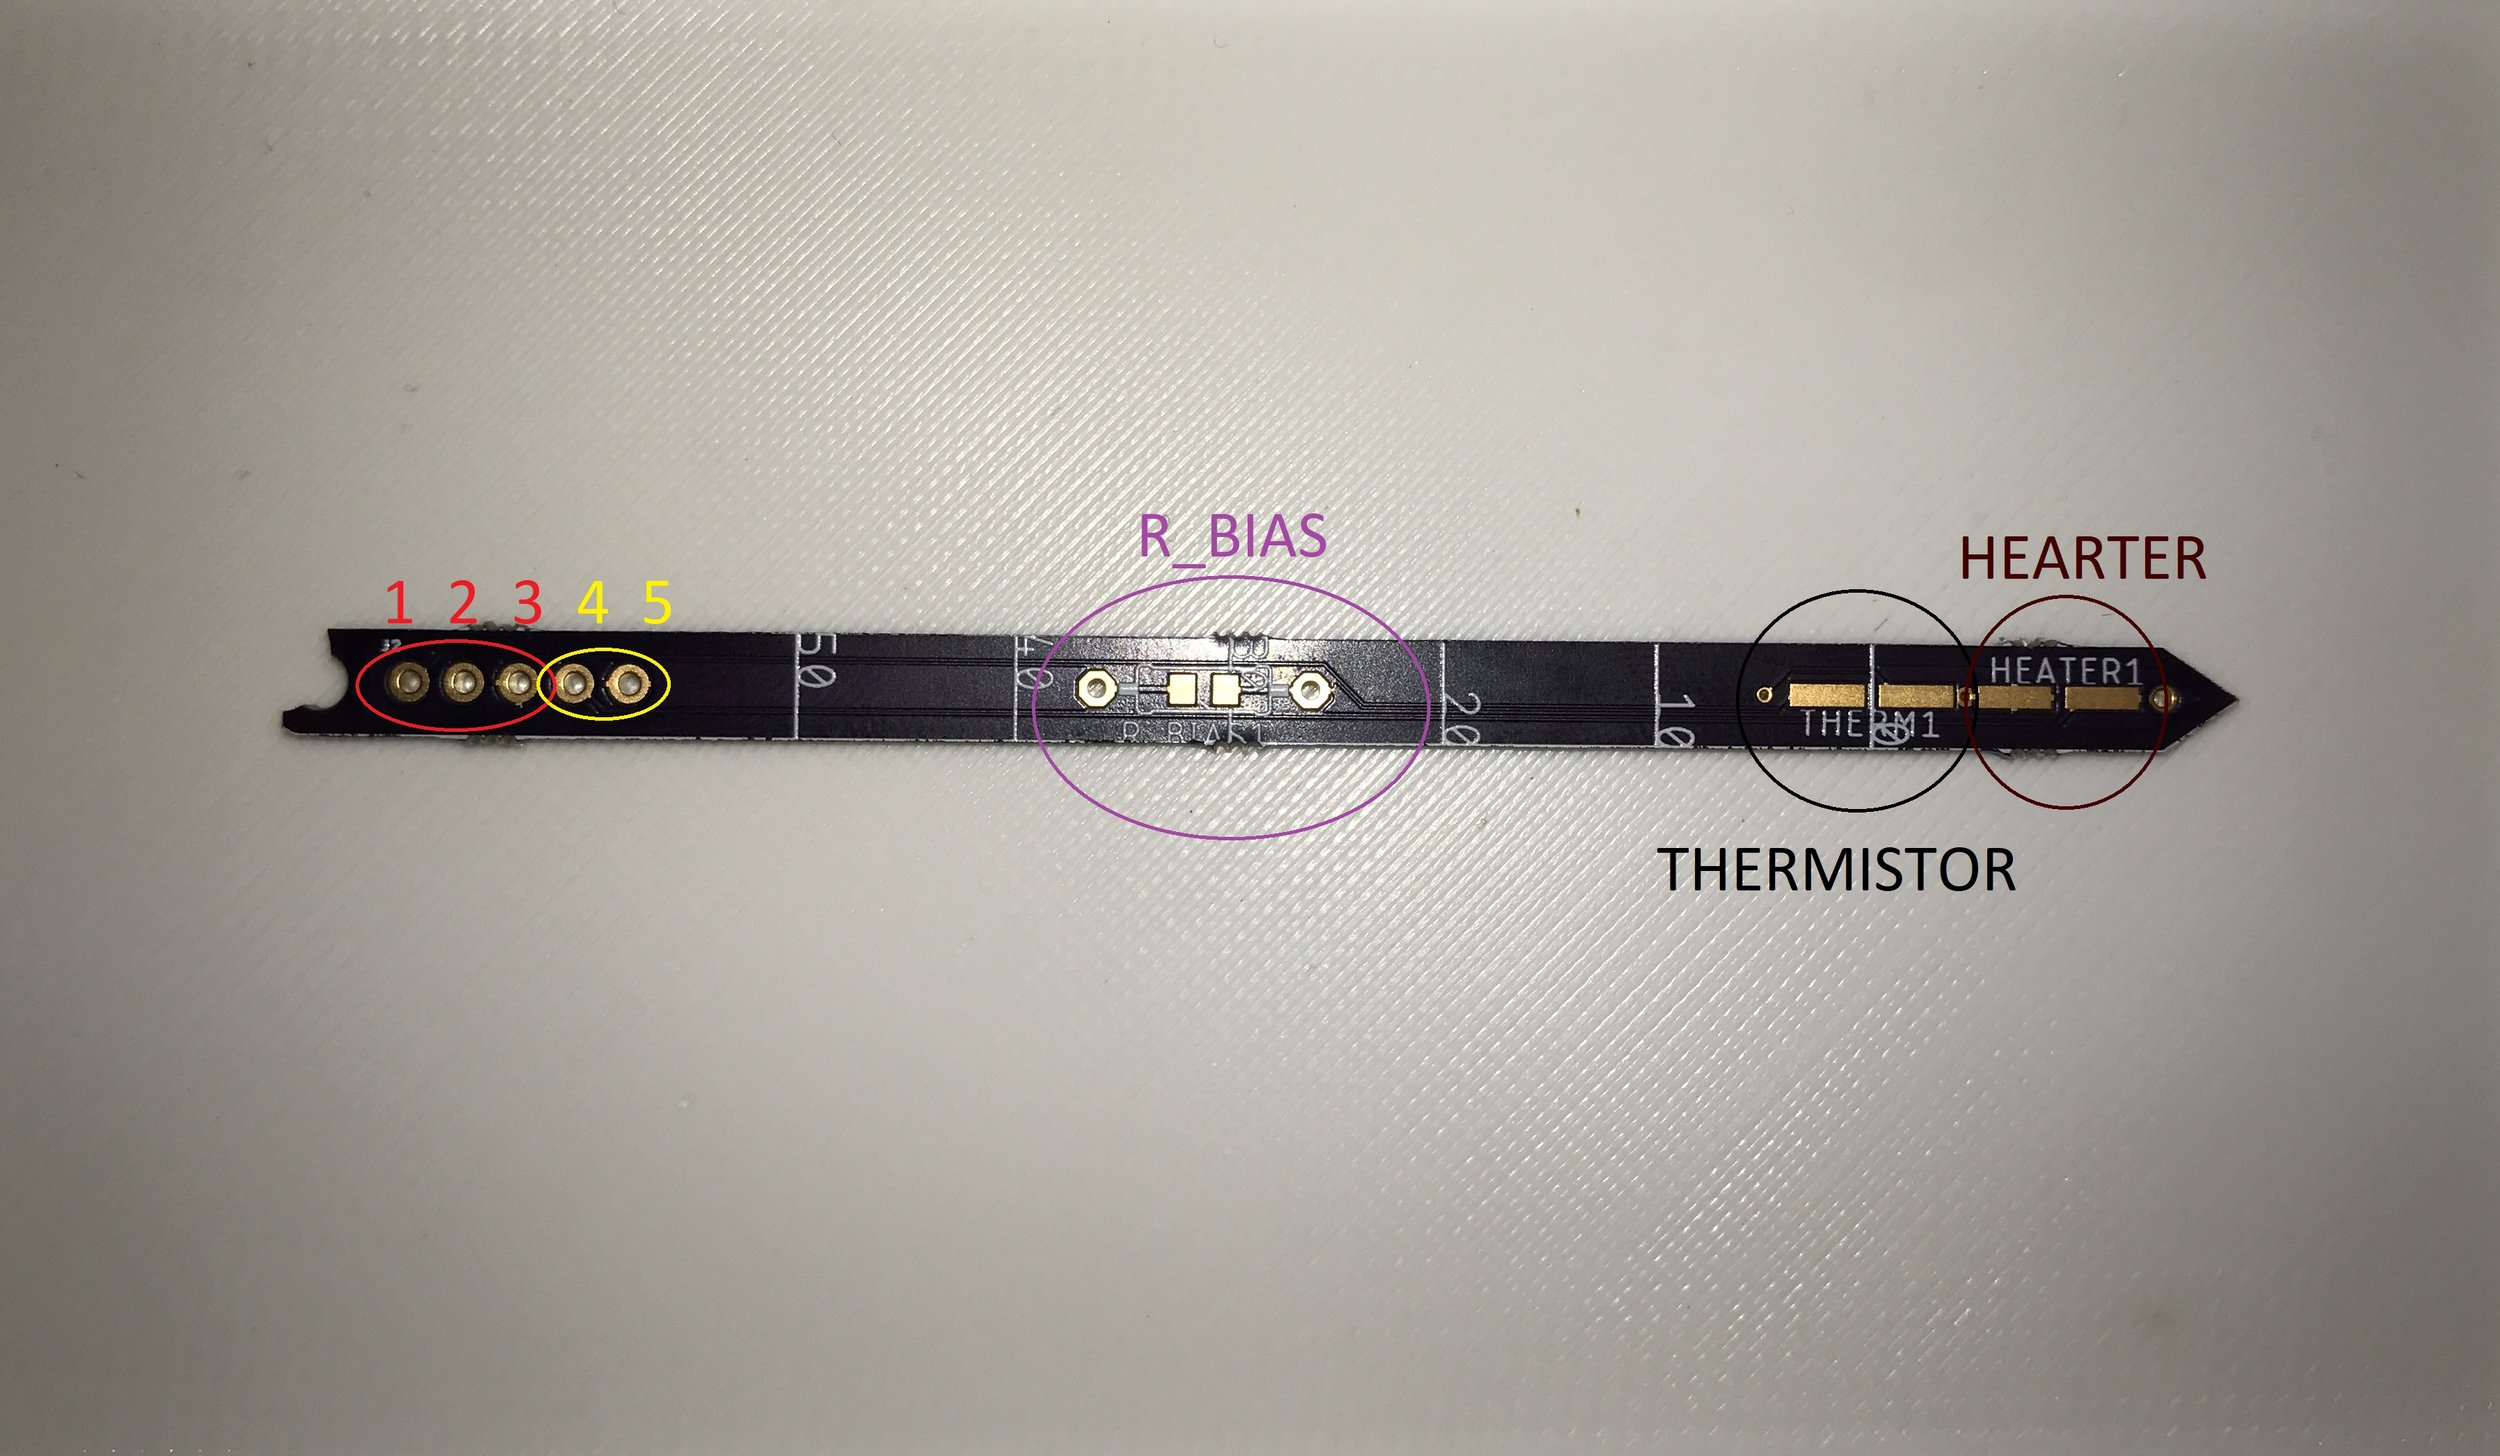
For this design, two thermistors need to be soldered into their nodes on two of the probes, and a heater resistor on one of the probes. The location for these on the probe are illustrated in the picture below. (NOTE: Keep the thermistors and heaters separate so as not to confuse them)
After the tiny resistors are in place on the end of the probe, its time to move down and solder on connectors on all the probes. For a TDM heater probe, solder pins into all five jumper holes as well as a thermistor and a heater. For a HRM heater probe, solder pins into jumper holes 4 & 5 and solder in a heater. For a thermistor probe (TDM or HRM), solder in the 100k through-hole resistor into its spot, solder three pins in to the probe’s bottom three holes, and solder in a thermistor. Use a multimeter to make sure all solder points are good and that the components are not shorted. The temperature probe should have a resistance of ~100k (this will vary based on temperature). The heater probe should have a resistance of 50 ohms (or whatever heater ohm is chosen).
Step 3: Apply Thermal Epoxy
The next step involves the thermal epoxy. This is used in order to evenly spread out the effect of the heat pulse and to get better contact when inserted into a tree bore-hole. In the past, this was done using a 3D-printed mold, but we discovered applying the mold by hand is just as effective.
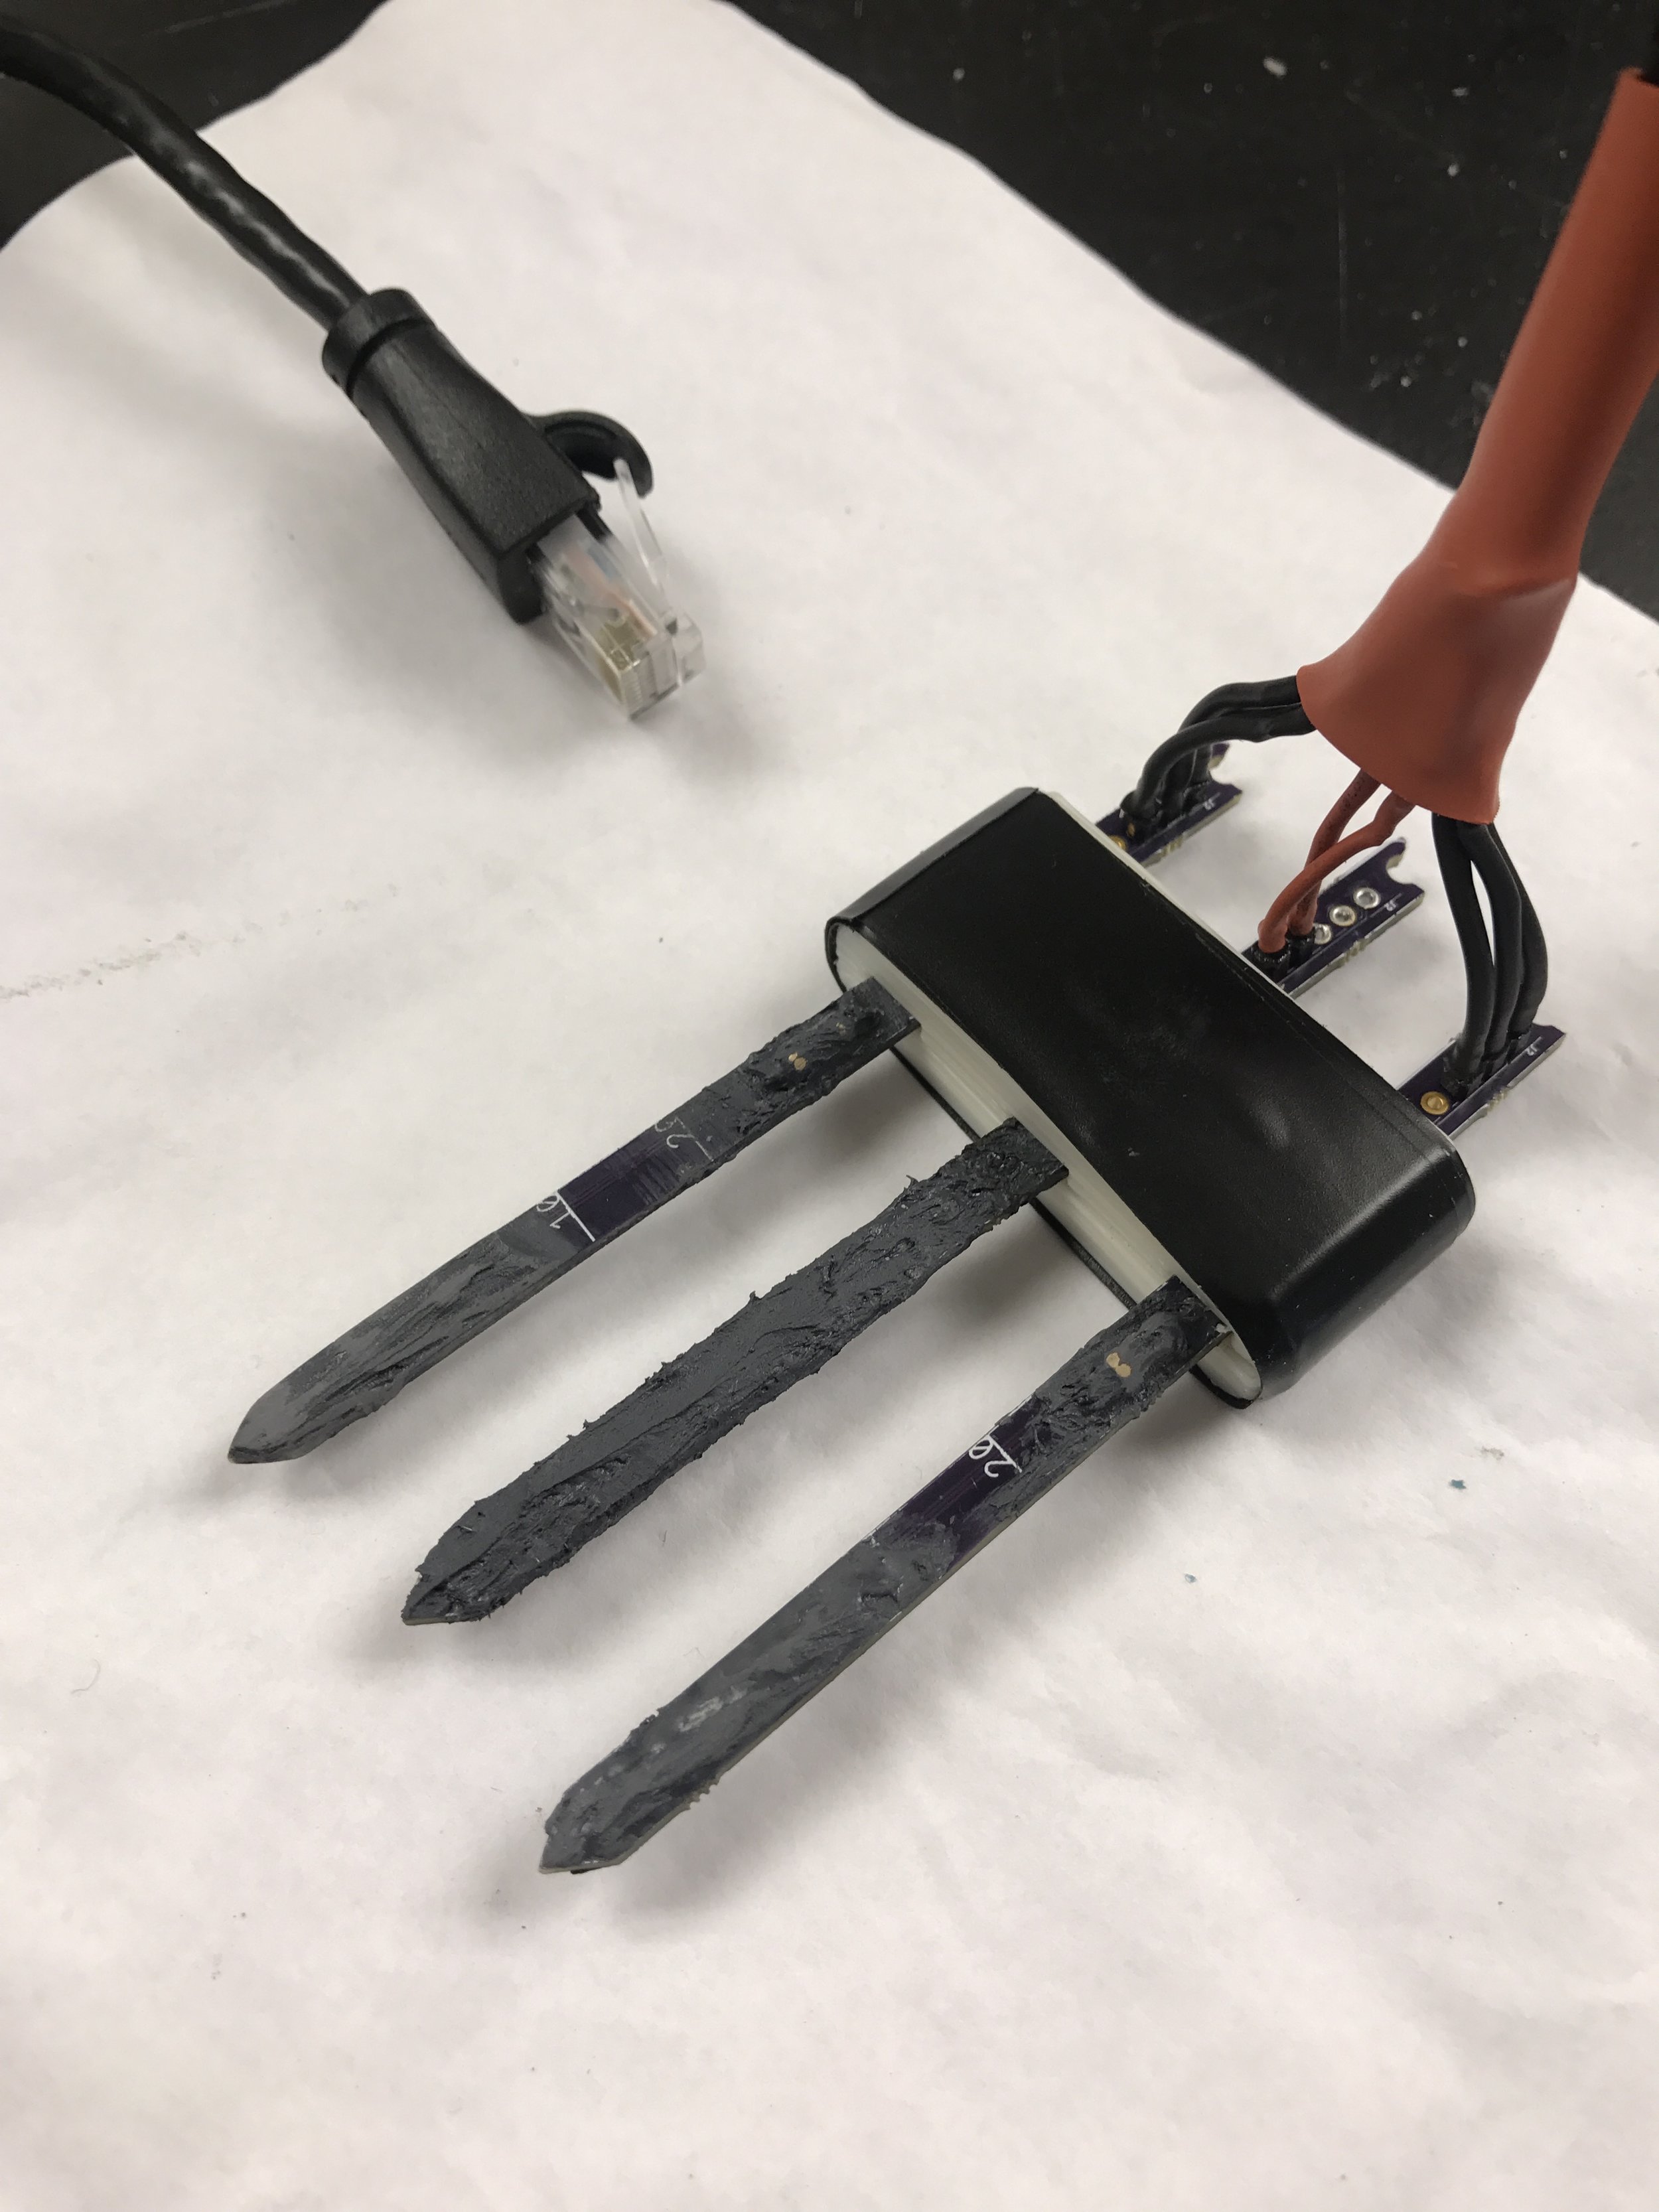
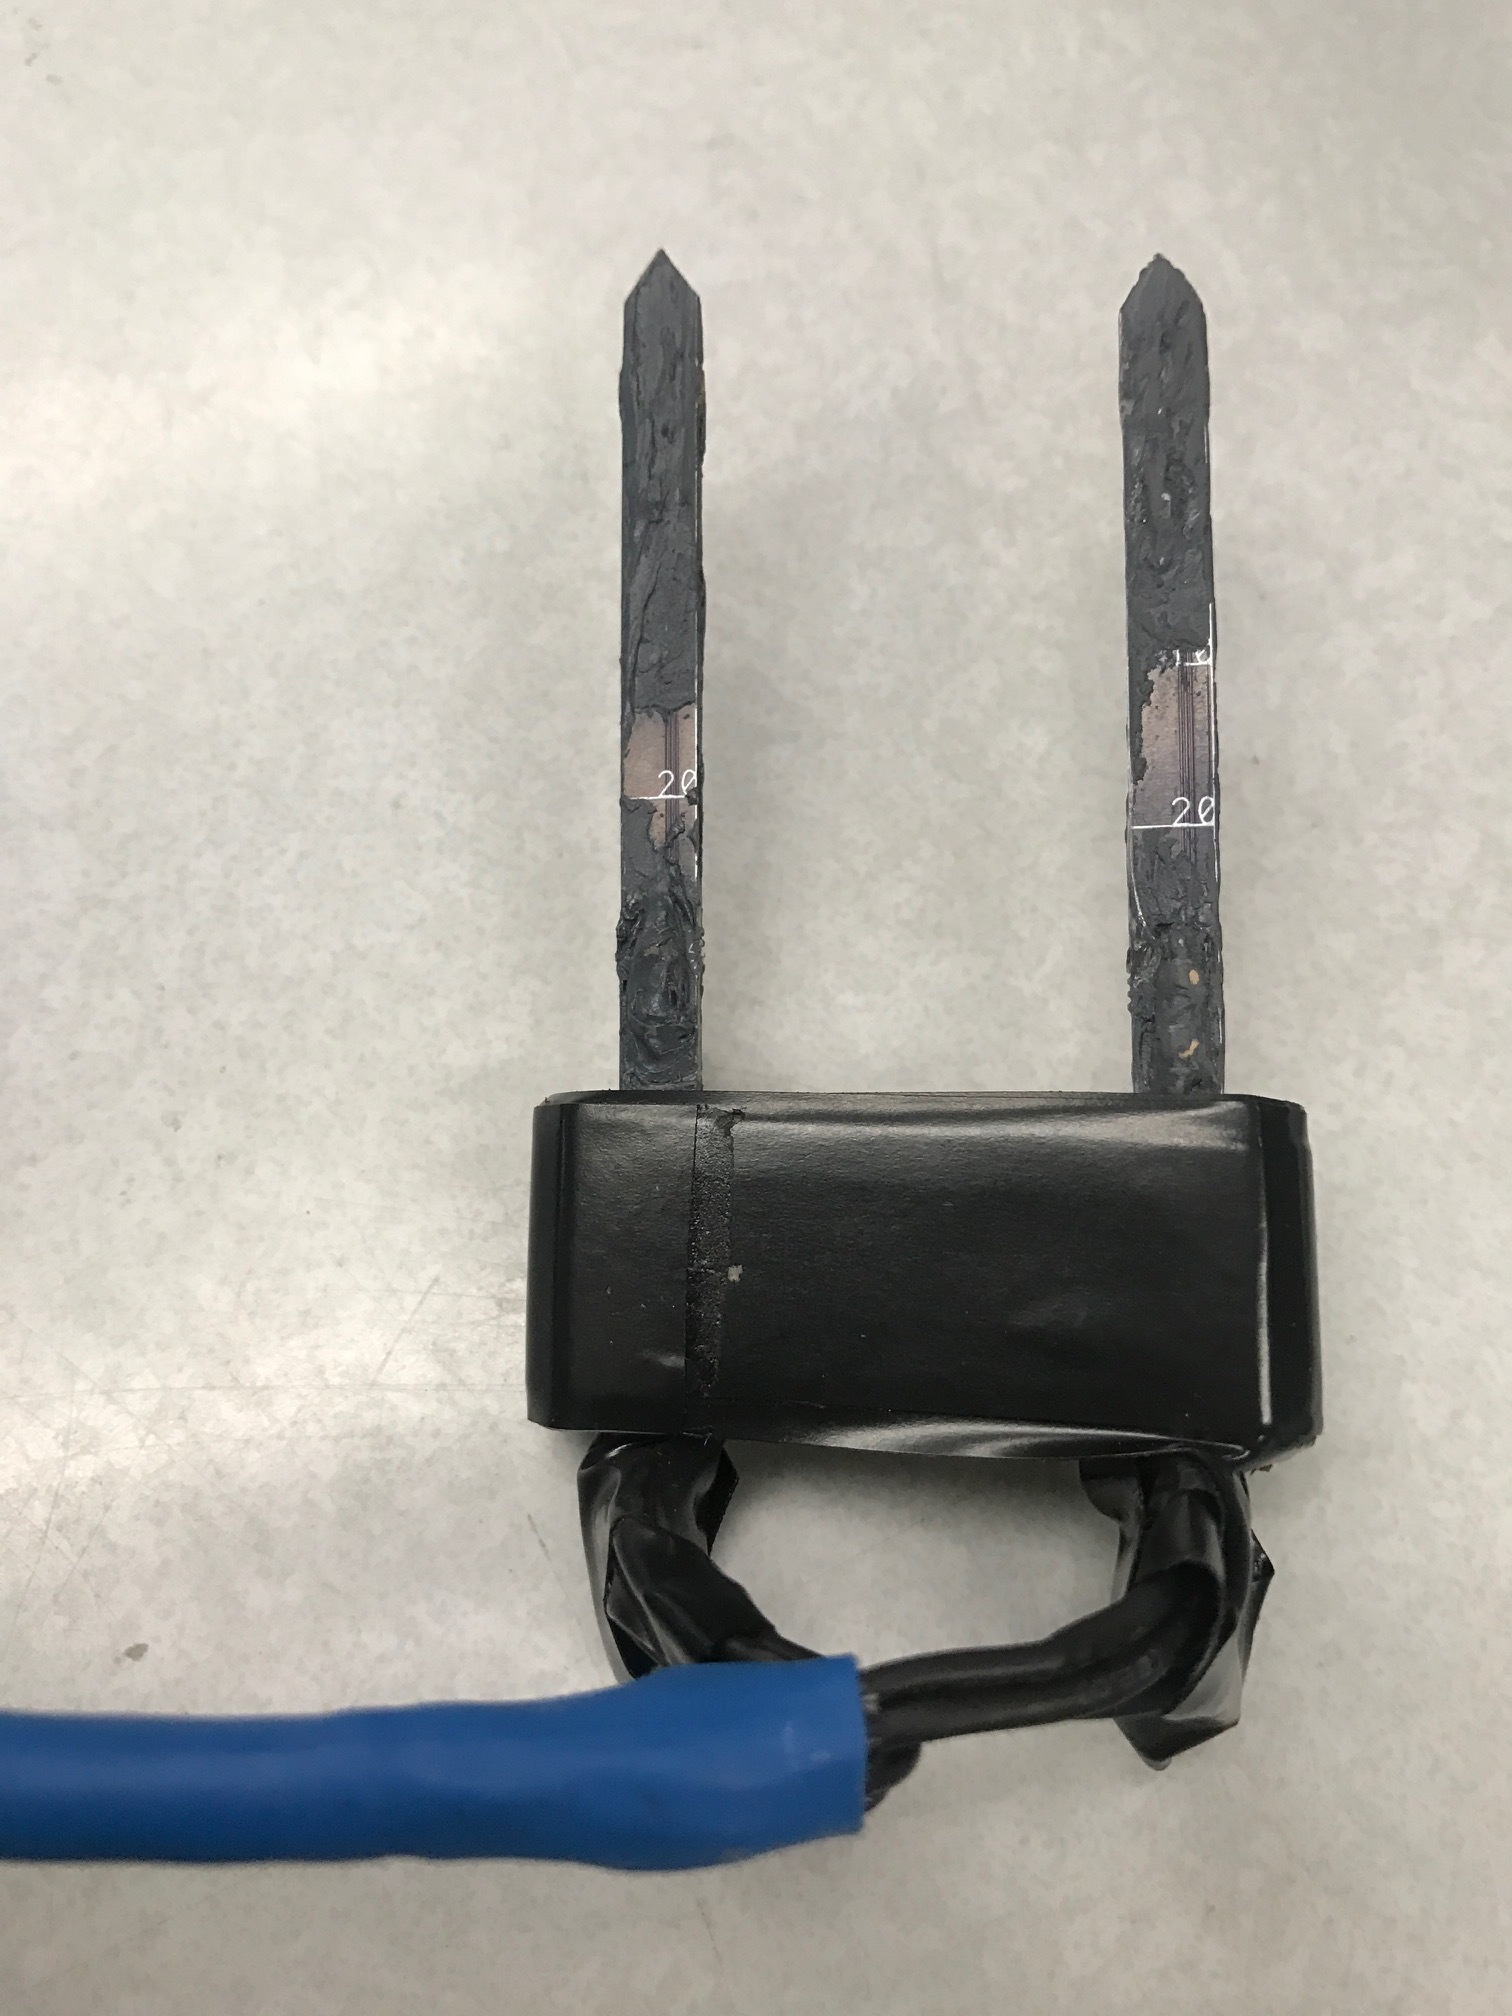
The epoxy in the BOM is a two part epoxy with a curing time of 45 minutes. To use, squeeze out equal parts from the A and B syringes and mix this well with a mixing stick. Use the mixing stick to apply a thin layer of epoxy, gently wiping away any excess epoxy with a paper towel. Wait at LEAST 45 minutes to dry, suggested overnight. Make sure that disposable gloves are used during this step. t’s also suggested that mold release spray be used on the inside of the mold to help the epoxy from sticking. Once the epoxy has dried, lightly sand the probes to remove rough edges and create a smooth surface. Here is a picture of our HRM Ethernet probe for a visual of what the finished product should look like.
The two outside probes (thermistor probes) have been sanded. As you can see, there is a smoother texture than the middle probe (HRM coil heater probe), which has not yet been sanded.
As we make more probes, we will include more pictures to show the application process in greater detail.
Step 4: Wiring the Probe
The probes should be wired to the board as shown to work with the current code.
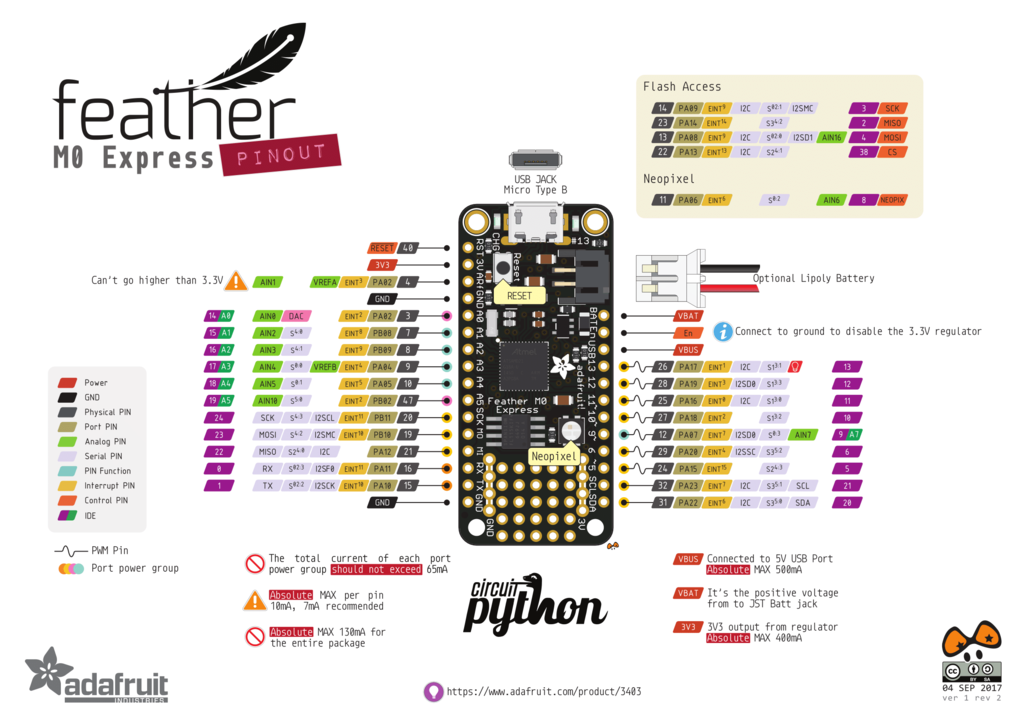
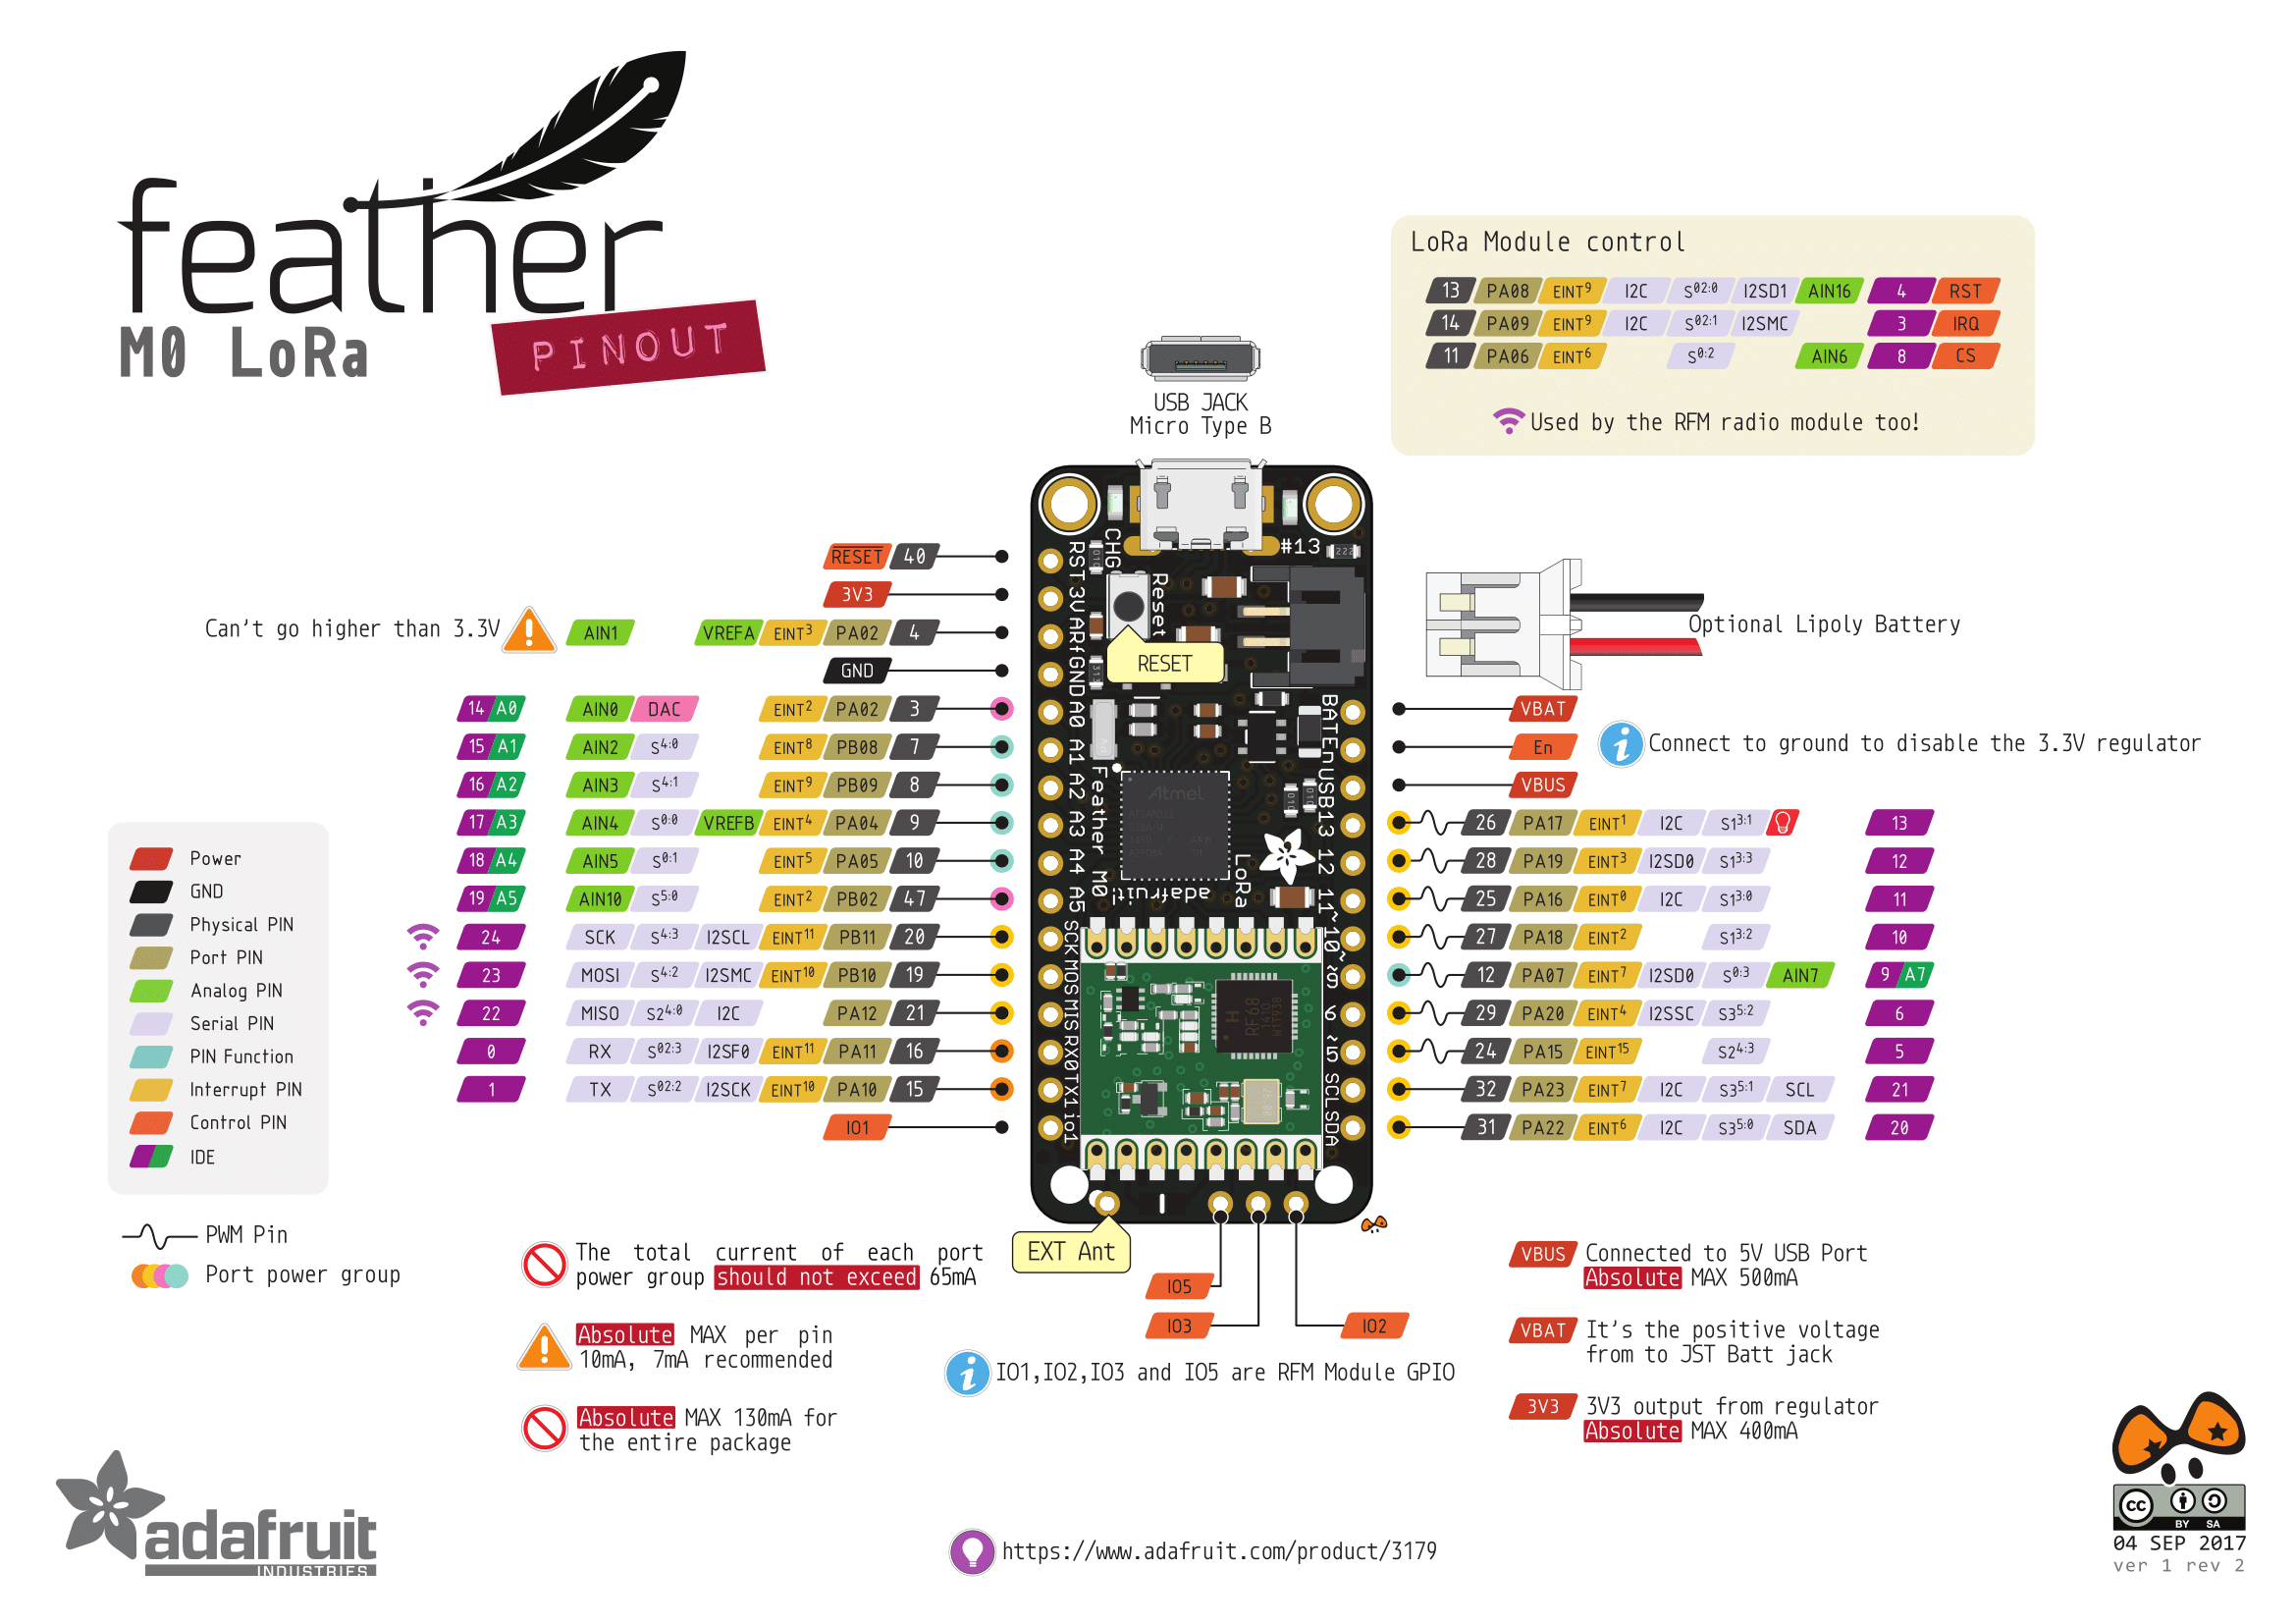
The heater probes could be attached to the 3.3V output pin (identified by “3V”) in order to further stabilize the power delivered as battery voltage decreases as it dies but the 3.3V should always be the same. However, this would reduce the energy efficiency of the system as the 3.3V output pin goes through the M0’s internal voltage regulator which burns off the excess voltage as heat. Also, the 3.3V supply has a max supply of 500mA which is near the current draw of a single heater probe. The following is a pinout of the Feather M0 board for a connection reference.
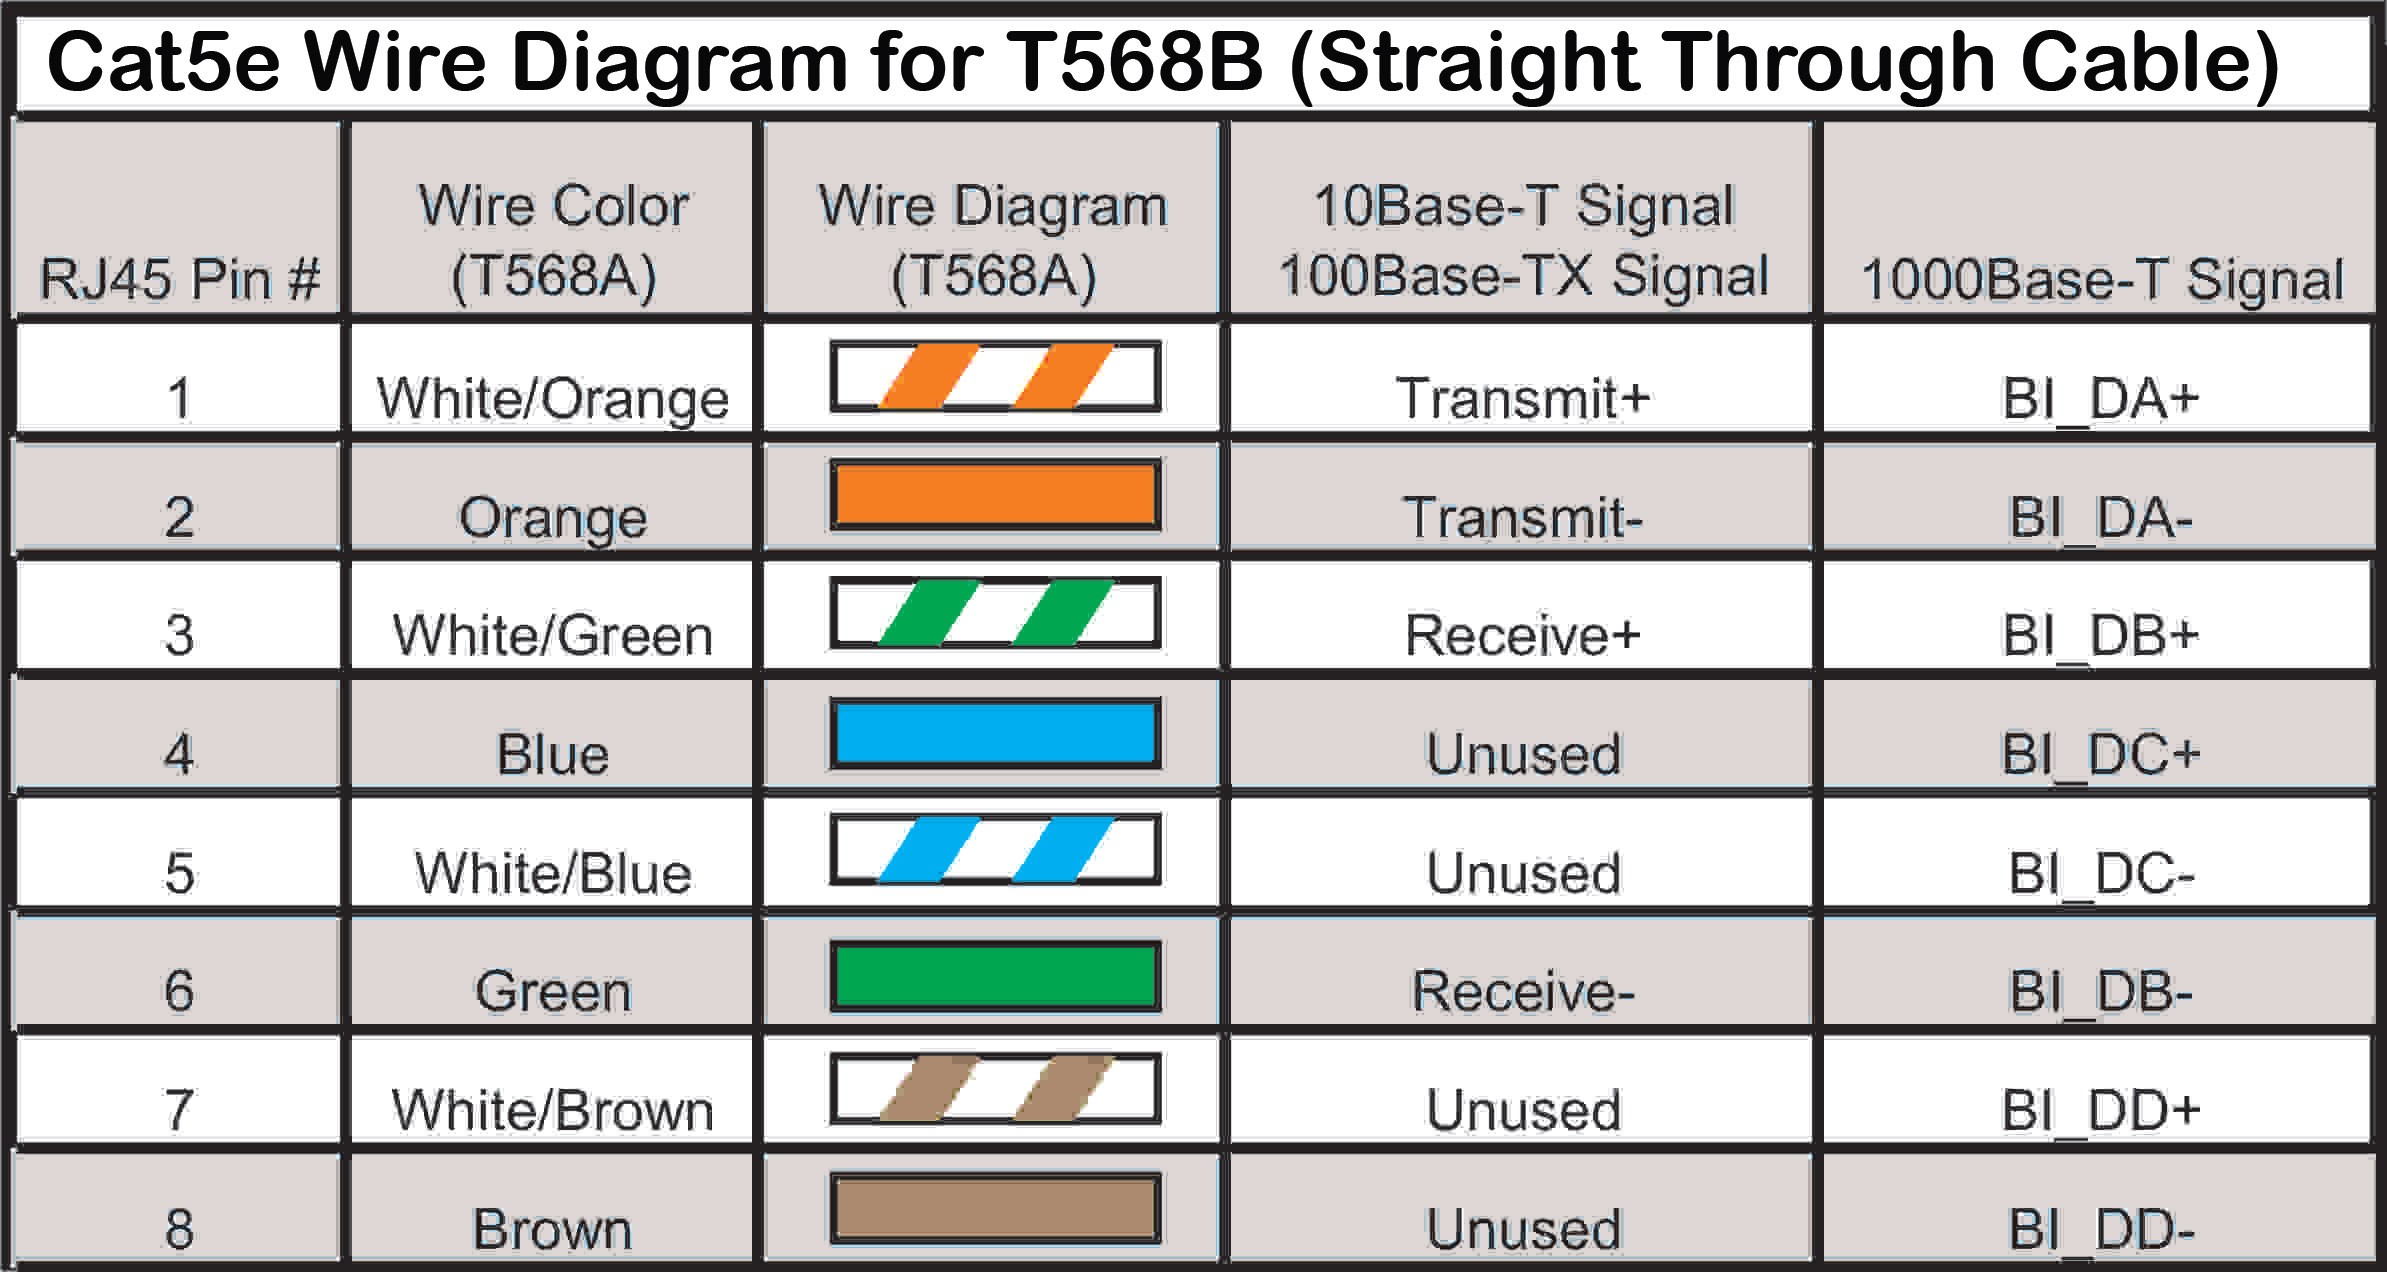
We used an ethernet cable to connect the proper M0 pins to the probes as shown in the schematic. This was done by carefully routing our specially built PCB 8-Pin connector board (Base_v1 as listed above), specially designed to properly connect the probes with the color-coded guides listed below and the 8-pin connectors listed in the BOM. Cut off one end of the Ethernet cable to expose the 8 wires inside the protective inductor outside. Use the following schematics and Ethernet color chart to properly connect the probes so that they work as desired.
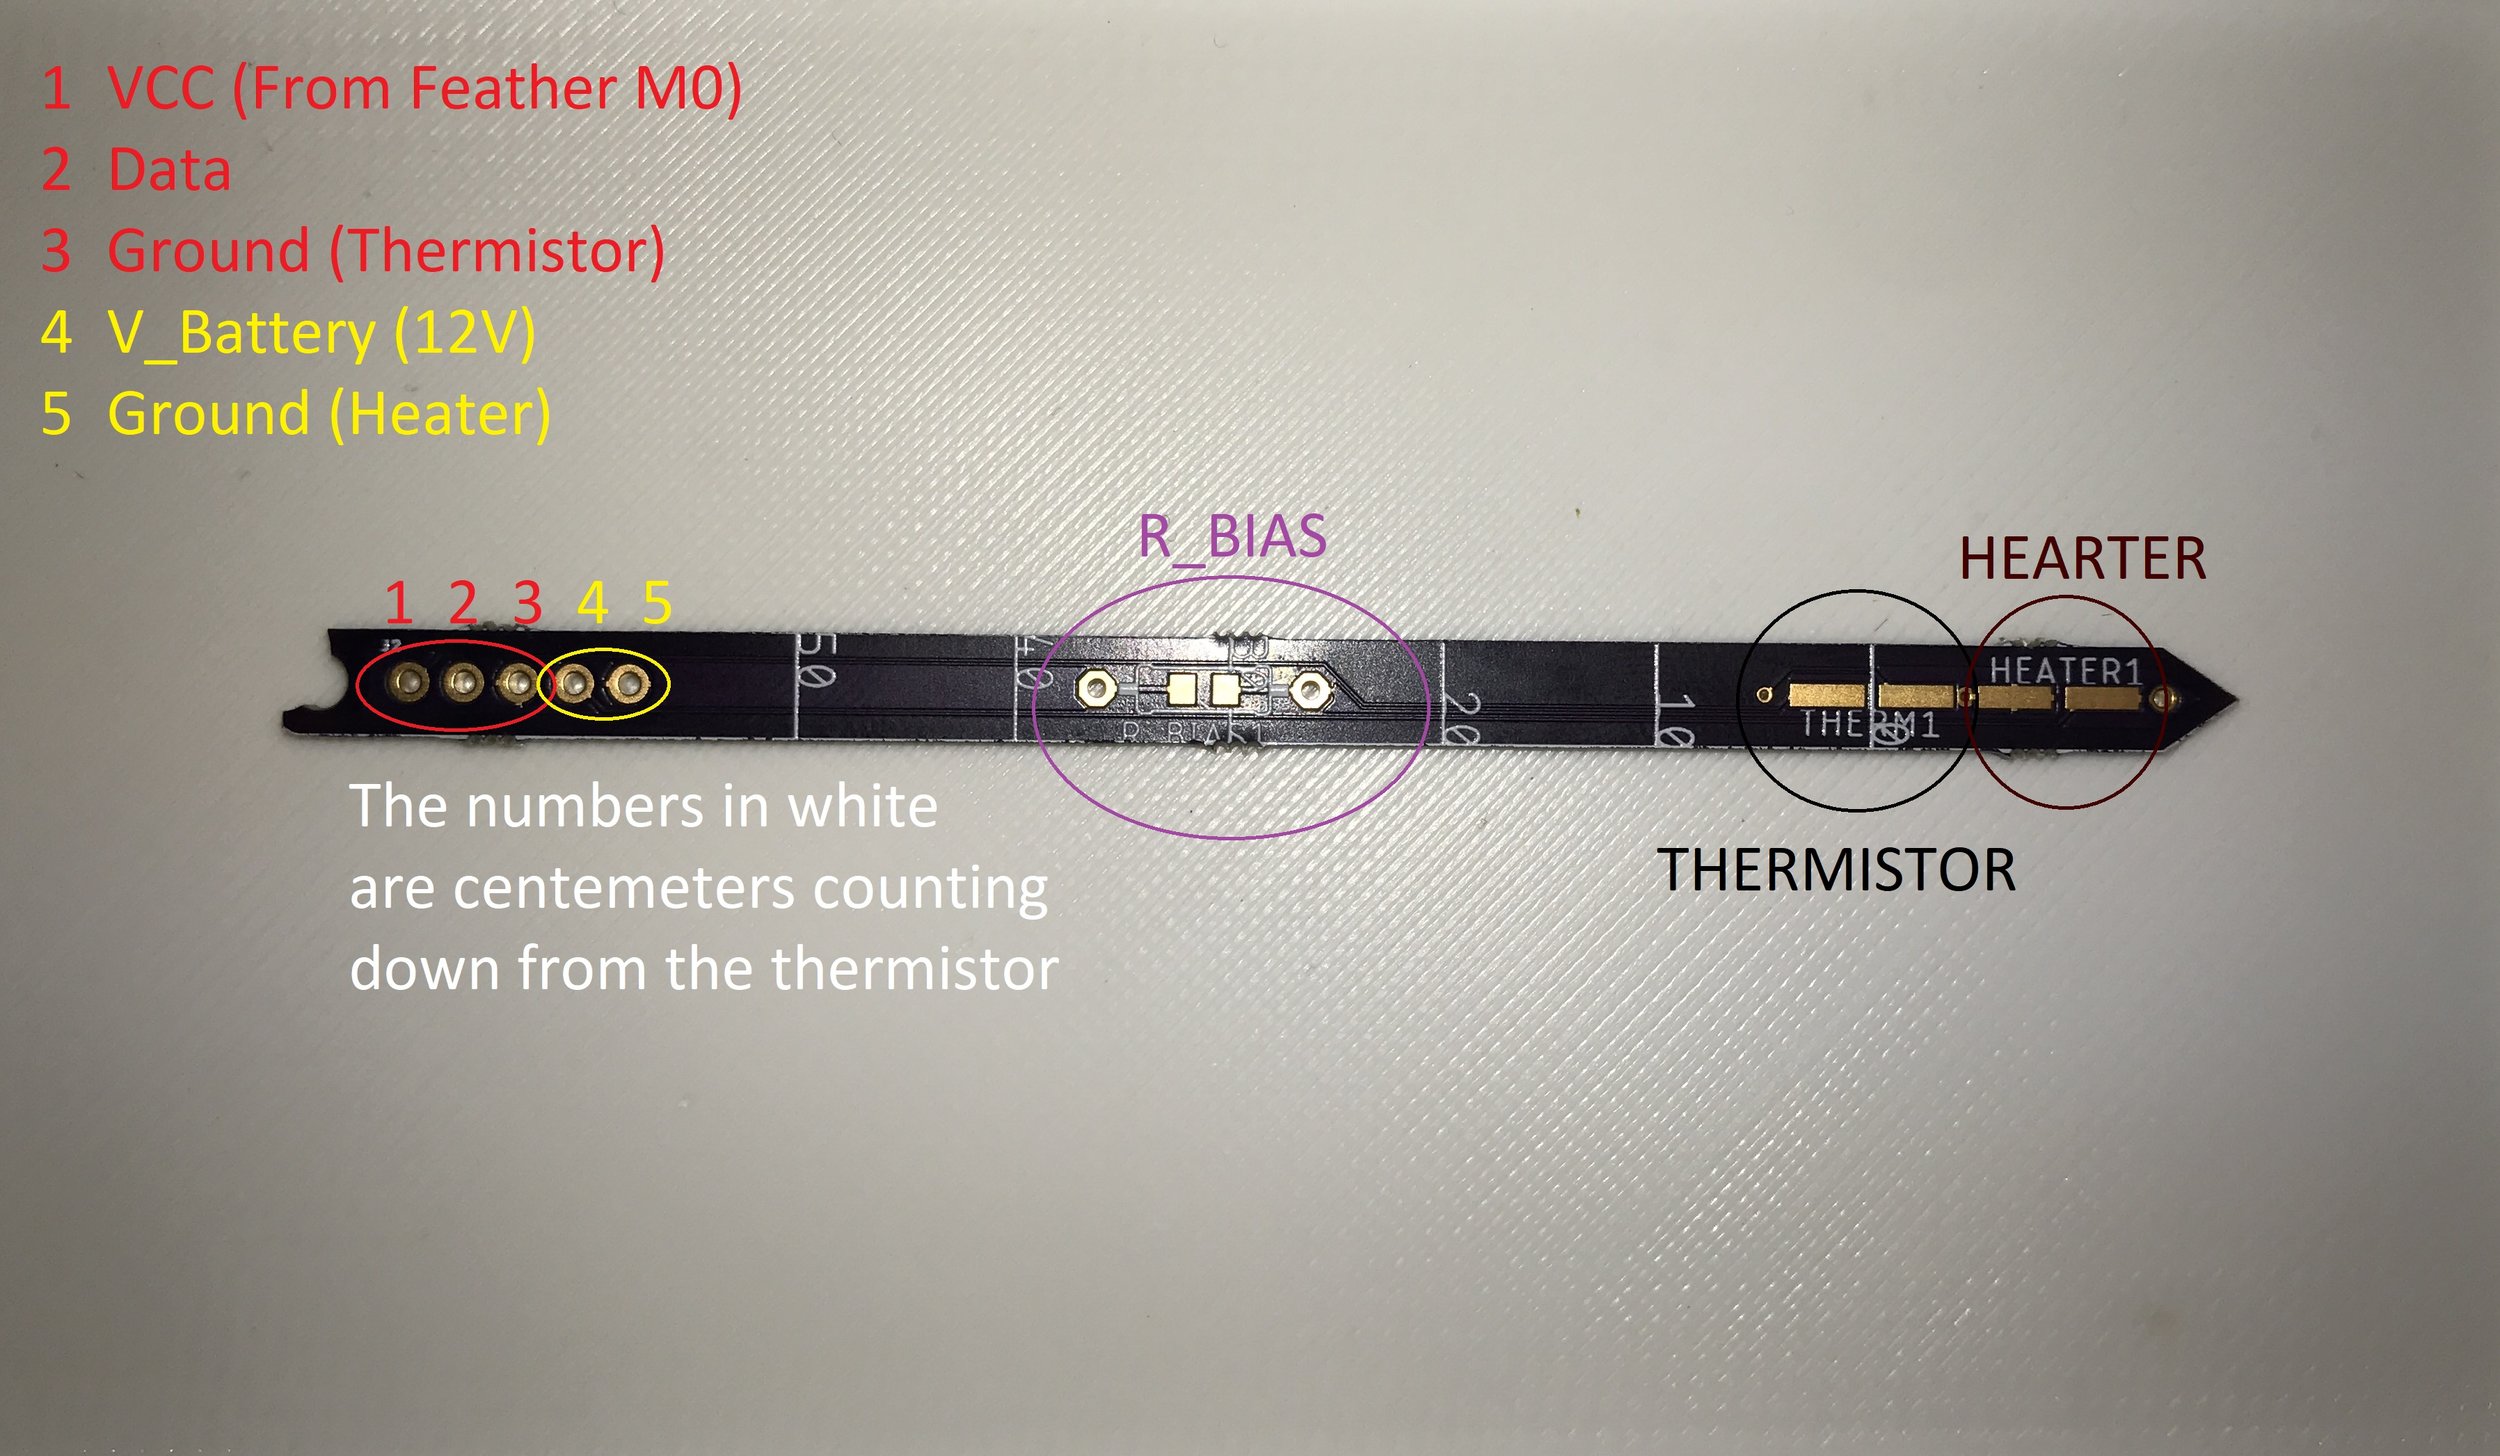
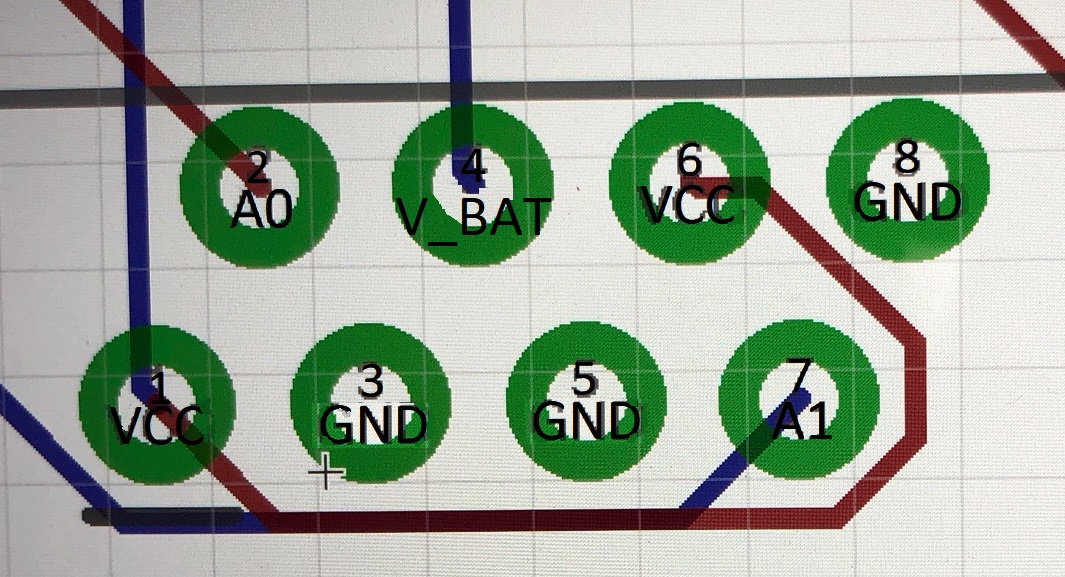
Insert probe guide from the PCB for which pin (on each probe) goes to which color of wire (with Ethernet color-coded cable pinout)
The RJ45 Pin # corresponds to the number and title on the 8-pin Guide picture when the RJ45 is soldered correctly into our PCB design. Here is a number guide for wiring a TDM and a HRM probe:
TDM
1 VCC – White & Orange – Pin 1 on the Heater Probe
2 A0 – Orange – Pin 2 on the Heater Probe
3 GND – White & Green – Pin 3 on the Heater Probe
4 V_BAT – Blue – Pin 4 on the Heater Probe
5 GND – White & Blue – Pin 5 on the Heater Probe
6 VCC – Green – Pin 1 on the Thermistor Probe
7 A1 – White & Brown – Pin 2 on the Thermistor Probe
8 GND – Brown – Pin 3 on the Thermistor Probe
HRM
1 VCC – White & Orange – Pin 1 on Thermistor Probe 1
2 A0 – Orange – Pin 2 on Thermistor Probe 1
3 GND – White & Green – Pin 3 on Thermistor Probe 1
4 V_BAT – Blue – Pin 4 on the Heater Probe
5 GND – Blue & White – Pin 5 on the Heater Probe
6 VCC – Green – Pin 1 on Thermistor Probe 2
7 A1 – White & Brown – Pin 2 on Thermistor Probe 2
8 GND – Brown – Pin 3 on Thermistor Probe 2
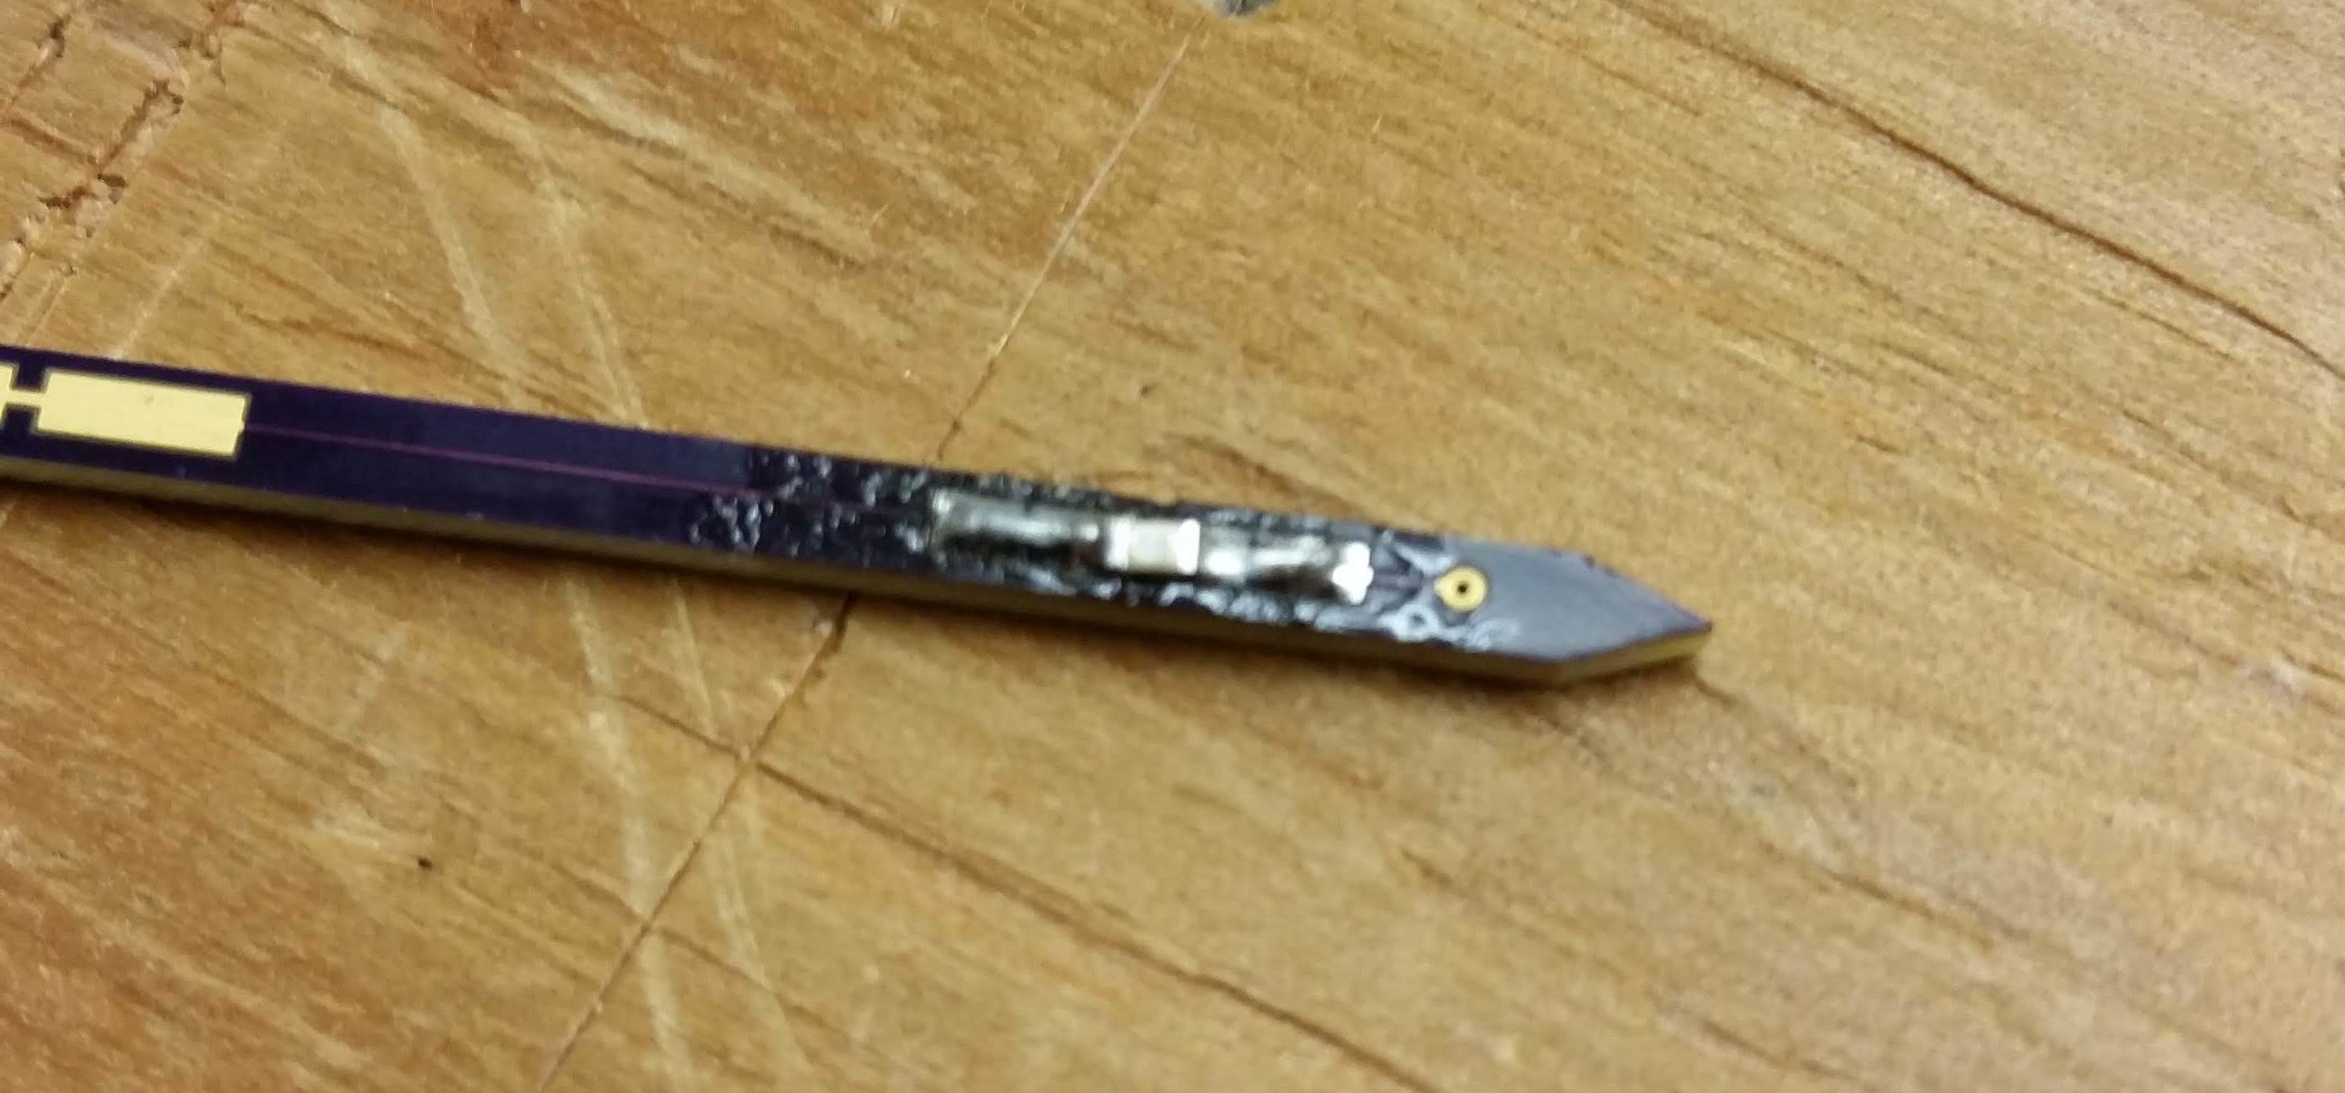
Here is a picture of our finished TDM probe. A picture of the finished HRM probe is included in thermal epoxy application section.
To use the probe guide, use this file (Upload coming soon) to 3D print a probe guide. Place the probes correctly (TDM: Heater on top, thermistor on bottom) (HRM: Heater in the middle, thermistors on top & bottom). We used tape to secure the lid on the probe guide, and we also recommend gluing each probe in place to properly secure them.
Step 5: Creating the Adafruit Board Circuit
The circuit for the sapflow probe is made with a variety of Feather boards from Adafruit, including Feather M0 with LoRa Radio, Power Relay FeatherWing, and Adalogger FeatherWing with SD add-on. Our custom PCB is also used, which has the voltage regulator used for the TDM method, the 8-pin connector, and tracing that allows to switch between the TDM and HRM methods (depending on which probe is ended up chosen). Currently, both models require a 3.3V battery that can power the Feather M0 board and a 12V battery that can power the heater. Below is a picture guide for how to set up the stack of boards, using a FeatherWing Tripler PCB board from Adafruit as a mount.
This is our custom PCB, which is linked above, without any parts on it yet. This is the best place to start!
Our fully assembled PCB. Note the type of headers used in these and subsequent pictures. This is crucial for proper assembly!
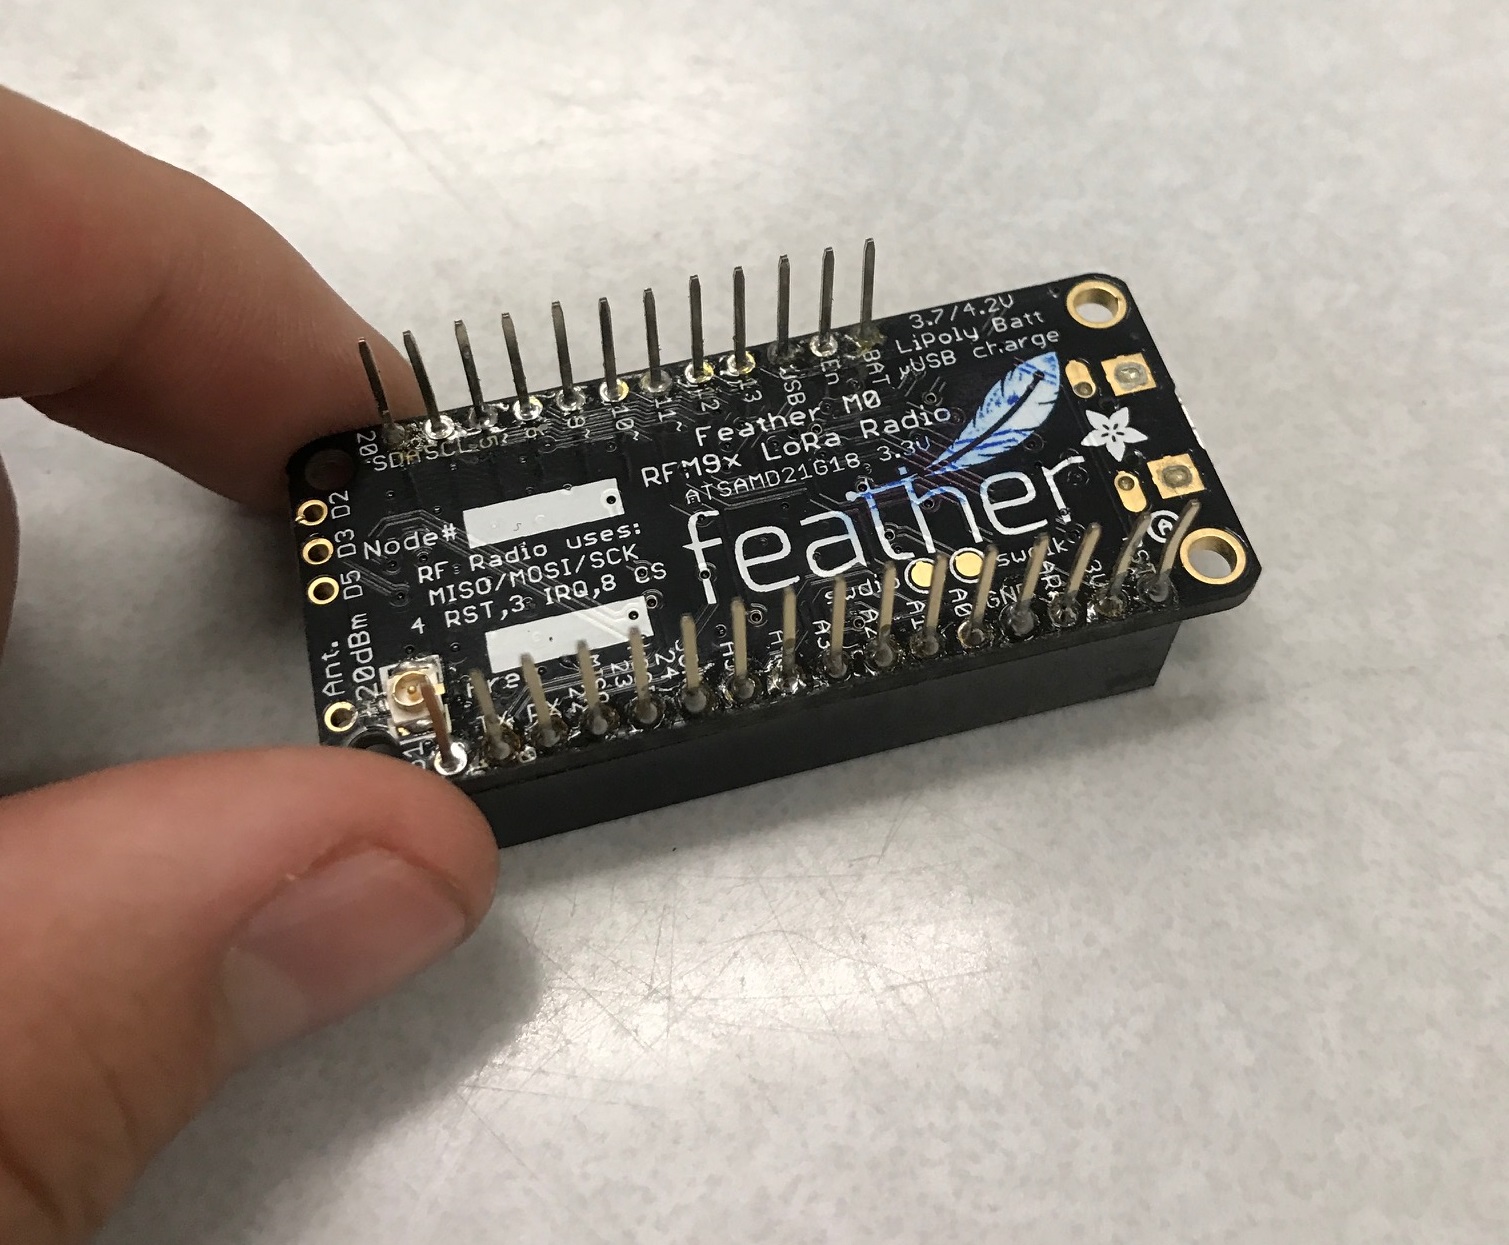
Picture of the Feather M0 with LoRa Radio with the pins correctly soldered on.
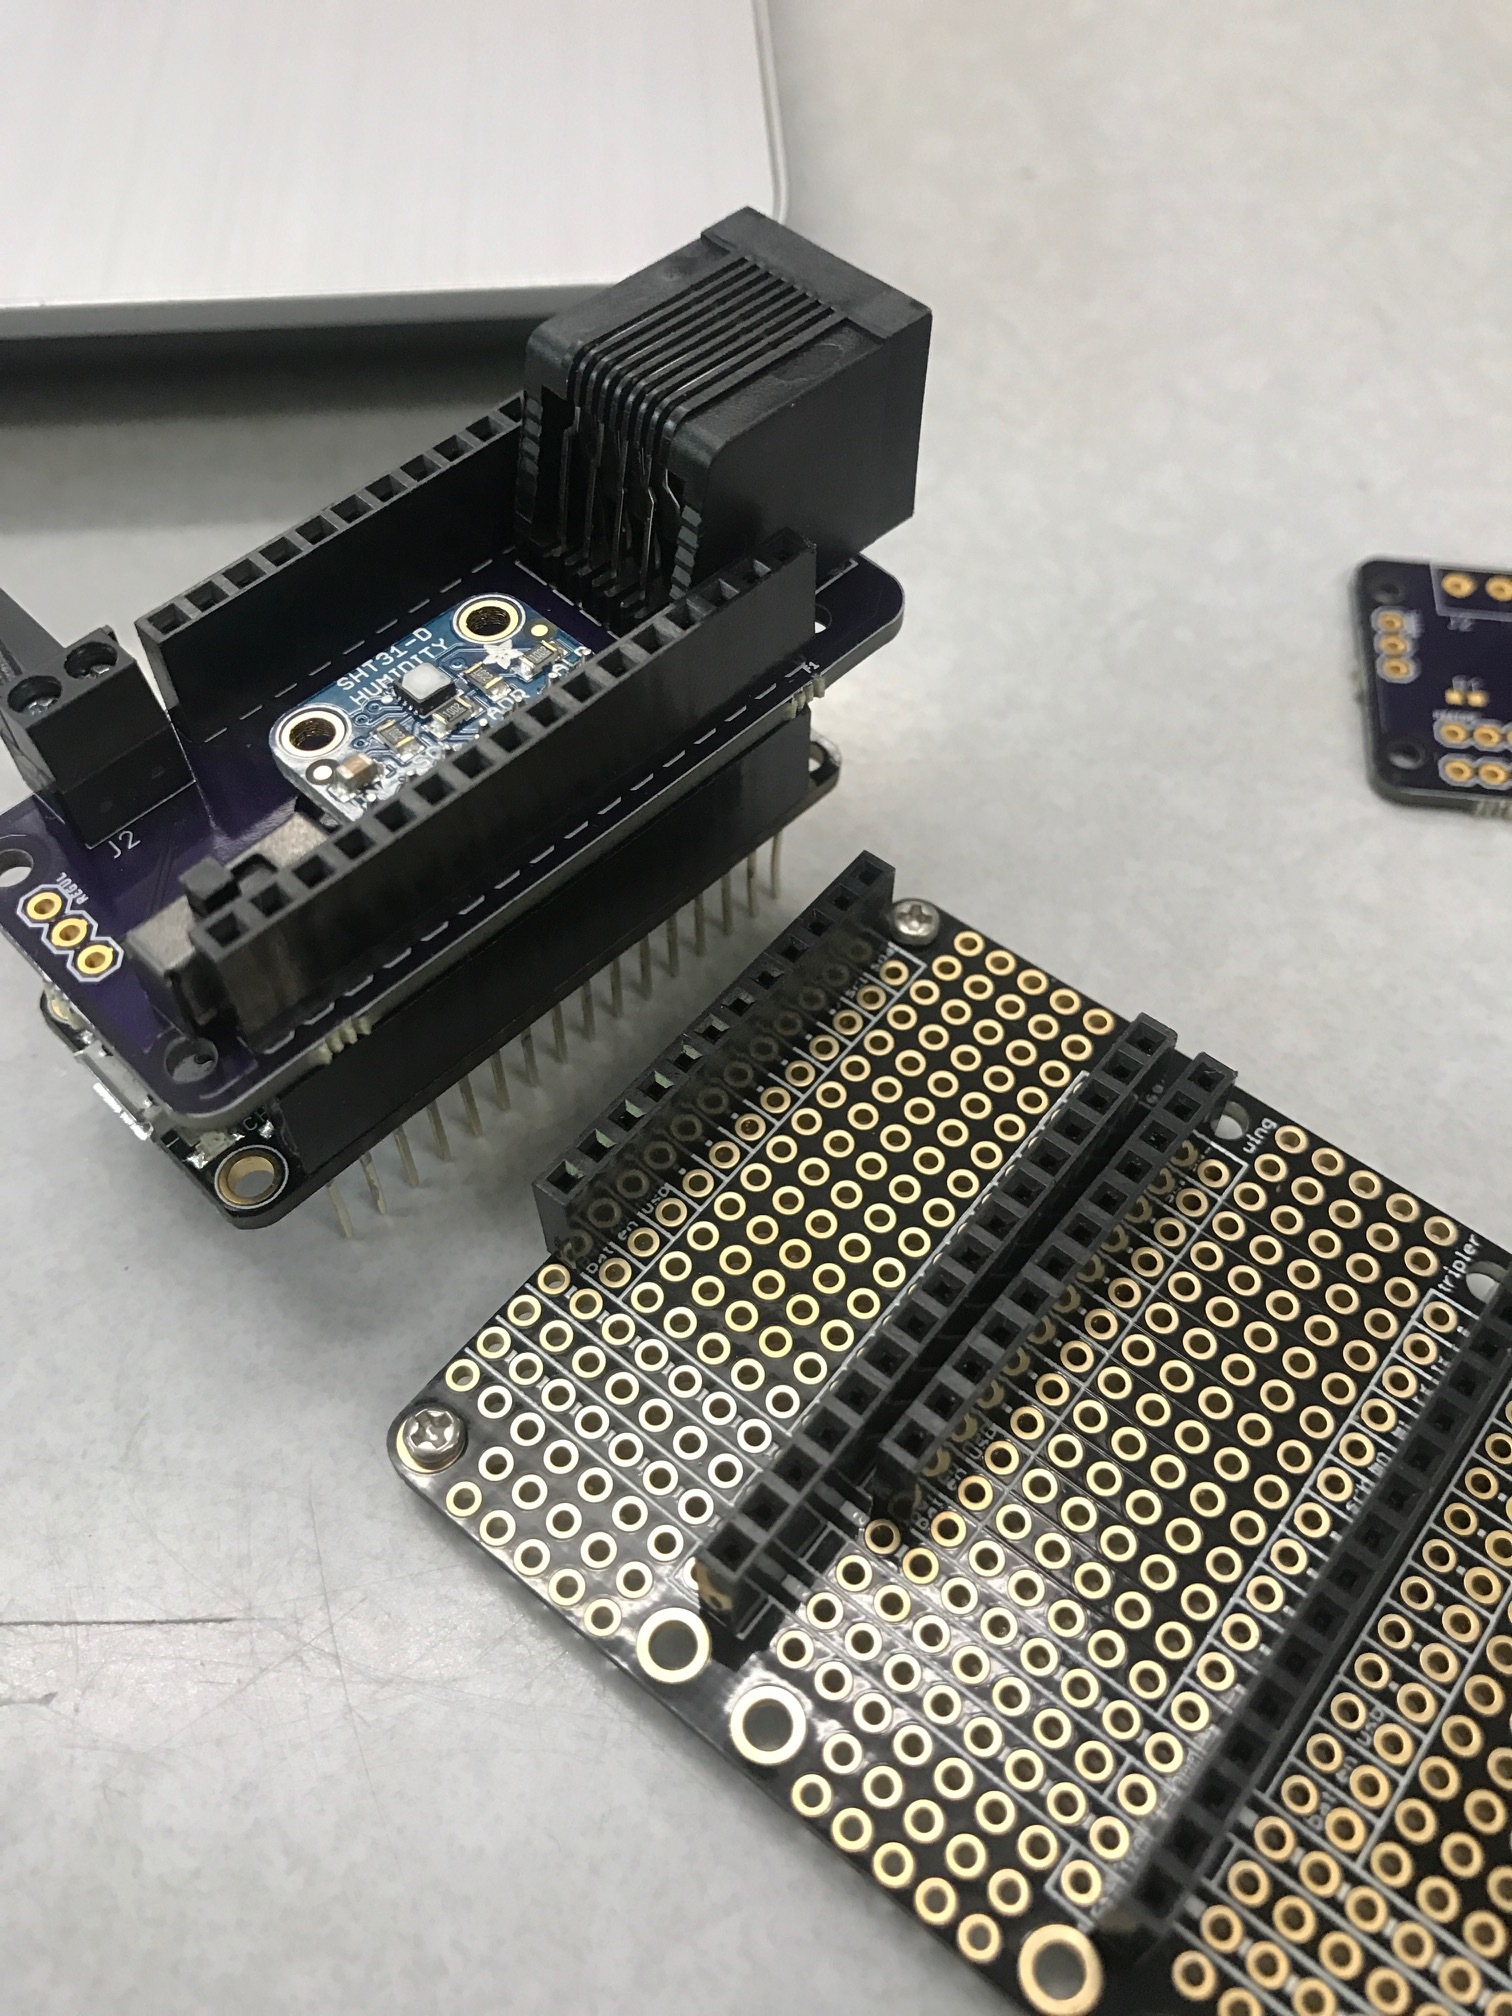
Stack the custom PCB construction on top of the Feather M0 with LoRa as shown, and solder female pins on the FeatherWing Tripler as shown.
Place the Construction onto the Tripler
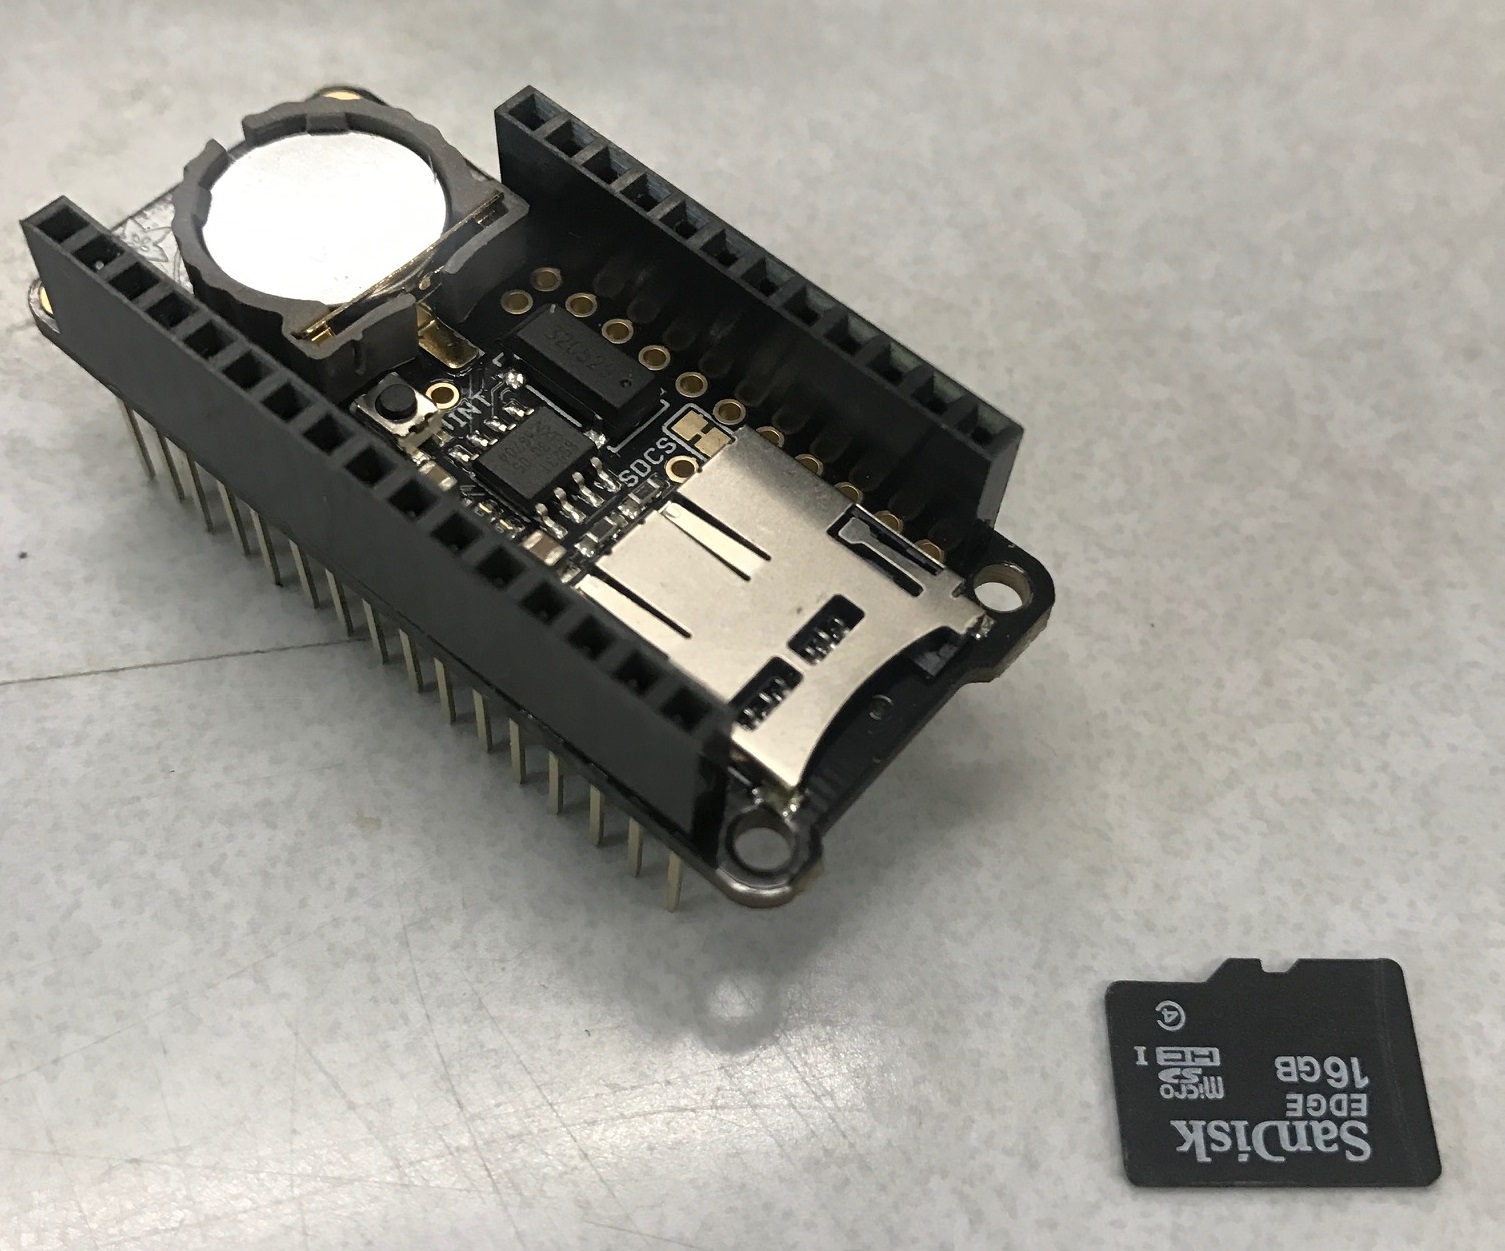
Next, solder the pins onto the Adalogger FeatherWing RTC + SD Add-on as shown. Insert Micro SD card
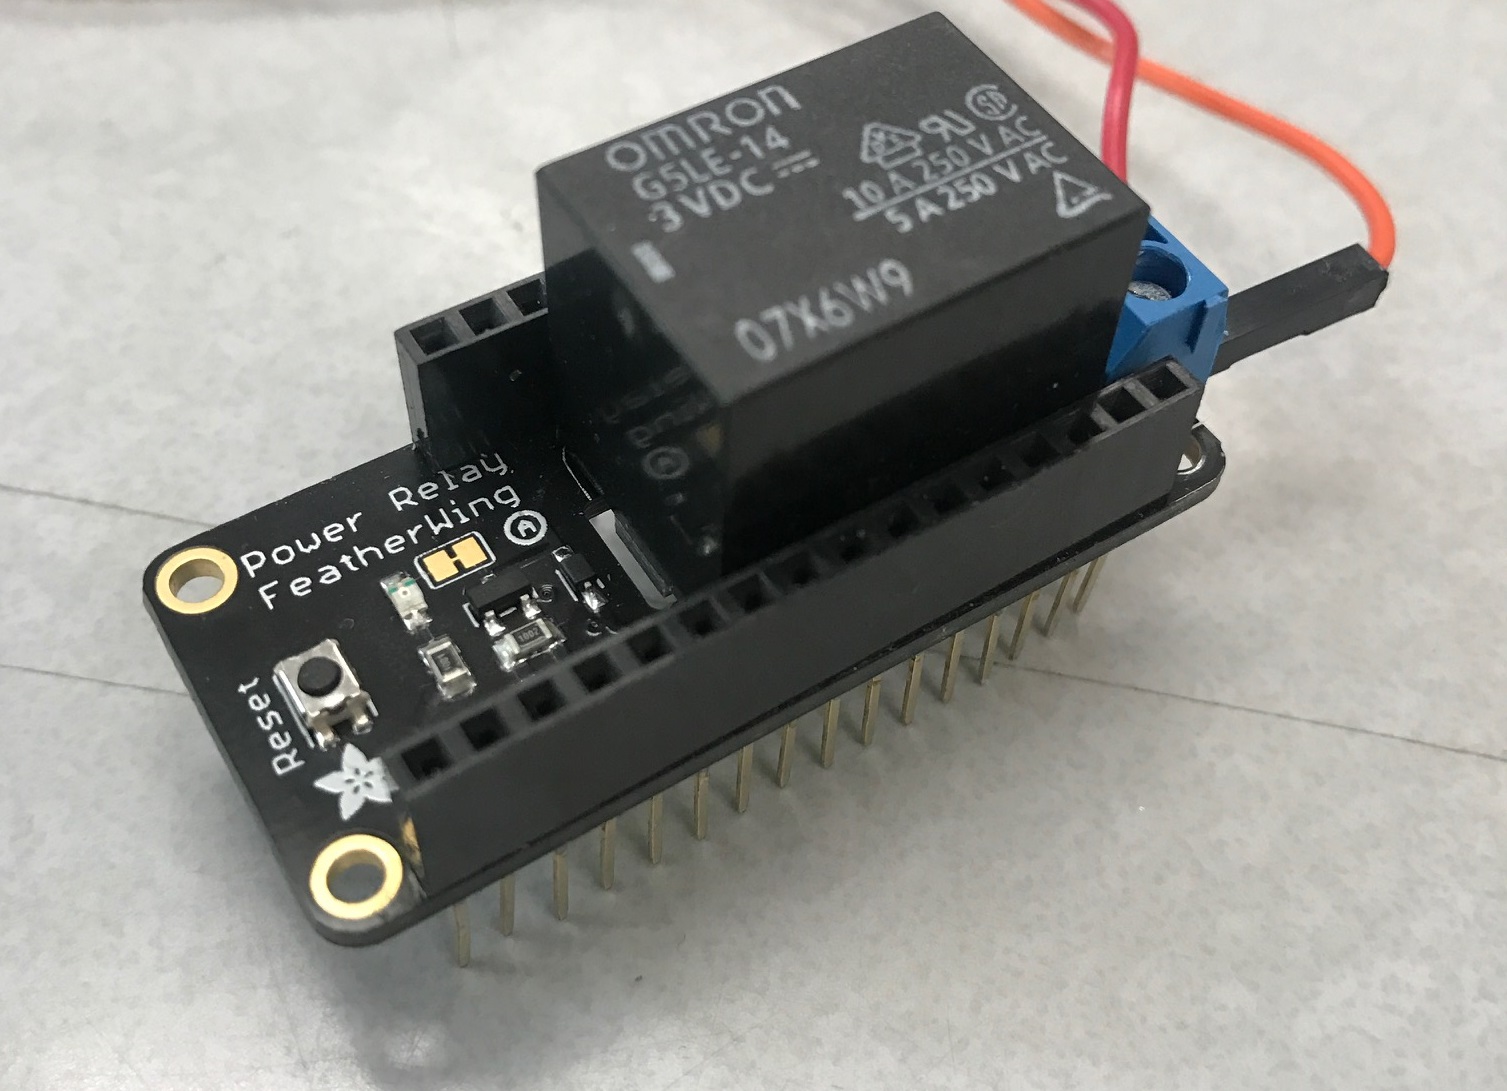
Solder the pins onto the Power Relay FeatherWing as shown.
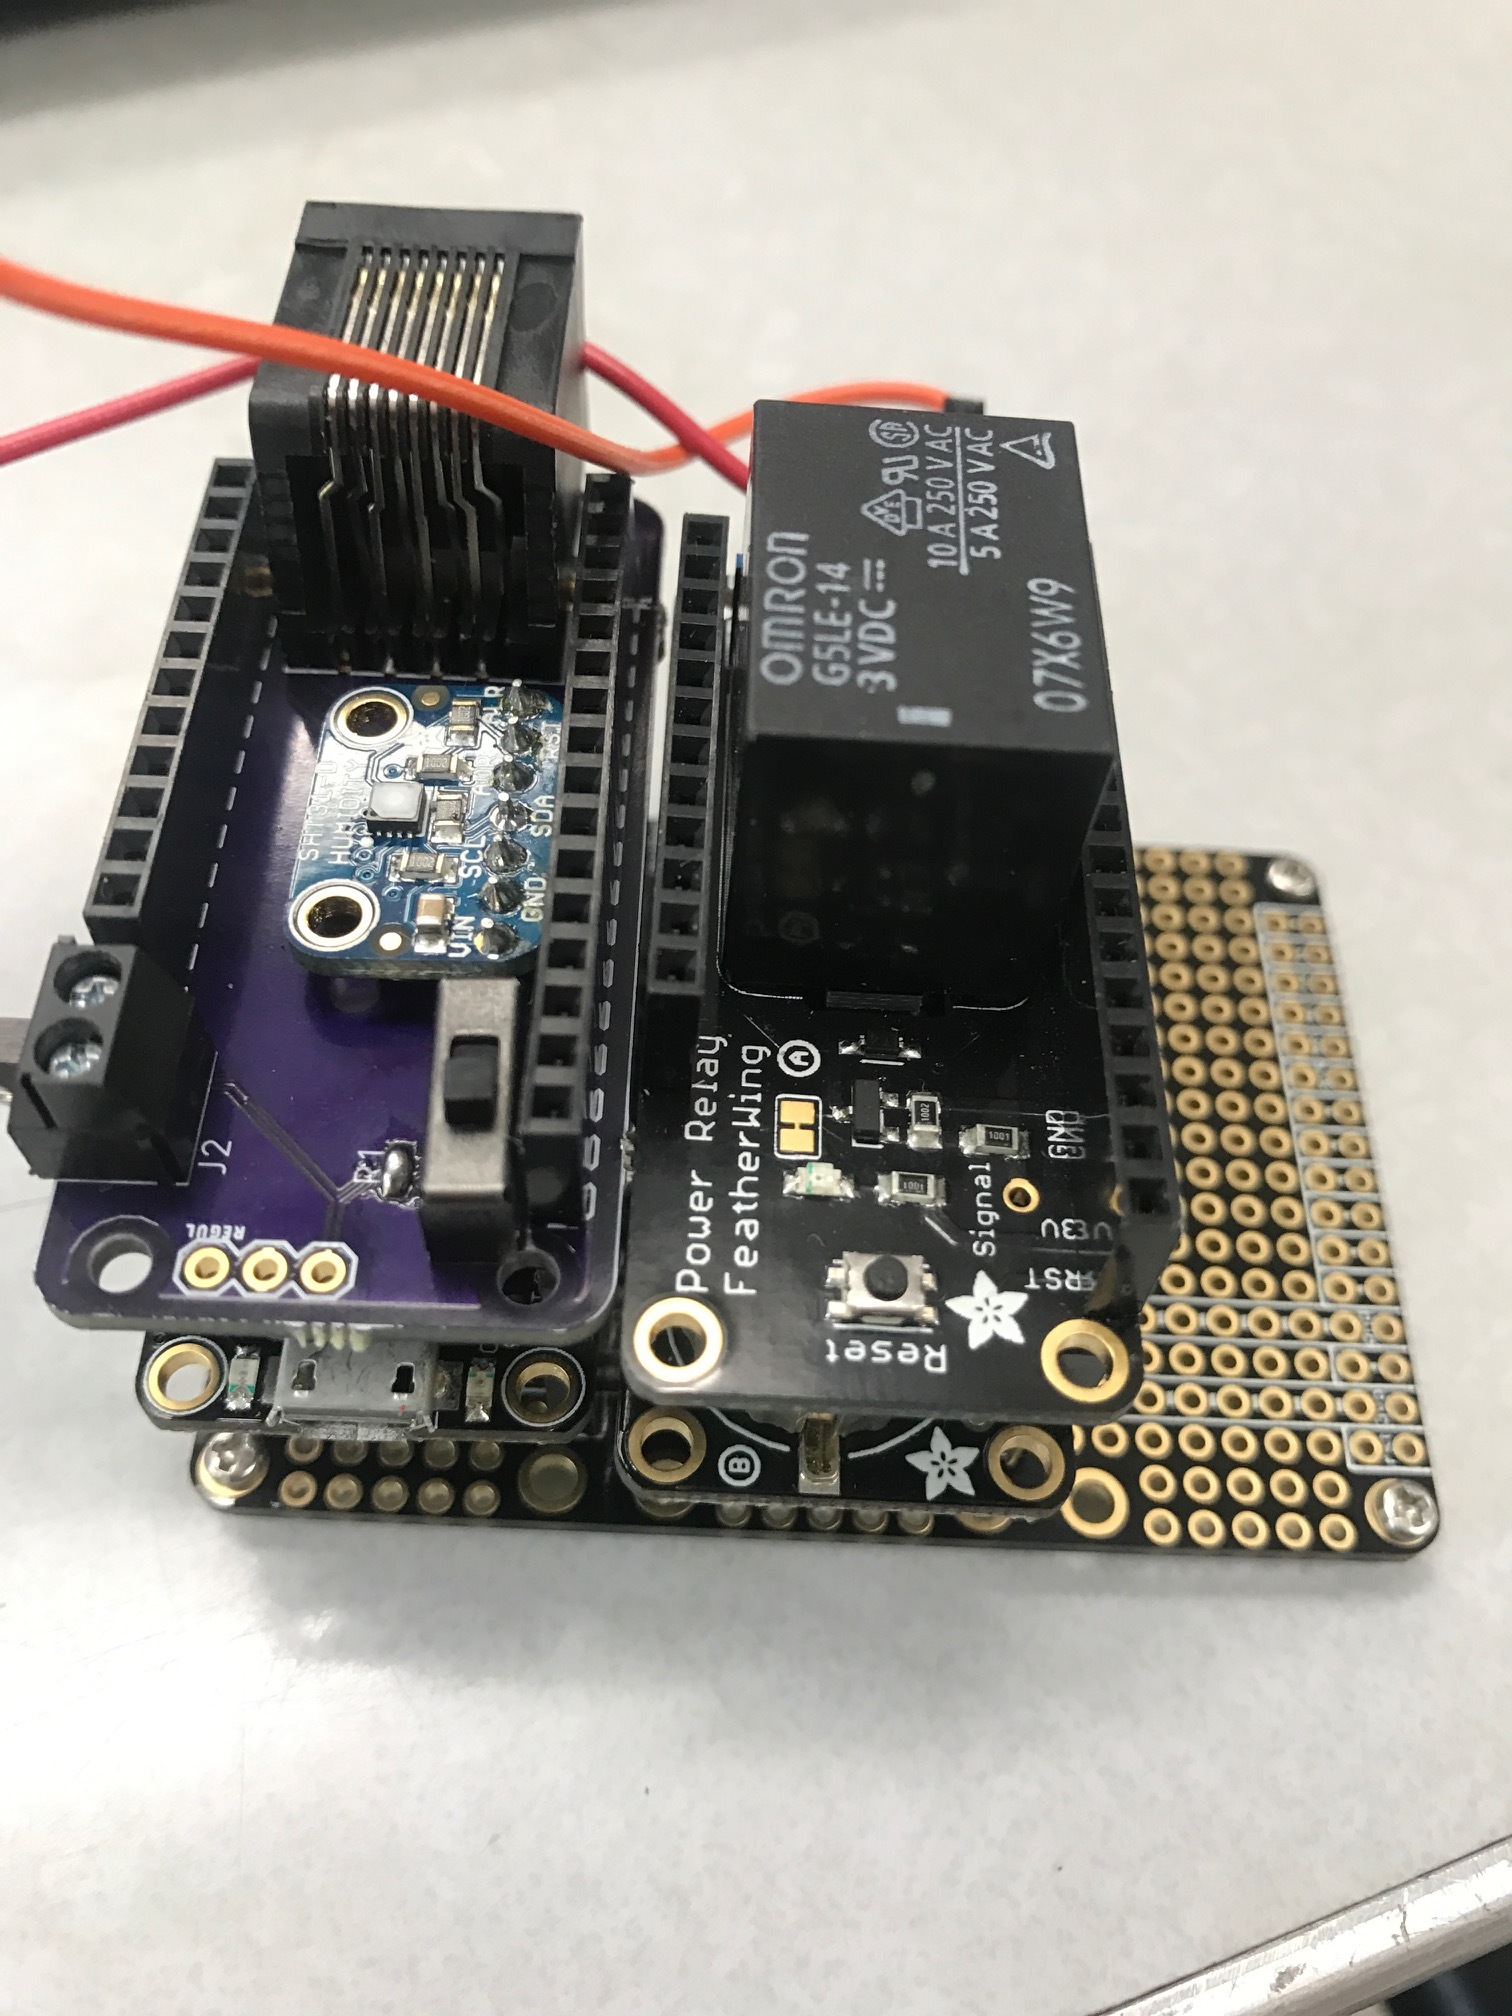
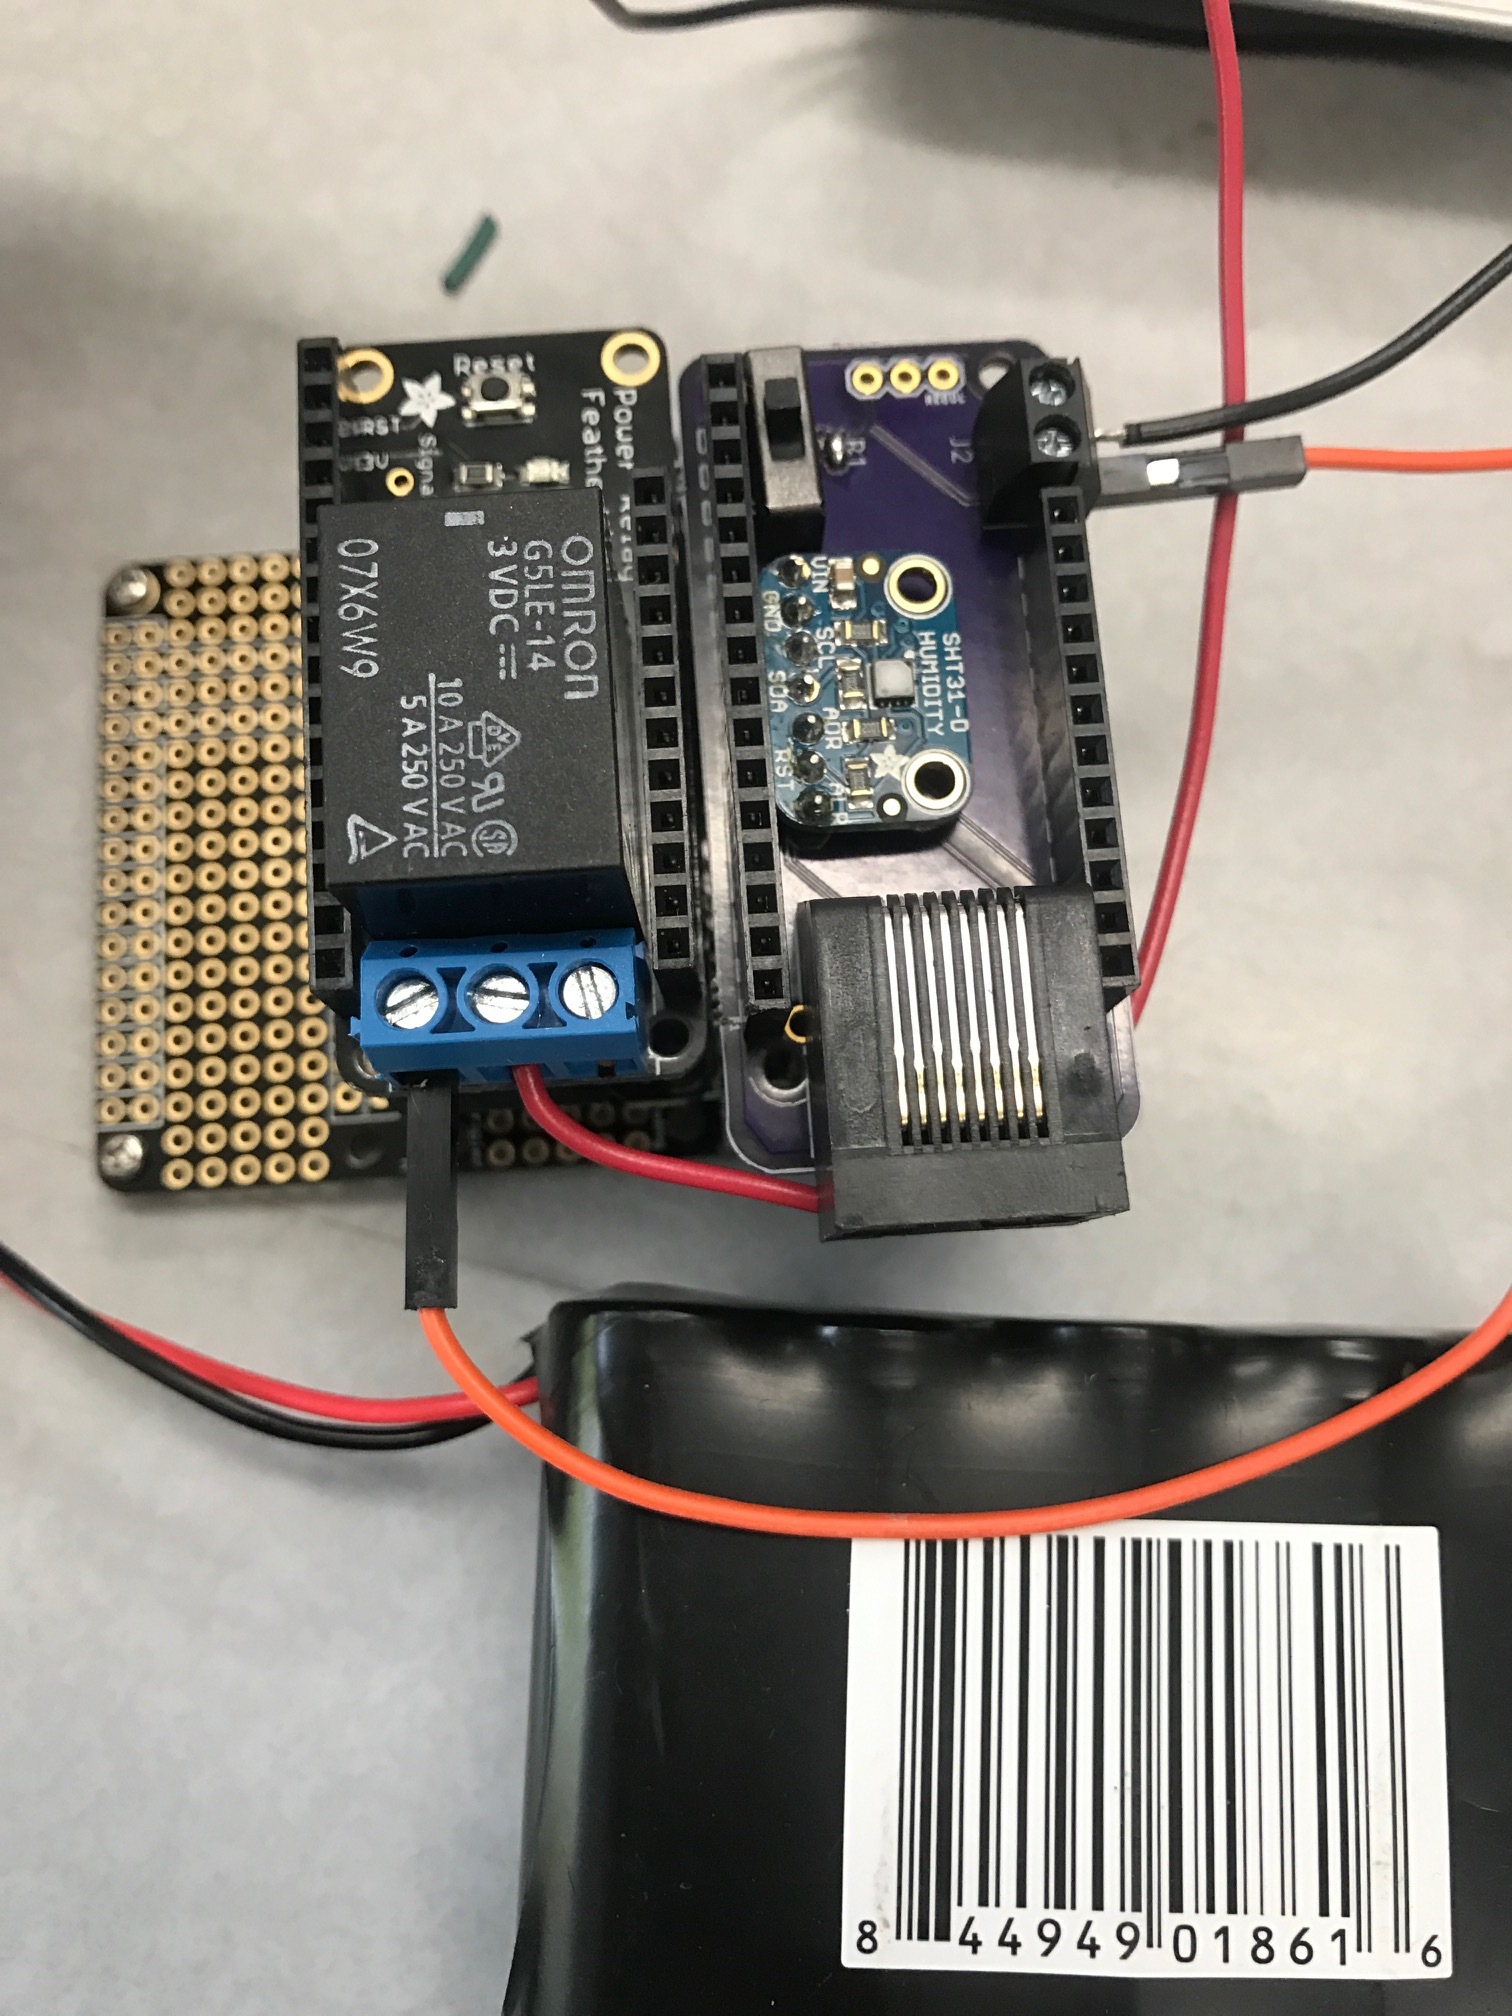
Stack the Power Relay on top of the Adalogger and place the new block onto the FeatherWing Tripler.
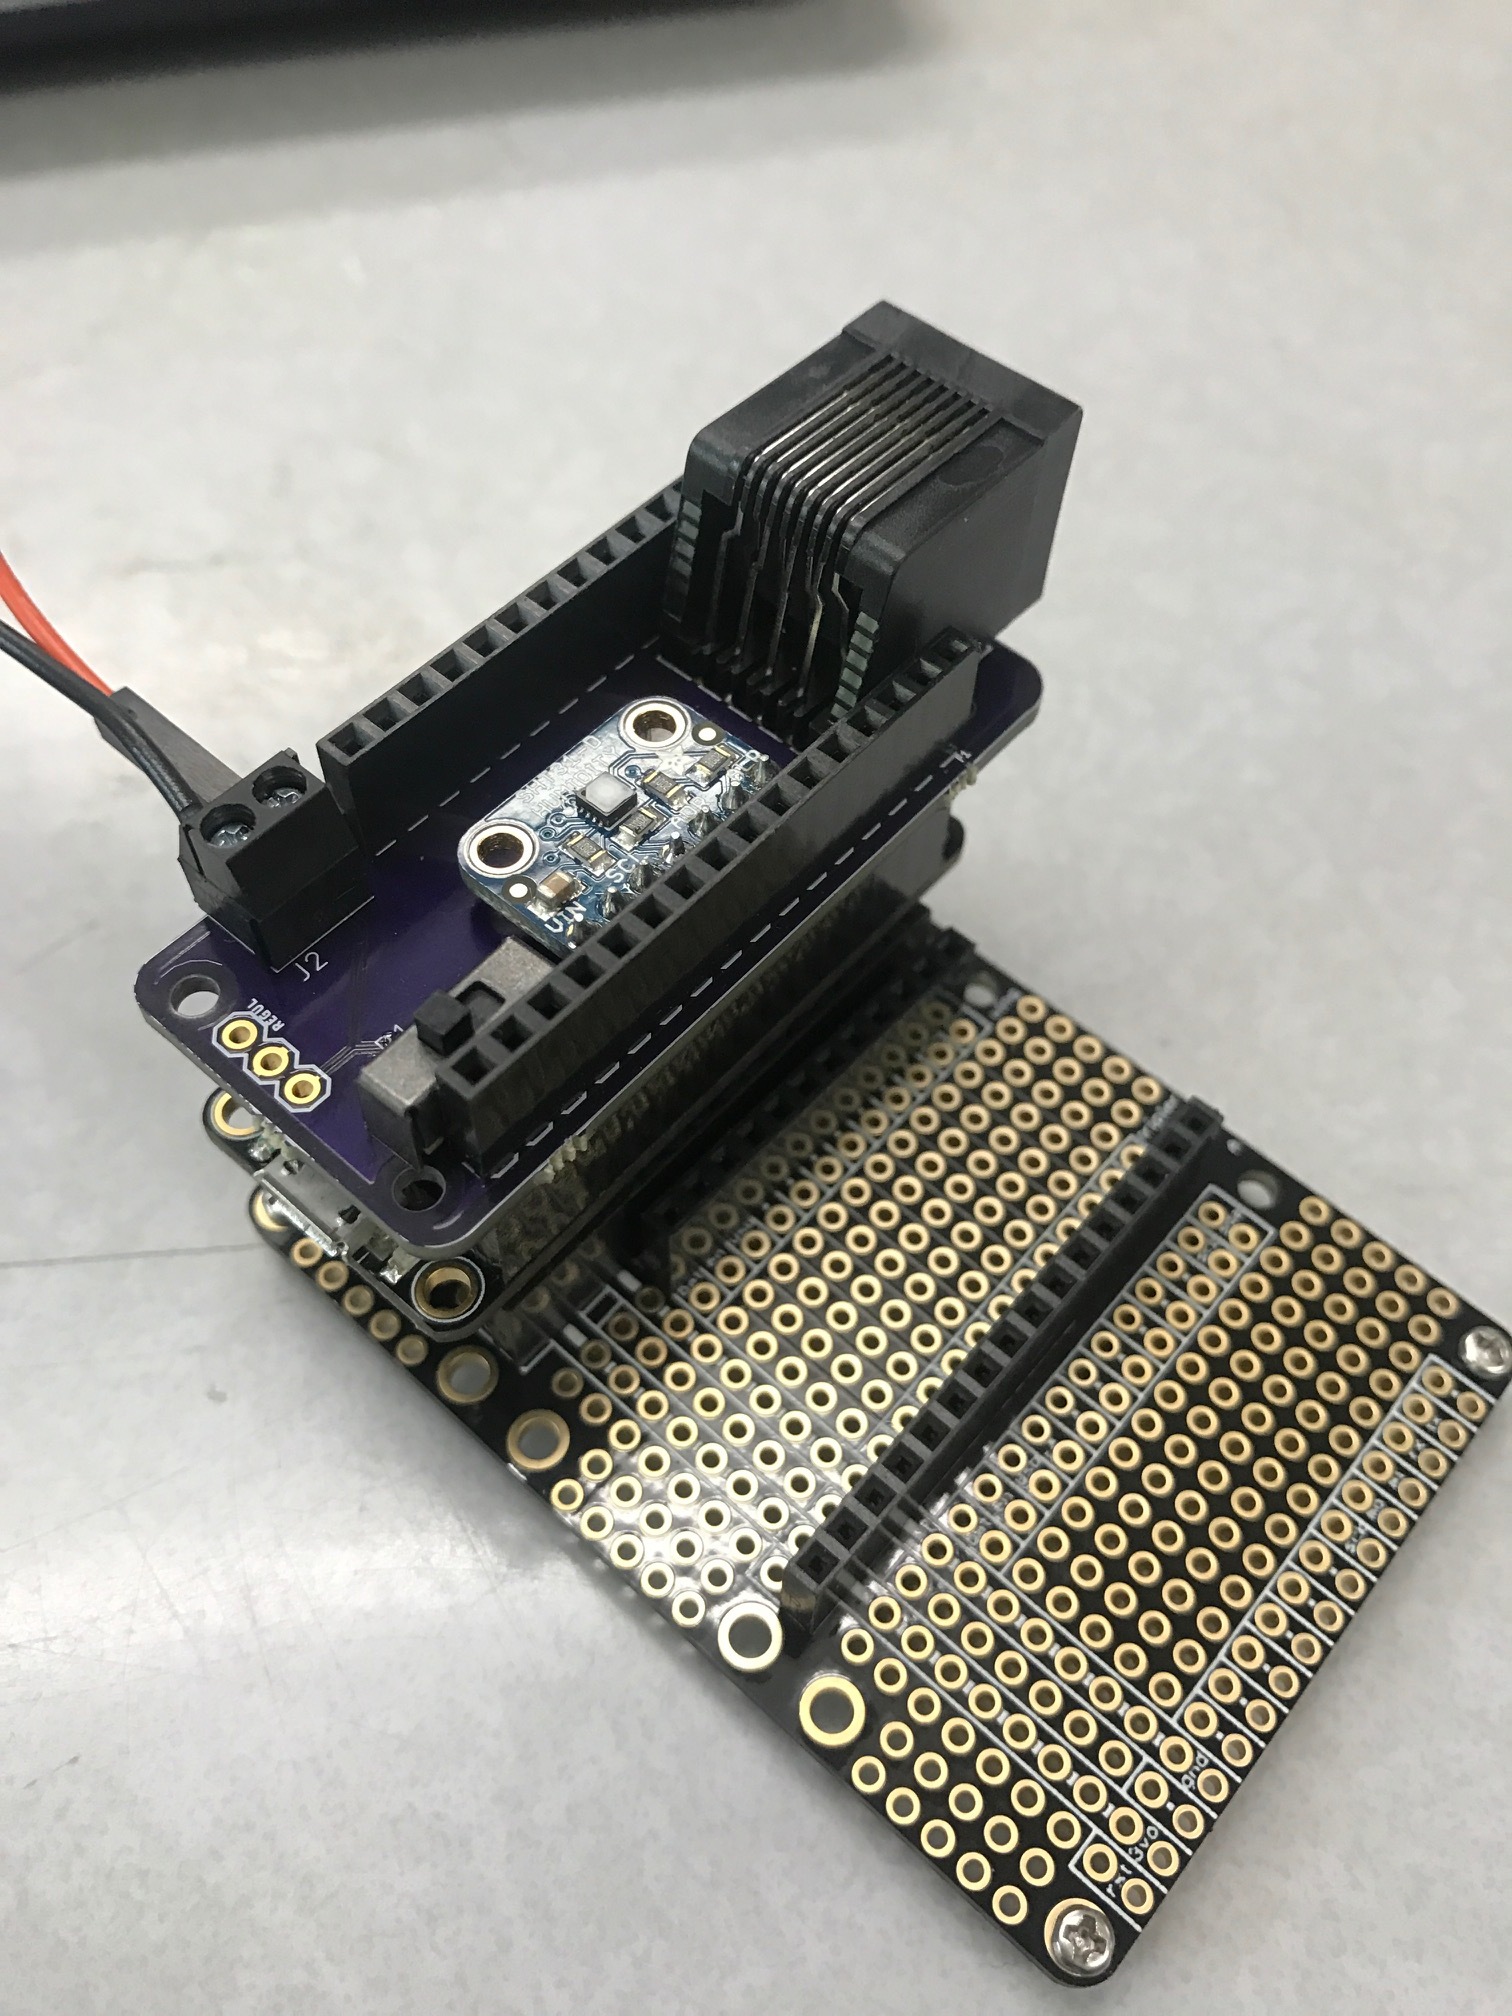
This shows the power connections for the HRM Power Model. Red is (+) on the 12V battery and Black is the (-) on the 12V battery.
This TDM circuit for our probe uses a voltage regulator instead of the power relay. This is soldered directly onto our custom PCB. Below is on picture of the boards used for the TDM circuit. NOTE: not used with the 8-pin connector, this particular model was made before we had received these. Note the labels and picture caption for construction. For differences between the TDM and HRM implementations, visit our Second Tests: Cherry Tree page for an extensive list of differences.
Ignore the small red and blue wires shown on the custom PCB. We blew one of the traces and that just corrects the error. The 12V battery is put directly to the voltage regulator through the pins on our custom PCB.
Step 6: Program the Microcontroller
This device can be fully integrated with the OPEnS designed LOOM interface. The code for the program described in this build guide is posted here (LINK). This post (LINK TO LOOM) explains these different functions in LOOM and how to use them. The following is a setup guide for how to setup the user interface to run the Sap Flowmeter data collection.
If you’ve never used an Feather M0 before, check out these two pages on Adafruit’s tutorial:
If you’ve never programmed in Arduino before (or ever), I would highly recommend reading though a few of the fundamental tutorial pages on the Arduino website until you grasp basic the basic concepts and idea of what Arduino is. Linked here.
This is the current model of the enclosure. Its features include: snap-fit lid, compartments for the 3.3V & 12V batteries, mounts for the Adafruit FeatherWing tripler to hold the circuit in place, hole for the waterproof Ethernet cable gland, hole for LoRa antenna (6mm near the mounts), and hole for the soil/moisture sensor aux cable gland (9.5mm across from antenna hole). The compartments in the back right corner are to hold the batteries and prevent them from sliding around. The mounts on the base of the enclosure are design to hold M2 size screw bases. M2 screws fit through the holes in the Adafruit tripler board, thus securing it to the enclosure.
To fully waterproof the enclosure, we recommend treating the enclosure and its lid with acetone to fully seal the plastic. We also recommend lining the lid with a sealant (hot glue, caulk) to make sure no water seeps in and messes up the circuitry inside during testing. The lid of the enclosure, for now, takes some work to get off, so we designed handles to make this easier.
Again, the model for our enclosure is always updating as we improve our design, so this is not a final design by any means.
Step 8: Install in Tree
NOTE: Make sure to read and understand this section entirely before proceeding with an install.
In order to to ensure that the probes are properly spaced, a 3D printed guide should be used. This version has a 30 mm spacing between the center of the two outside probes. Future tests should test with different probe spacing. This doesn’t need to be as precise as the thermal epoxy mold; we used a Lulzbot Taz 5.
Once the probe is all set up, drill holes in the chosen tree such that each probes fits inside perfectly and inside the tree up to the probe guide. For the best results, drill the holes approximately 1 meter from the ground (CITE). To find the perfect placement for these holes, I traced the bottom portion of the probe guide onto a piece of paper to make sure the holes were perfectly spaced. Make sure to use the proper size drill bit!
Install the probe will the heater probe above the temperature probe. This is important for TDM testing. Fill the holes with the thermal paste to keep the holes sealed and the probes in place. As of right now, we have not tested with the thermal paste.
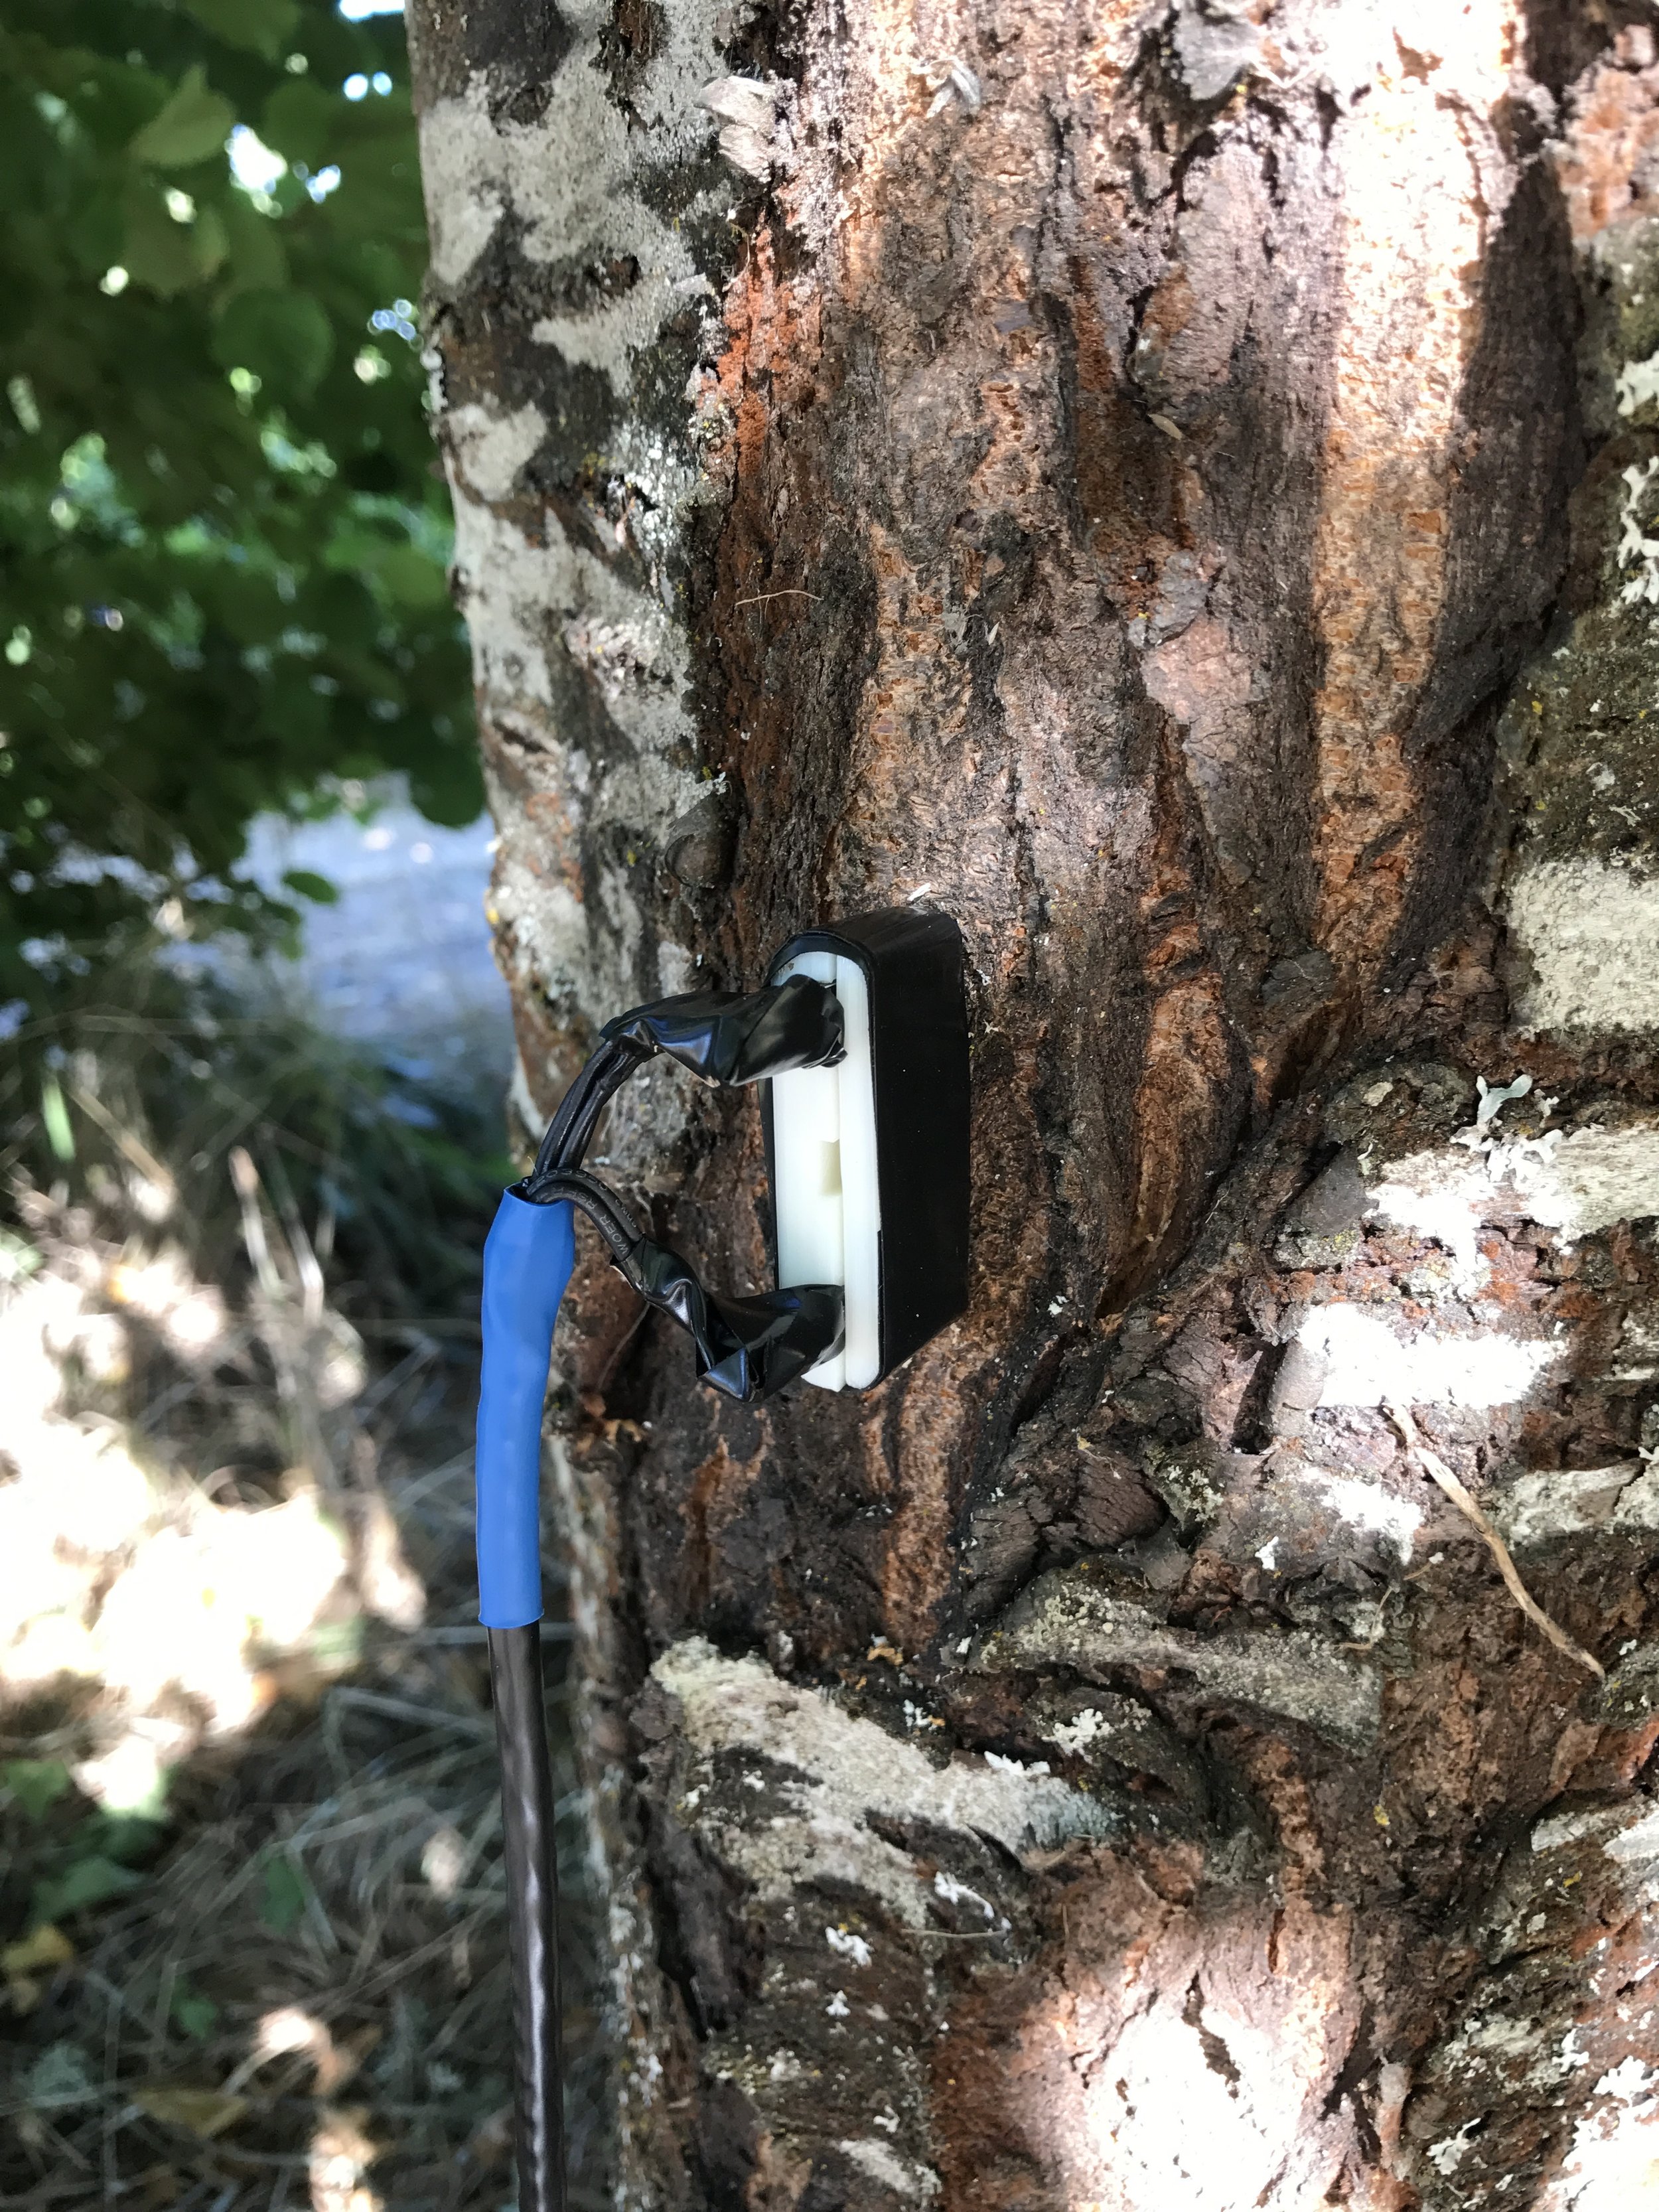
Once the probe is in the tree, make sure to cover it with some layers of protection. For an example of this, checkout the Dynamax installation video. Here is a picture of our method:
Our TDM Probe in the Tree! The probes fit perfectly into the drilled holes with properly applied epoxy. For a guide on how to test and to see our data, go check out our tree test page!
A probe was built as described in this build-guide. The following data was returned from the sensor.
Methods
An Adafruit Feather M0 with Lora capabilities was used to take measurements from the sap flow sensor. It activated an NPN mosfet that was connected in series with the +battery the heater probe and ground (or -battery).
Analog values were recorded by the board’s dedicated analog in pins. As per default, these readings were 10-bit although the M0 chip has the capability to do 12-bit ADC (detailed in this link). This would increase the theoretical precision four-fold and is something that should be investigated in the future. These raw values were logged onto an SD card. The electronics were run off of a 4AH battery until it died (after around days).
Additionally, an Adafruit SHT31-D breakout board was wired up and placed in the enclosure to provide ambient temperature values that also recorded day-night cycles.
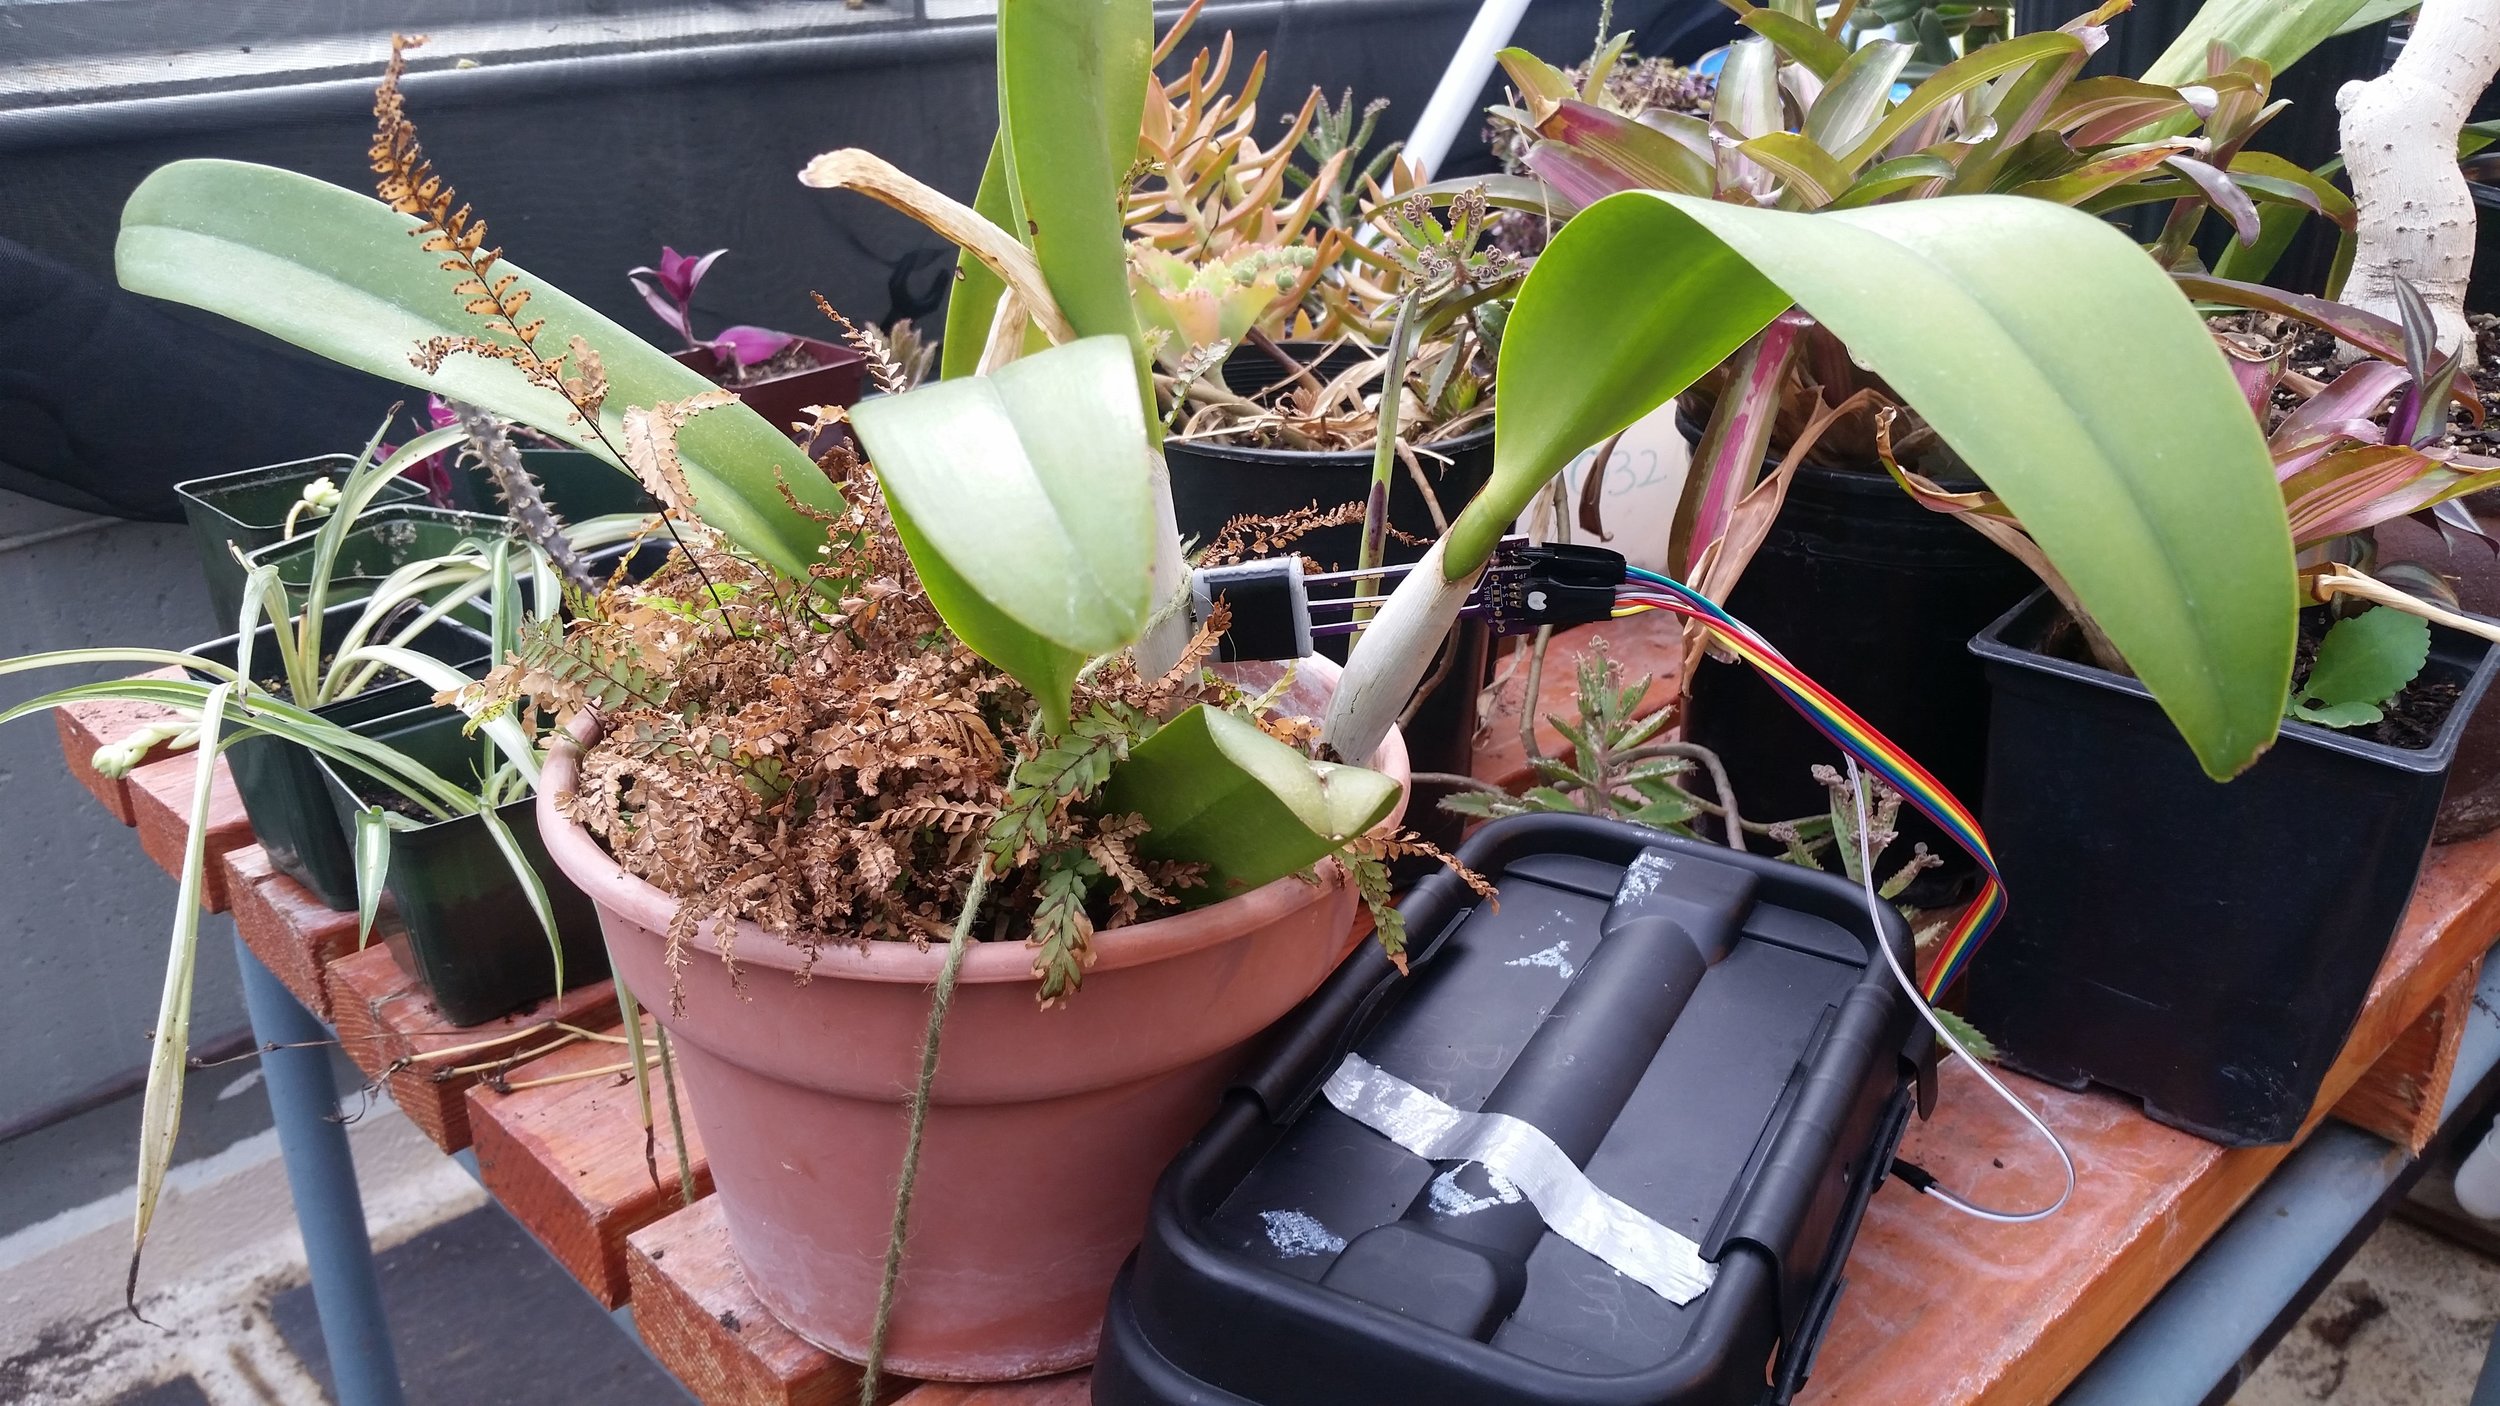
In order to make the setup water resistant, electrical tape was wound around any electrical connections, the probes were covered in silicone conformal coating, and the microcontroller and battery were placed in a waterproof box, the DriBox.
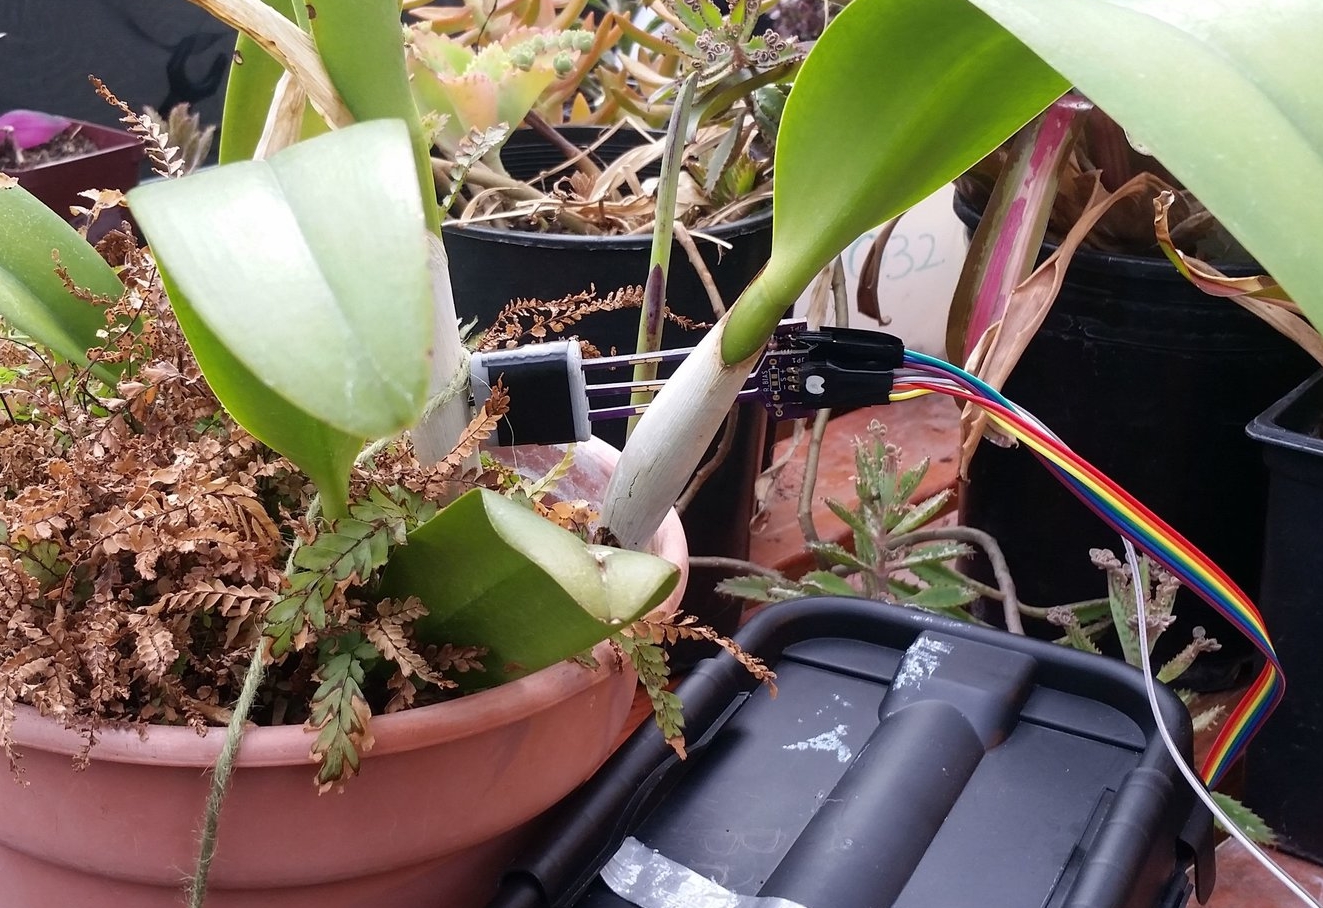
Image of the testing setup.
Results
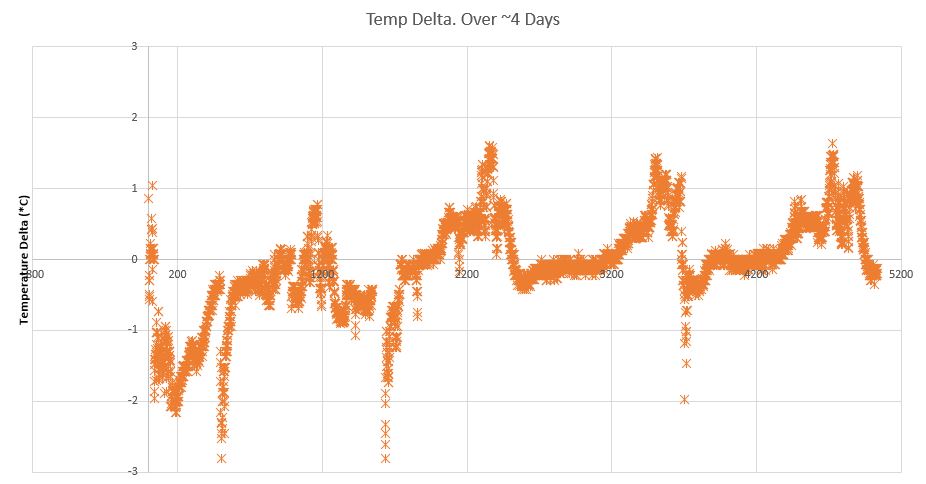
The following graph was determined from the plant data. As you can see, there is a cyclic pattern happening, with the temperature differential. However, there are also several large “spikes” in the data. Talking with the greenhouse manager, it turns out that the timing of those spikes corresponds directly with the time he waters the plants. Best guest, water either cooled down one of the probes or got into the connections and acted as a short briefly before evaporating. The full raw data can be downloaded here.
Graph over ~3.6 days worth of data. Data was logged every 60 seconds by an Adafruit M0 Feather with Lora.
To determine the exact temperatures from the two probes, two equations were used. The first one was a simple voltage divider equation to get the resistance of the thermistor. From the resistance, the thermistor beta equation was used to determine the temperature. The beta value for the beta value of the thermistor used (link here) was determined from its product datasheet. Unfortunately, the exact equations used were removed when I saved the file as its native CSV format after editing it in excel instead of saving it in an excel format (learn from my mistakes!).
This post will provide step by step instructions on how to build your own thermal dissipation sap flow sensor. Seperate blog posts fully explain the what a thermal pulse sap flow sensor does, the idea behind this design, and the code involved (coming later).
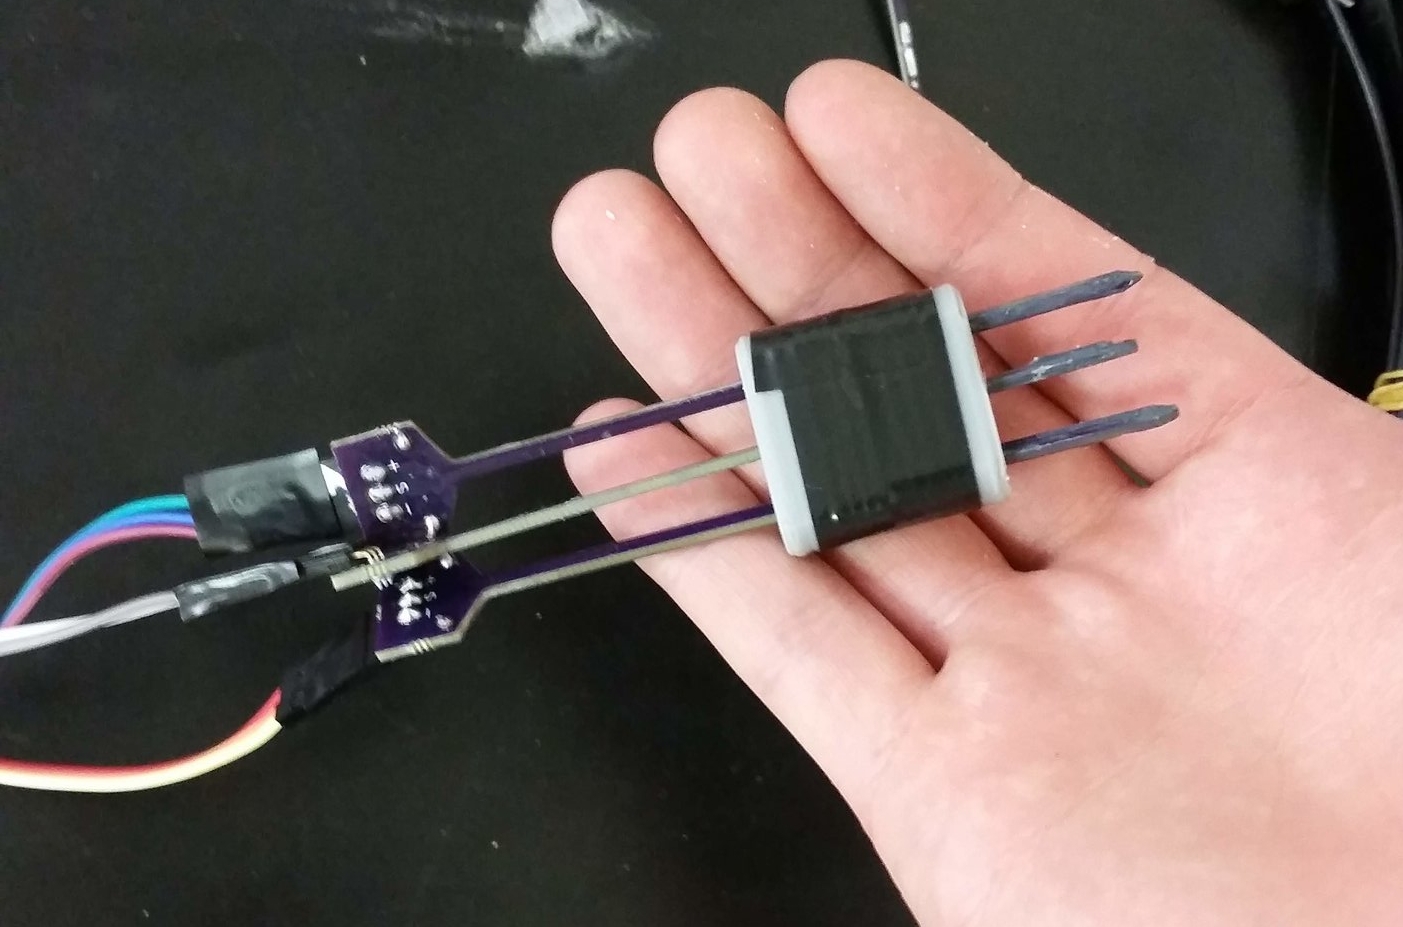
A probe in the hand is worth two in the bush. Probes are not angled correctly in this image.
Index
Order parts
Solder probes
Apply thermal epoxy
Wire it up
Program microcontroller
Install in a plant.
Step 0: Required Tools
Before jumping into the project, it’s important to mention that this project requires a few specialty devices to make.
The Feather M0 can be substituted for any micro controller with analog-in pins with some changes to the code to accommodate these new pins (mentioned briefly in Step 4) and if a different voltage batter is used, you should take a look at this blog post and change the heater resistor value.
When ordering the electronic parts I would highly suggest you buy spare parts, especially any 0603 resistors (I baked those into the single sensor BOM). It’s important to note the tolerance of the bias resistor (line 5), a lower tolerance can be used if it is calibrated for (a later blog post should talk about this).
Step 2: Solder Probes
Once you’ve received all the parts, it’s time to break out the soldering iron, tweezers, and reading glasses (optional) to tackle the most difficult step of this build: soldering on US0603 sized resistors. Soldering these on is a major test of patience even for veteran electrical engineers, but not impossible for first-time solders. Here are a few tips and tricks that should help: article from build-electronic-circuits.com, video from Engenuics Technologies.
Thermistor properly soldered on the end of a probe. These suckers are TINY!
For the current design, three resistors need to be soldered: two thermistors and one low-ohm heater resistor. I find it helpful to mark which one is which immediately after soldering with some nail polish so I don’t get them confused because they look identical.
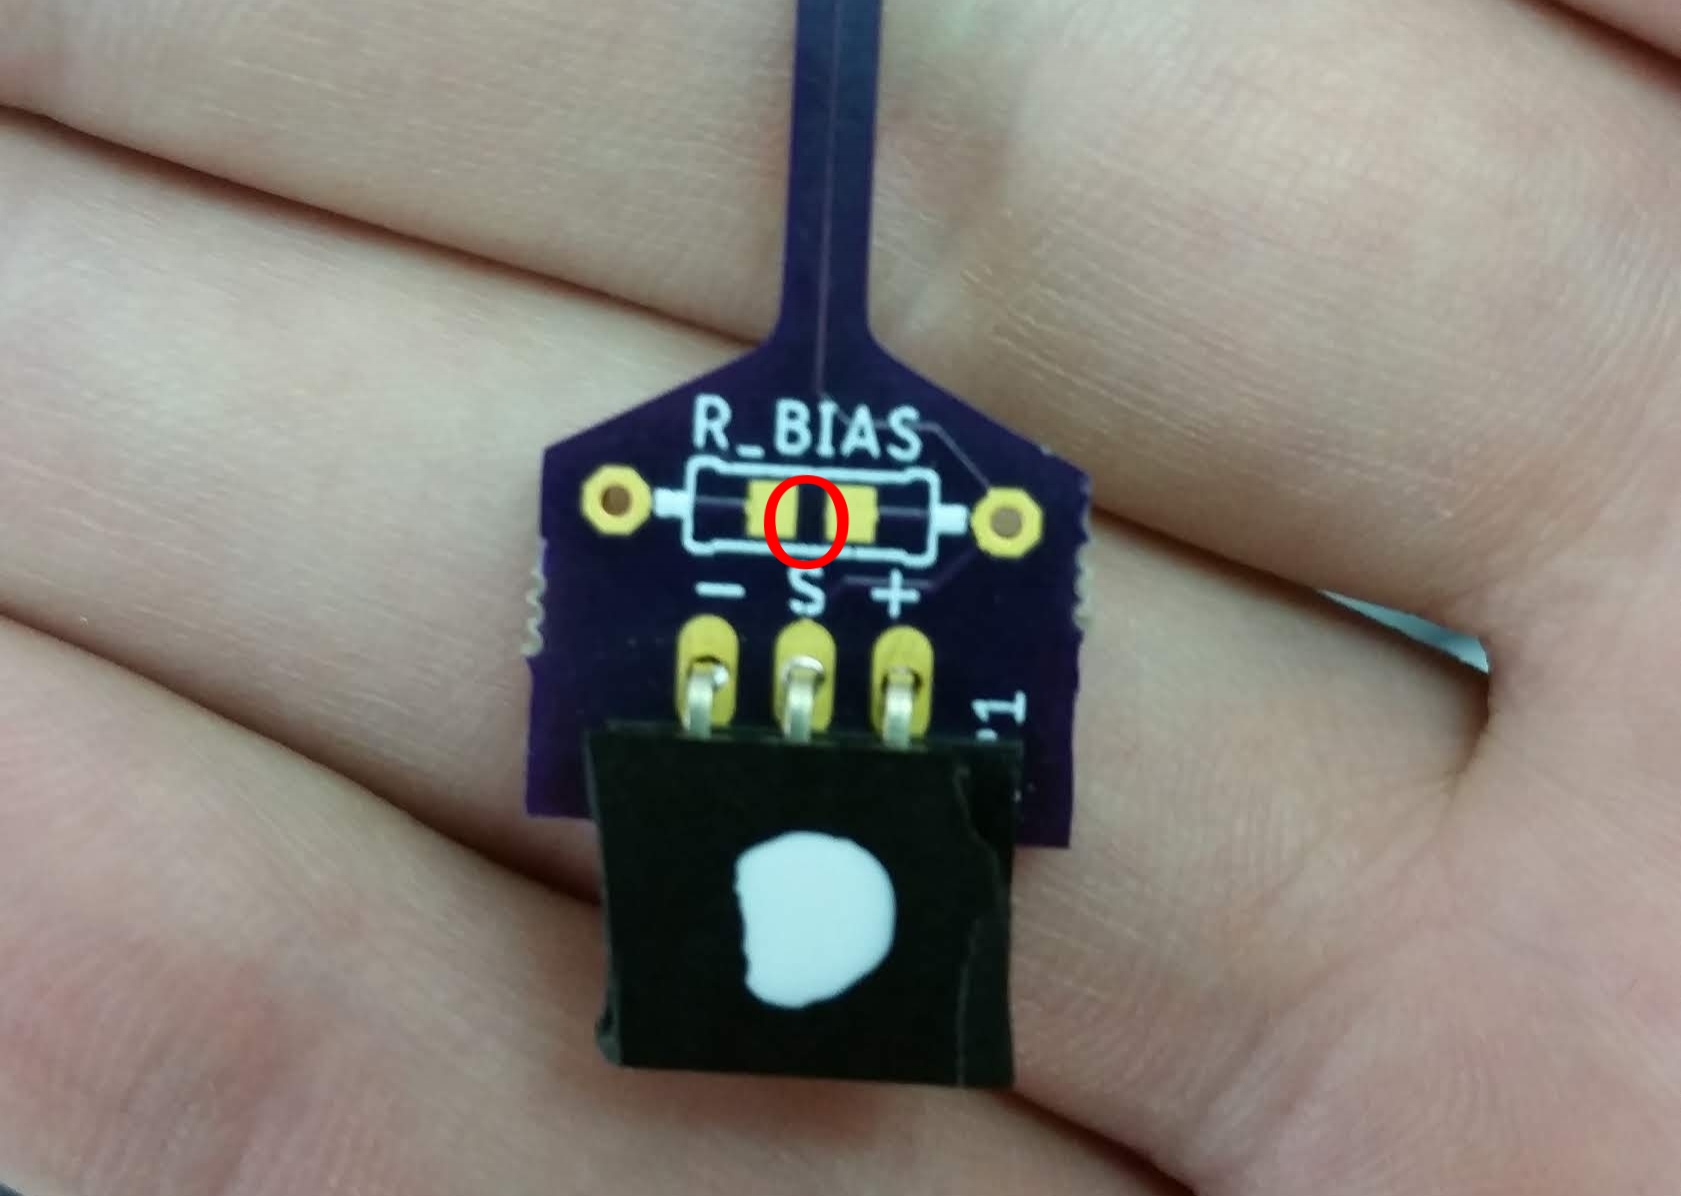
After the tiny resistors are in place on the end of the probe, its time to move down and solder on connectors on all the probes, 100K ohm bias resistors on the thermistor probes, and “short” the bias resistor on the heater probes using a large clump of solder on the 0603 pads (circled in red below). Use a multimeter to make sure all solder points are good and that the probe resistor is not shorted. The temperature probe should have a resistance of ~100k (this will vary based on temperature). The heater probe should have a resistance of 50 ohms (or whatever heater ohm is chosen).
Image of the base of the heater resistor. Notice the 90 deg female headers, the dip of fingernail polish identifying it, and the lack of a bias resistor. Probes with the thermistor will have a bias resistor. The bias resistor has optional pads to replace the through-hole mount with another 0603 resistors cirlced in red– for the heater probes these should be “shorted” using a large glob of solder.
As kind of a placeholder, the current connectors on the probes are 90 deg female headers. Eventually it would be a good idea to add a waterproof connector onto the ends; I’ve had my eye on TE’s DEUTSCH DTF13-3P for a while for this purpose.
Step 3: Apply Thermal Epoxy
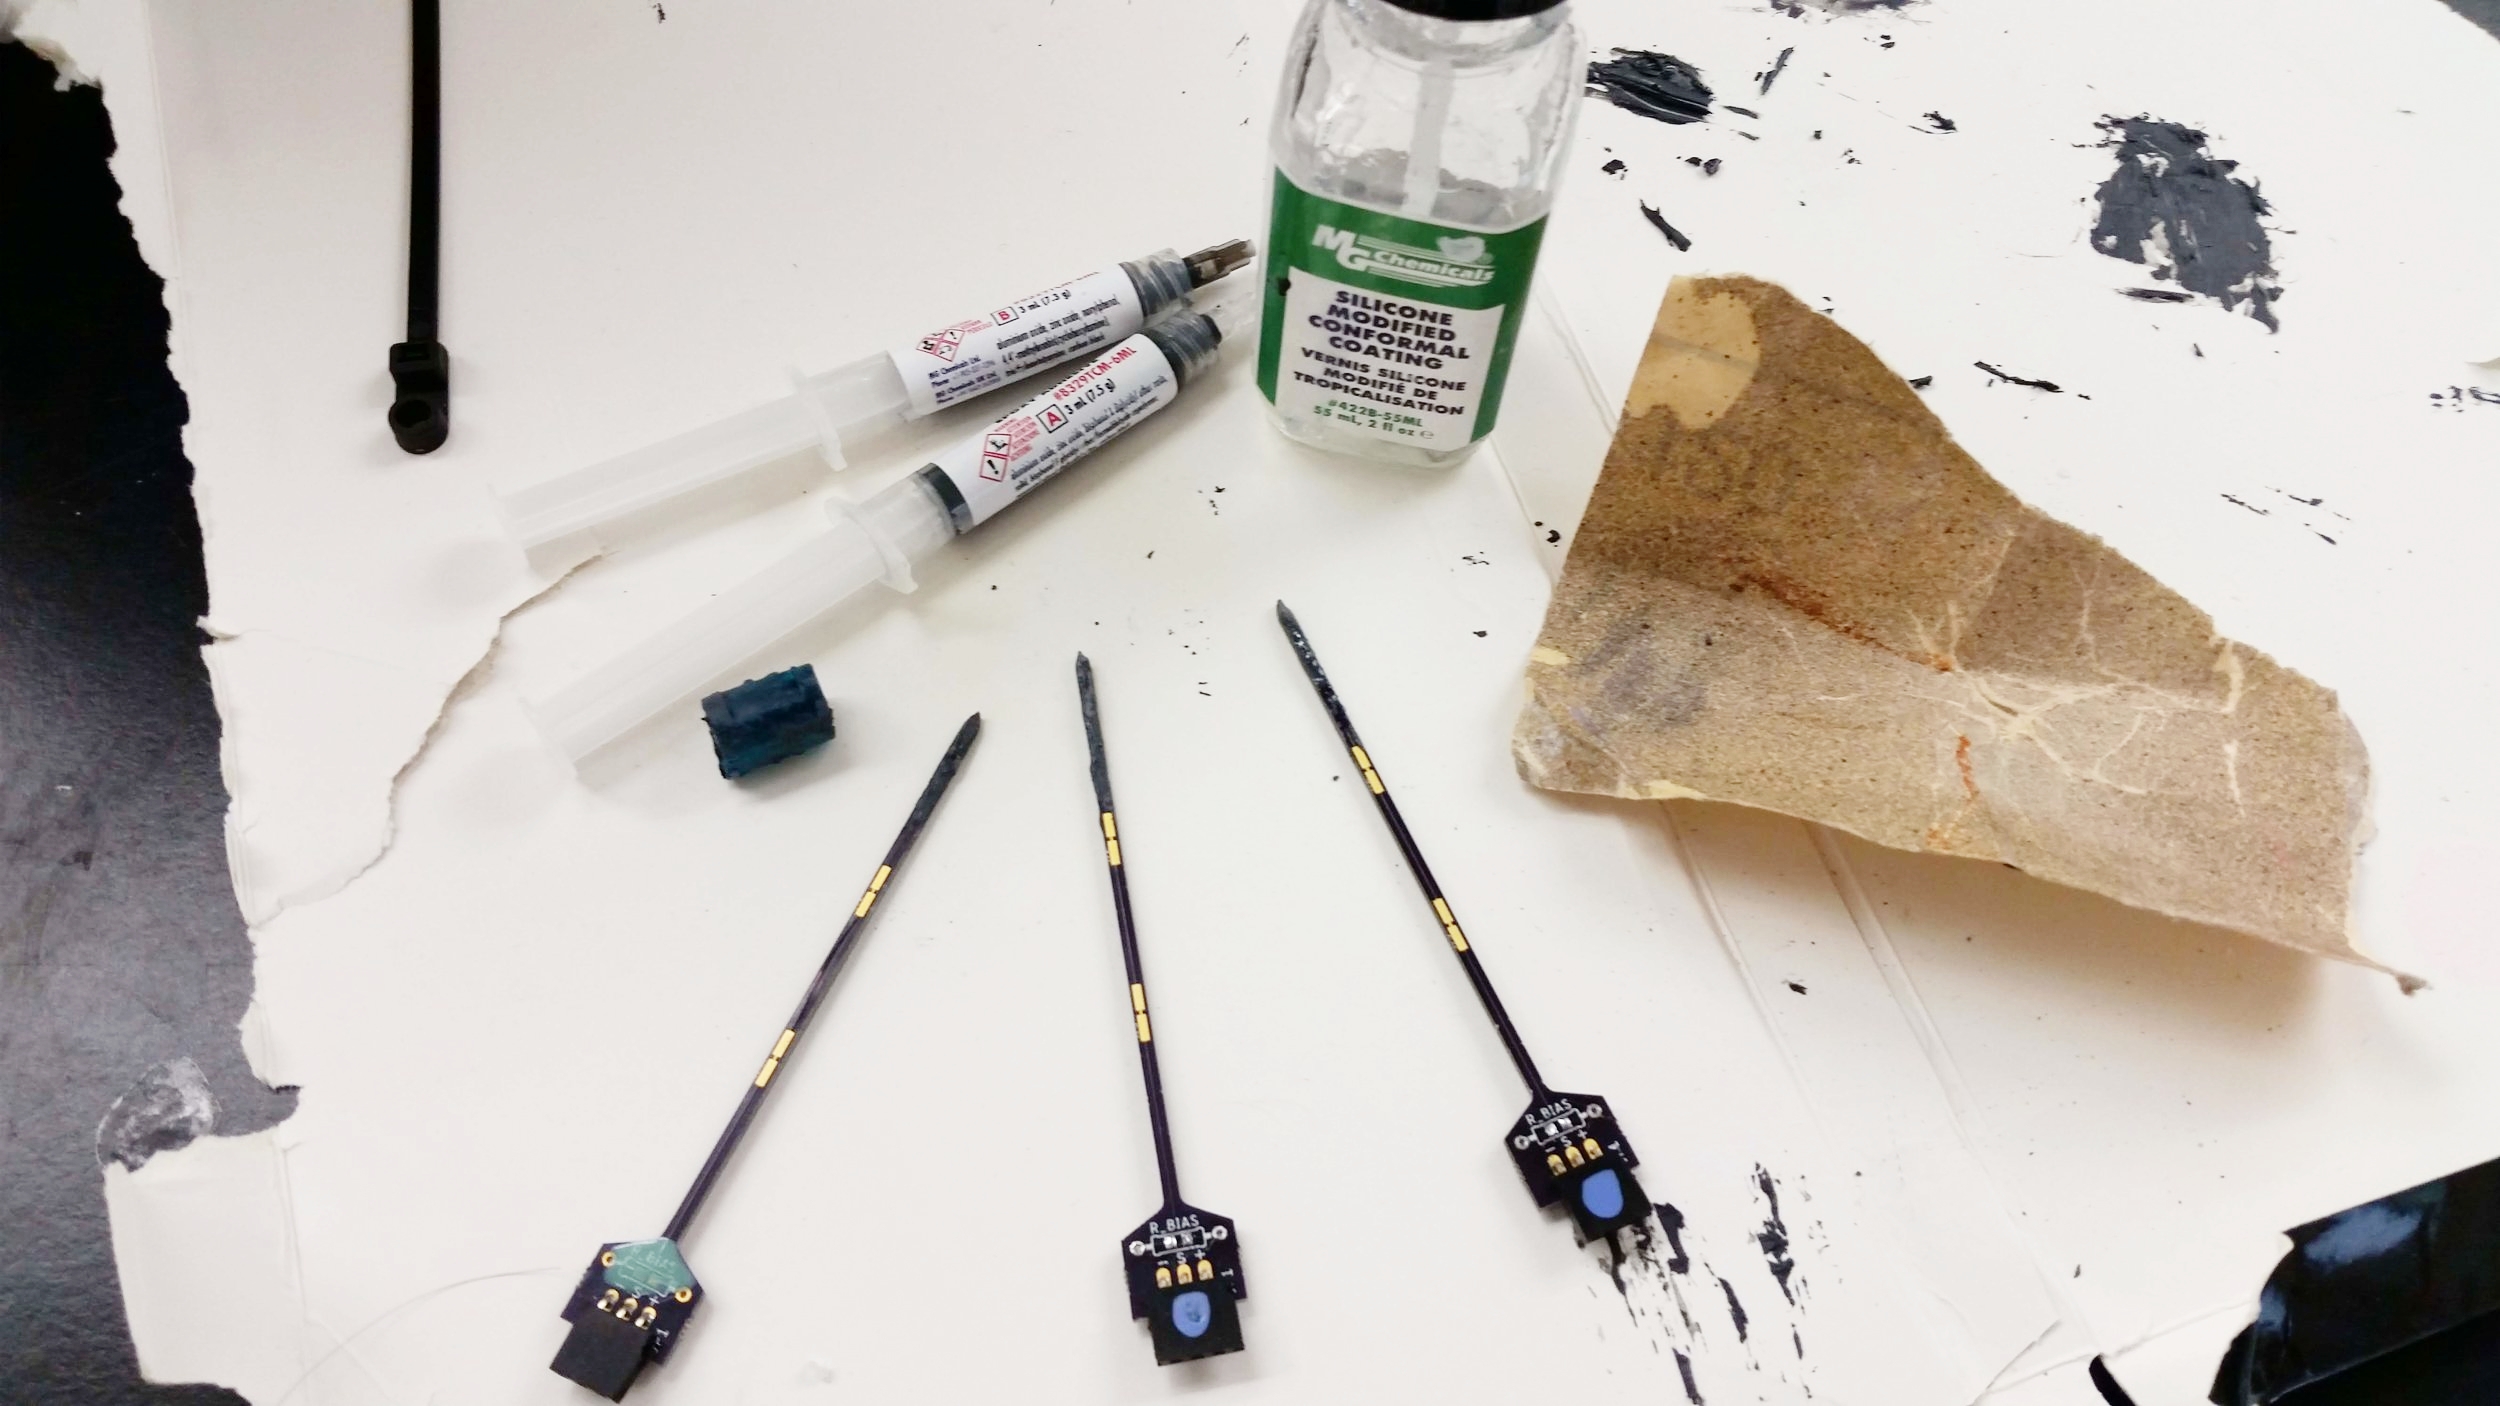
The next step involves the thermal epoxy. This is used in order to evenly spread out the effect of the heat pulse and to get better contact when inserted into a tree bore-hole. This is best applied using a 3D printed mold. Ideally, this would be printed on a high resolution SLA printer because of the small size of the mold. Formlab’s Form 2 was used to make the molds in the images; it provides up to 0.025 mm layer size. It’s also suggested that mold release spray be used on the inside of the mold to help the epoxy from sticking.
The epoxy in the BOM is a two part epoxy with a curing time of 45 minutes. To use, squeeze out equal parts from the A and B syringes and mix this well with a mixing stick before applying this to the inside of the mold. Put the mold on the tip of the probe so that the resistor is centered and press down. Gently wipe away any excess epoxy. Wait at LEAST 45 minutes before removing the mold, suggested overnight. Make sure that disposable gloves are used during this step.
After the epoxy is set, gently wipe with sandpaper to remove any major impurities. Next, coat the entire probe with silicone conformal coating with two coats, letting dry completely in between. This will seal the epoxy to prevent plant moisture from seeping in and changing the properties of the probe over time. It will also waterproof the rest of the board. Make sure to avoid getting and silicone in the connector.
Step 4: Wire Things Up
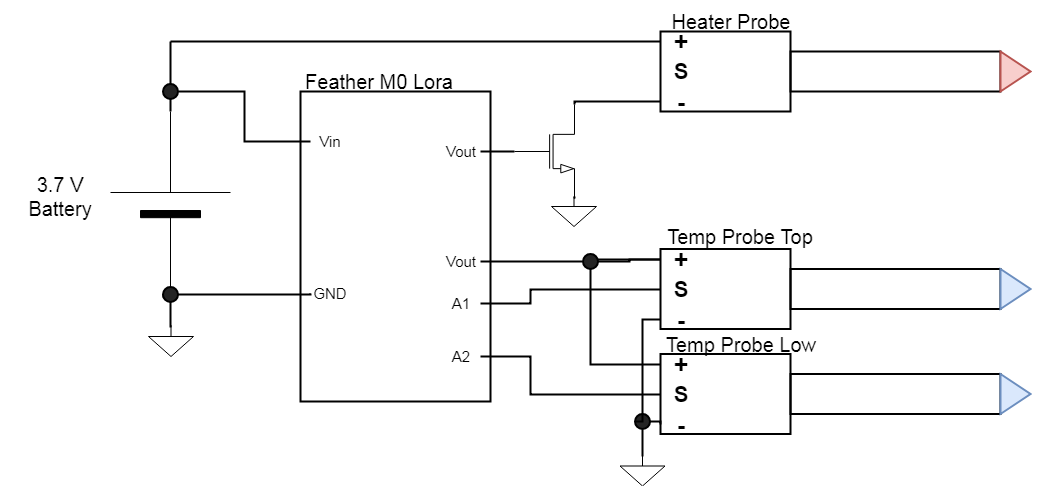
The probes should be wired to the board as shown to work with the current code.
This wiring diagram does not include the SD card that is included in the code. It should be hooked up as per this tutorial with the chip select pin on the SD board going to pin 9 on the Feather and the SPI pins going to the corresponding pins on the Feather M0 (SCK, MISO, MOSI).
If you’re feeling savvy, feel free to play around with what pins are used. It’s important that the probes output goes to an analog in pin on the M0 (A0 to A5 shown below). The trigger can be moved to any pin, provided that the code is updated to match.
The heater probes could be attached to the 3.3V output pin (identified by “3V”) in order to further stabilize the power delivered as battery voltage decreases as it dies but the 3.3V should always be the same. However, this would reduce the energy efficiency of the system as the 3.3V output pin goes through the M0’s internal voltage regulator which burns off the excess voltage as heat. Also, the 3.3V supply has a max supply of 500mA which is near the current draw of a single heater probe.
Pinout of Adafruit’s Feather M0 board. More information on the M0’s pins can be found on the Adafruit website at this link.
Step 5: Program the Microcontroller
The code for the basic program described in this build guide is posted at this link. A future blog post will walk through the important functions. Further in the future, a stand alone library and/or incorporation with project Loom is planned.
If you’ve never used an Feather M0 before, check out these two pages on Adafruit’s tutorial:
If you’ve never programmed in Arduino before (or ever), I would highly recommend reading though a few of the fundamental tutorial pages on the Arduino website until you grasp basic the basic concepts and idea of what Arduino is. Linked here.
Step 6: Install in Plant
This part of the process will change slightly based on what plant this is being installed into.
In order to to ensure that the probes are properly spaced, a 3D printed guide should be used. This version has a 7mm spacing between the probes. Future tests should test with different probe spacing. This doesn’t need to be as precise as the thermal epoxy mold; I used a Lulzbot Taz 5.
Insert the probes into their respective holes in the guide with the heater in the middle. Turn all of the PCB boards to face the thin side of the guide such that all the boards are parallel and facing to the same side (not up or down); this will help to deliver the heat pulse to the thermistors symmetrically. Optionally, use epoxy/superglue to fix them in place.
If you’re installing in a tree, holes will need to be drilled into the wood at a proper diameter (~2.75 mm) using an additional “guide”. As of now (6/11/2018) these have not been tested in a tree.
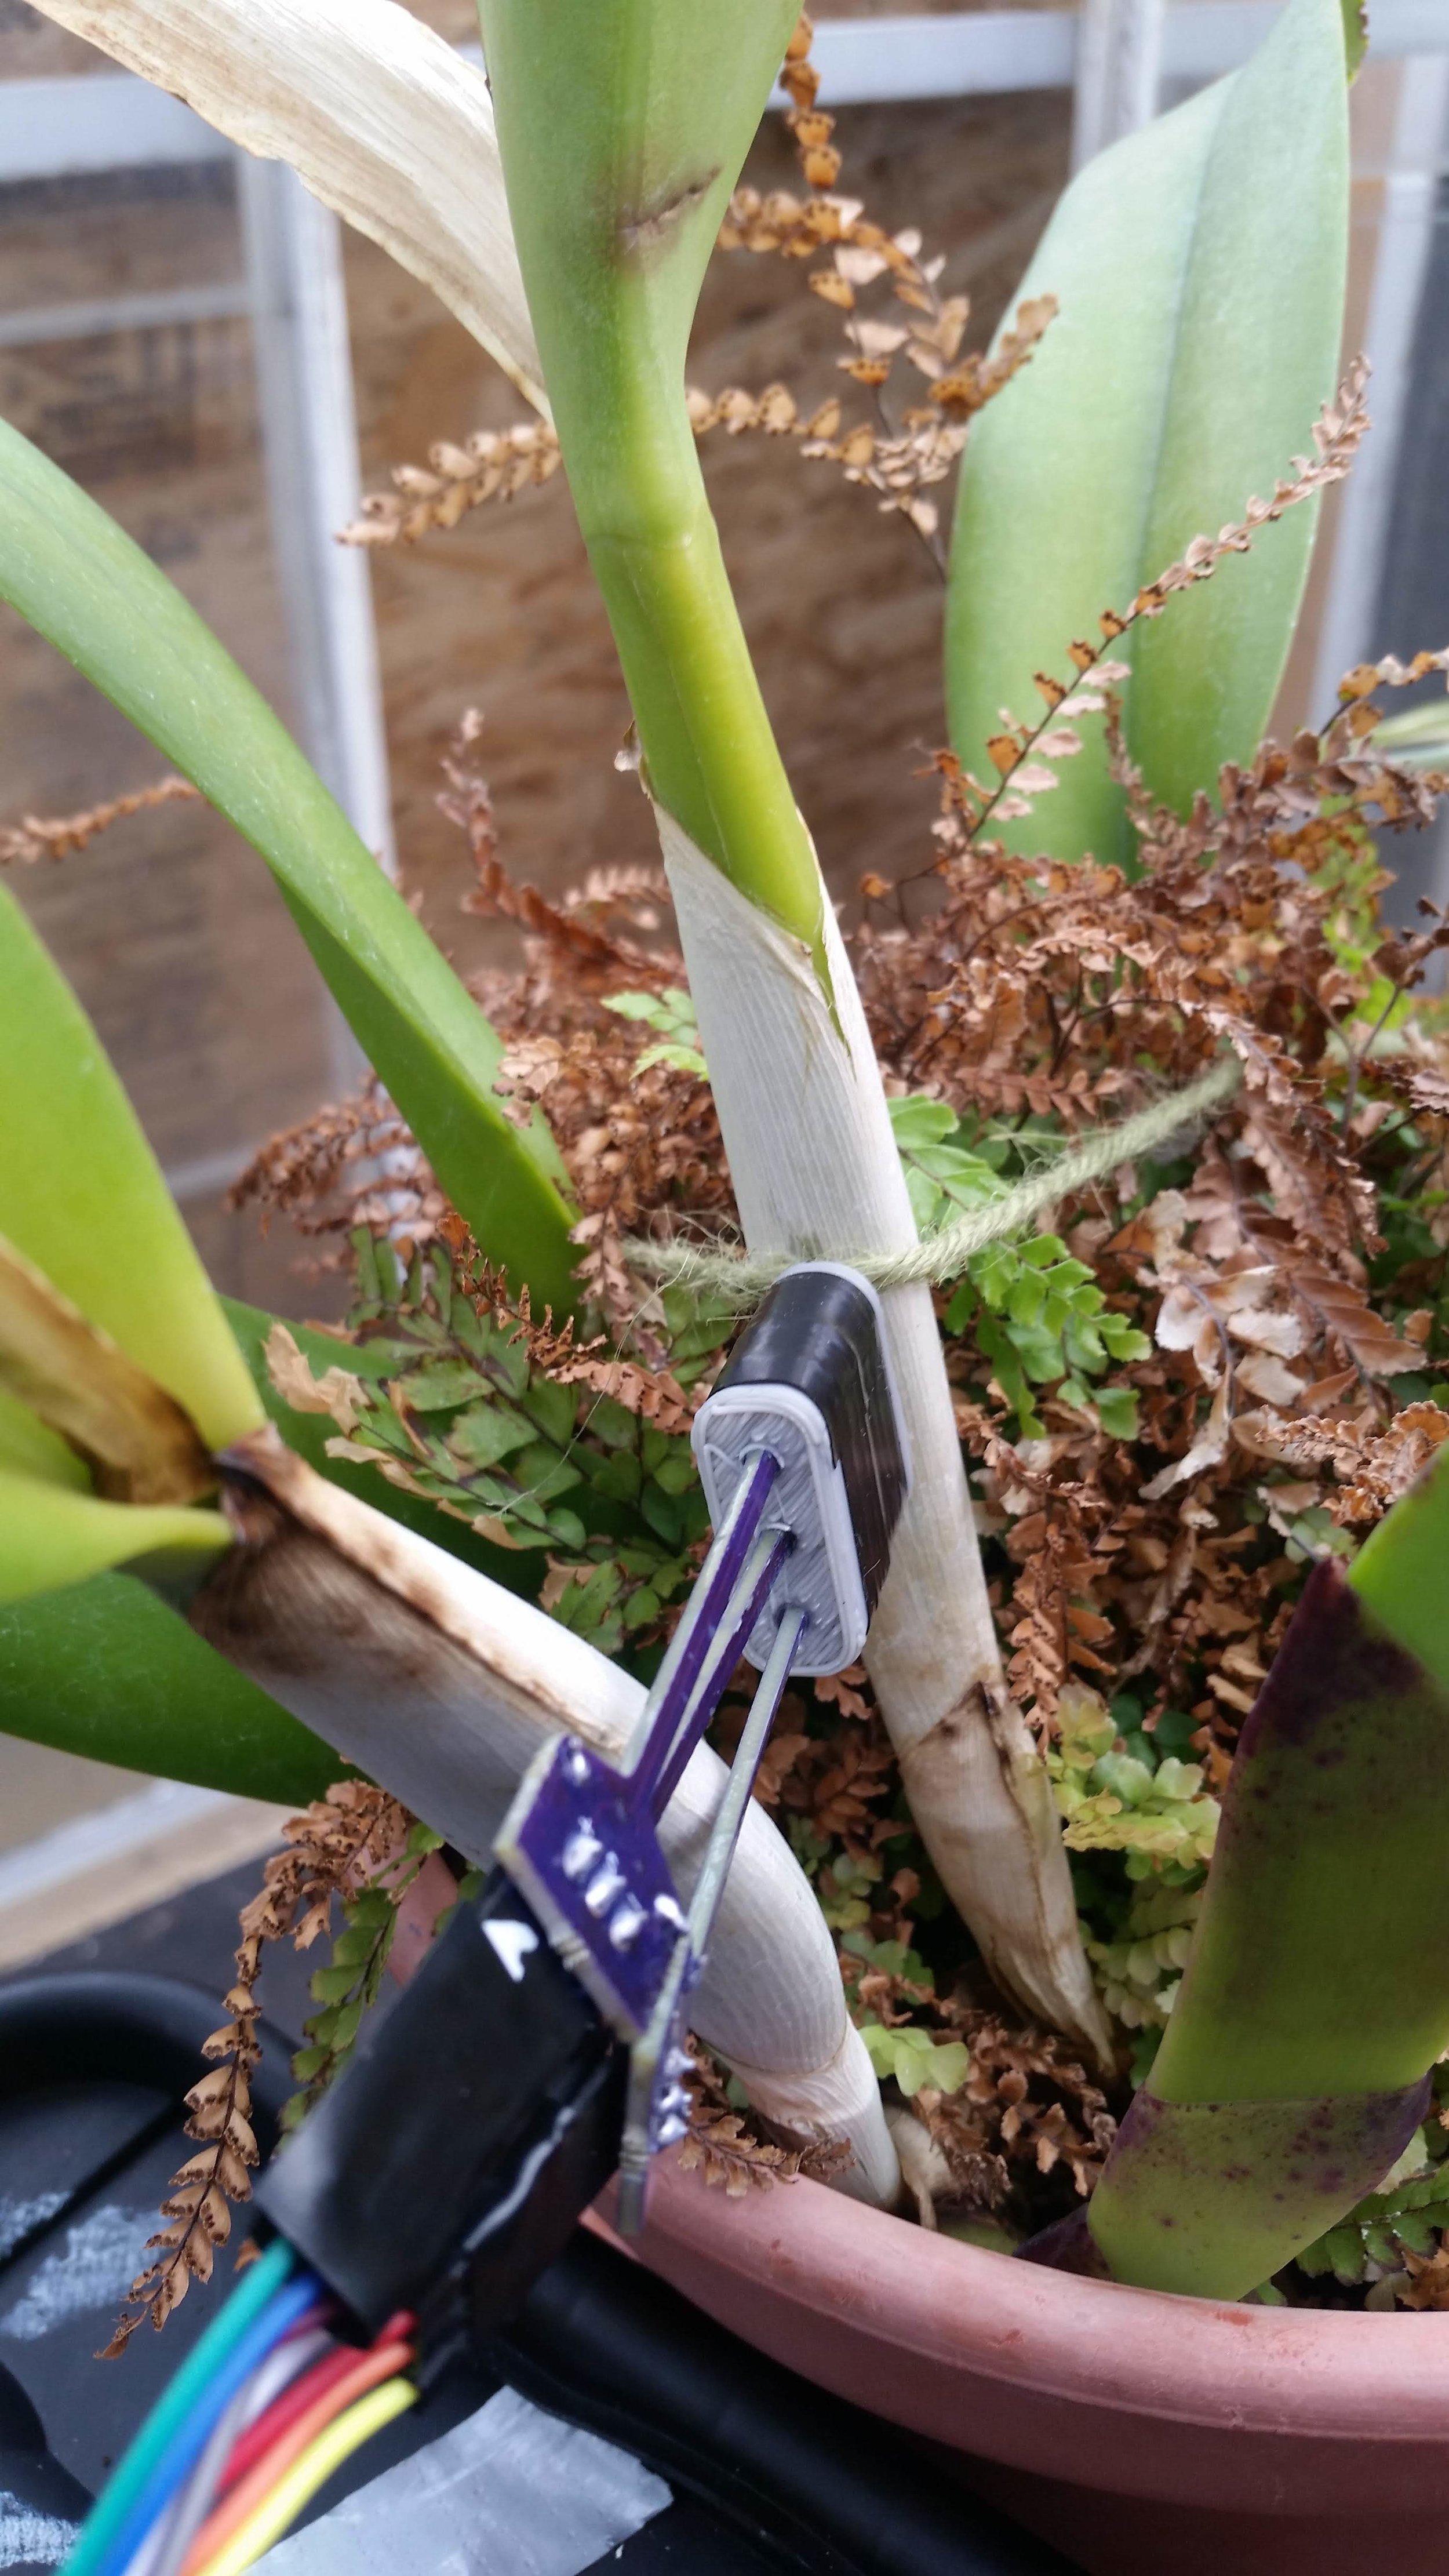
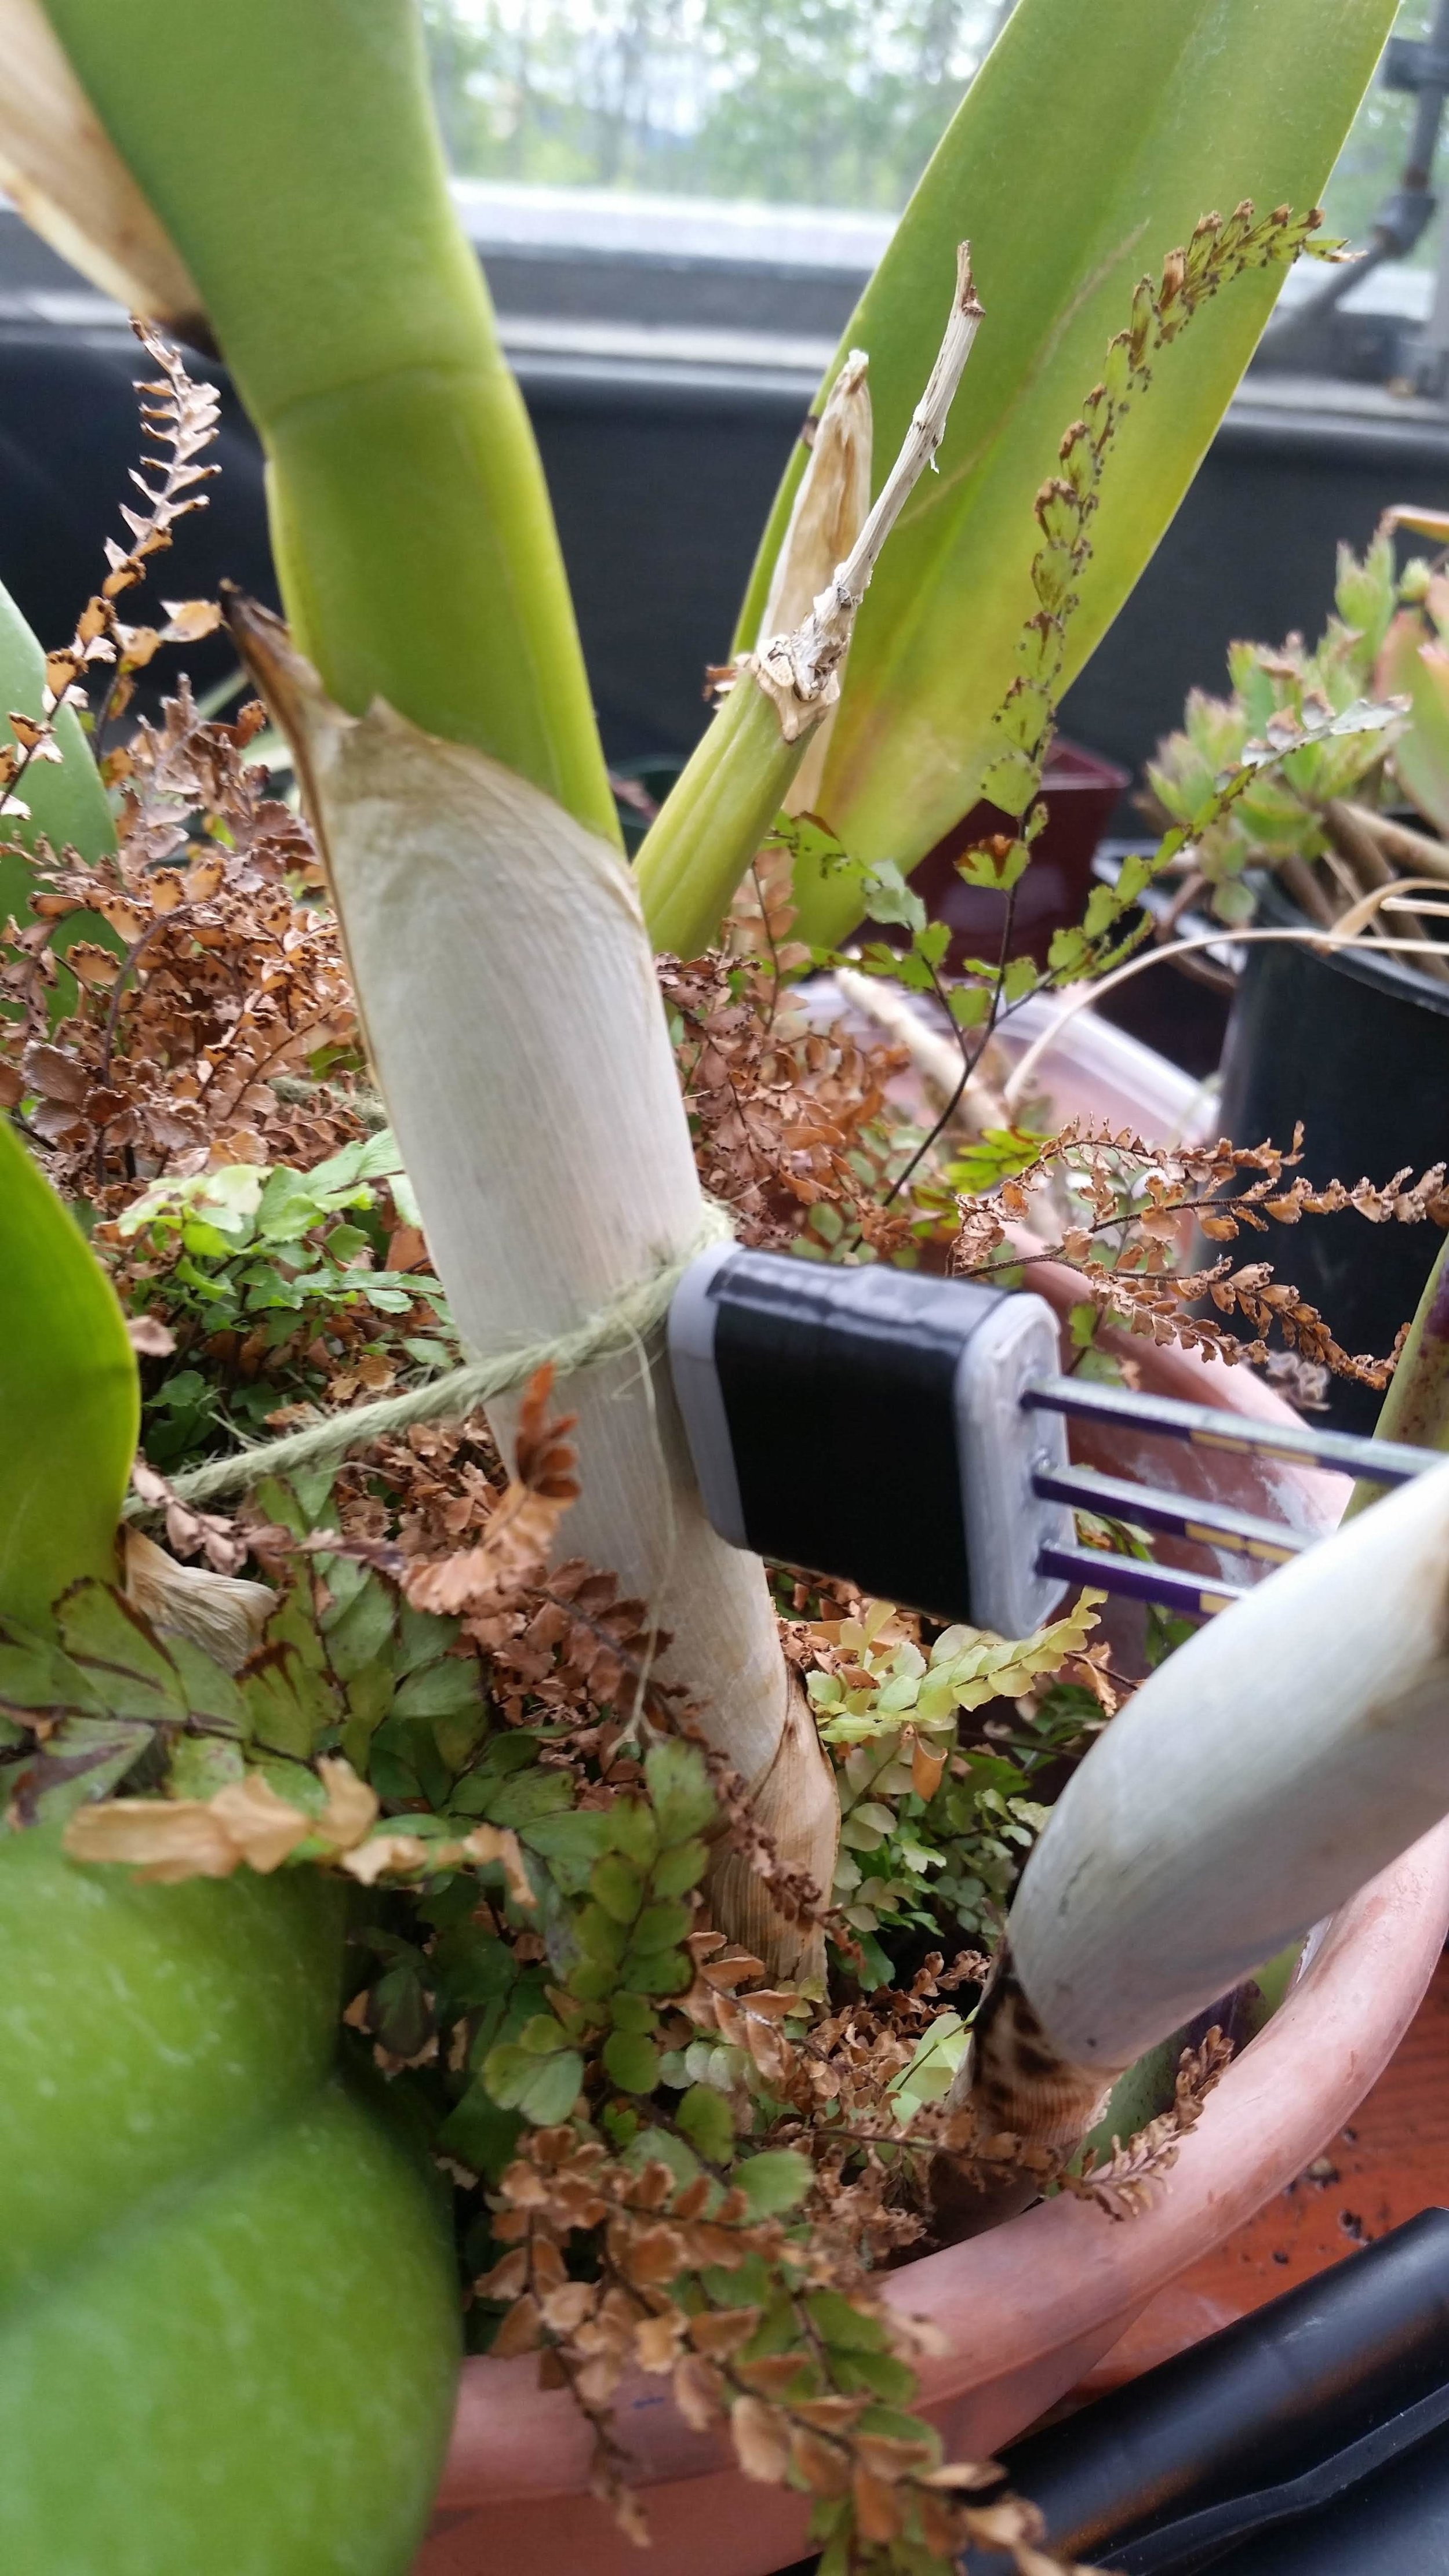
Probes installed in an Orchid. Notice the orientation of the probes, the pcbs are all facing the same direction.
Based on preliminary tests it should take about a day for the temperature to regulate and good data to start coming in. A later blog post will go into further detail on best practices for installing in different plants (especially trees) after some more tests are conducted. Potential things include: installing all probes in the north side of plants to avoid the sun (south if you’re on the wrong side of the world), filling any drill hole cavity with thermal grease via a syringe prior to inserting the probes (improve contact with the tree) and filling the end of the hold with putty/glue to seal it.
If you have any questions or suggestions for this design please please please reach out to me, Brett, at stoddabr@gmail.com. Happy building!
One metric for plant health is simply how “hydrated” the xylem is. This can be an indication of how much water the plant has been drinking and could change if it is living in a stressful environment.
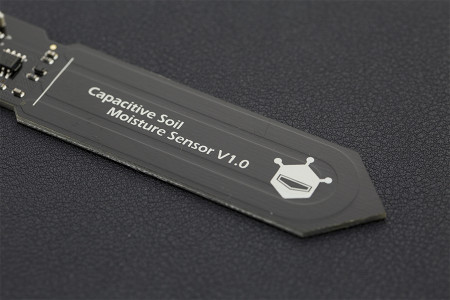
This sensor would be very similar to capacitance sensors used to measure volumetric water content (VWC) in the soil. An open sourced implementation of that is the Gravity Capacitance Soil Moisture Probe which is from DFRobot. It uses the TLC555I pulse generator to generate a signal which passes through a transmission line (on a pcb) that is immersed in the soil. Depending on the VWC of the water, the properties of that embedded transmission line changes.
Image of the Gravity SM Probe. Notice the transmission line going around the edge of the sensor. A thinner version could be implanted in a tree to determine “hydration”.
For the tree implementation, the transmission line would go along a probe similar to the one used for the thermal sap flow sensor.
By far the most annoying part of designing a thermal sap flux probe sensor is the “thermal” part. Without a proper heat pulse, there is no sensor. The problem is generating heat requires raw energy. According to my calculations, the heater makes up ~99% of the total energy requirements for this sensor. One of the goals of this project is to make the sap flow sensor as energy efficient as possible which will require a lot of testing to find the most efficient way to send out a heat pulse.
The Knobs
To find that maximum efficiency, there are a couple of design “knobs” that can be adjusted to find the maximum efficiency. Unfortunately, due to the short amount of time on this project, not all of these are going to be tested. Here is a list with what I believe are going to be the most important factors first:
Energy Delivered (joules)
Time of Pulse (second)
Depth into Tree (inches from the edge of the tree’s cambium)
There’s a possibility that a “wrap” sensor could be possible like Dynamax’s Dynagague which uses thermojunctions on a flexible PCB
Size of the Probe
The *IDEAL* Physics
I’ve put together a simple spreadsheet of a few different heater resistance values. Since this sensor is primarily being designed to integrate into other OPEnS Lab projects (namely the Evaporometer) a 3.7 voltage supply is assumed (uses 3.3V logic but runs off of a 3.7V battery, the heater will draw power from the battery).
One thing that should be noted when finalizing the resistance: the wattage rating for the resistor. There exists a lot of SMT resistors on the market, Digikey lists near 50 thousand, however, only a small minority possess the wattage requirements to provide that much heat (this can be seen in the “wattage” column of the attached table). If a resistor is chosen that does not satisfy the wattage requirements it will most likely fail. If a specific resistance is desired that is not available at this wattage, two identical resistors can be placed together in series, essentially halving this wattage requirement.
The temperature delta was calculated assuming that the heat capacitance of sapwood is 8 joules/C. This is an estimation.Further research into the exact heat capacitance of sapwood should be conducted.
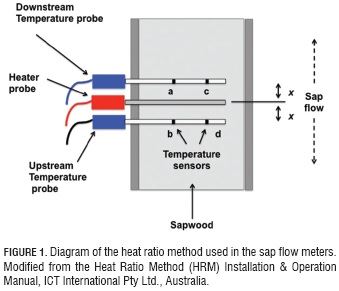
Thermal sap flux (or flow) sensors have been popular amongst environmental sensing experts since the mid-20th century. They measure the velocity of sap through the stem or trunk of a plant using an array of heaters and temperature sensors.
A modern sap flow variant, proposed by Grainer, is made up of two temperature sensing probes directly above and below a heater probe—all spaced evenly. When a measurement is taken, the heater probe turns on and emits a heat pulse for several seconds. Then the temperature difference between the upper and lower probe is recorded. The temperature difference over time can be used to track sap flow (the specifics of this will be talked about in a later blog post).
To construct a sap flux sensor using surface mount technology (SMT) which can be manufactured using an entirely automated setup given a pick-and-place machine but can still be made by hand by a person with adept soldering skills.
Challenges
The biggest challenge for this project is minimizing the width of the probes. Inserting any foreign object into the xylem of any plant will alter how sap flows through it. As such, minimizing the size of the probe is critical to accurate measurements. Current commercial probes have diameters of around 1.5mm (http://dynamax.com/products/transpiration-sap-flow/tdp-sap-velocity-thermal-dissipation-probe).
Limitations in commercial PCB etching process are a limiting factor in the minimum size of these probes. Also, if a sufficiently small probe size is achieved, the number of plant types this can be used on increases. For example, a large probe may only be used on trees of a sufficient diameter while a smaller one could be used on crops such as corn.
For the temperature sensor probe thermistors were chosen to be the sensor component. Thermistors were chosen because of their high level of sensitivity when compared to other sensors. Thermistors act as variable resistors that alter their resistance based on their temperature. The main drawback to using thermistors is that their output is not linear, but rather follows a logarithmic curve and so they are difficult to work with. For this probe, a voltage ladder was used to retrieve the resistance of the thermistor as shown in the schematic in the results section.
The heater element consists of a 50 ohm, US0603 footprint resistor with a 0.38 wattage rating. A future blog post will go more in-depth on how the resistance was calculated.
To maximize contact with the plant’s xylem, thermal epoxy was used in a mold around all three PCB probes. This was designed in SolidWorks 2017 and printed on a FormLabs Form 2 SLA printer for maximum resolution. The inside of this mold was coated in mold release spray to prevent the thermal epoxy from sticking to it. After the epoxy was sufficiently dried, a layer of silicone conformal coating was applied to waterproof each of the probes.
To control the sensor, a microcontroller with built-in ADC’s (here an Adafruit M0 Trinket) was used. The output pins on the temperature sensors were connected to the analog inputs of the microcontroller. An NPN transistor sat between a voltage source and the heater and was controlled by an output pin on the microcontroller.
Results
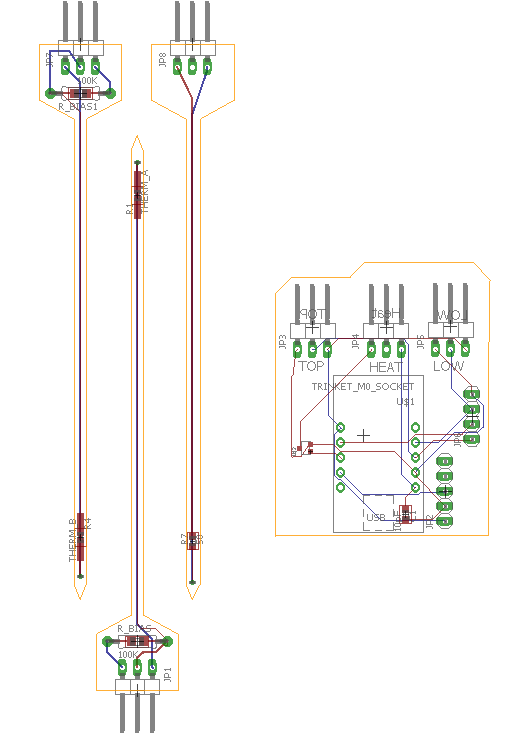
Images of the final PCB are shown below. It uses standard US0603 footprint resistors.
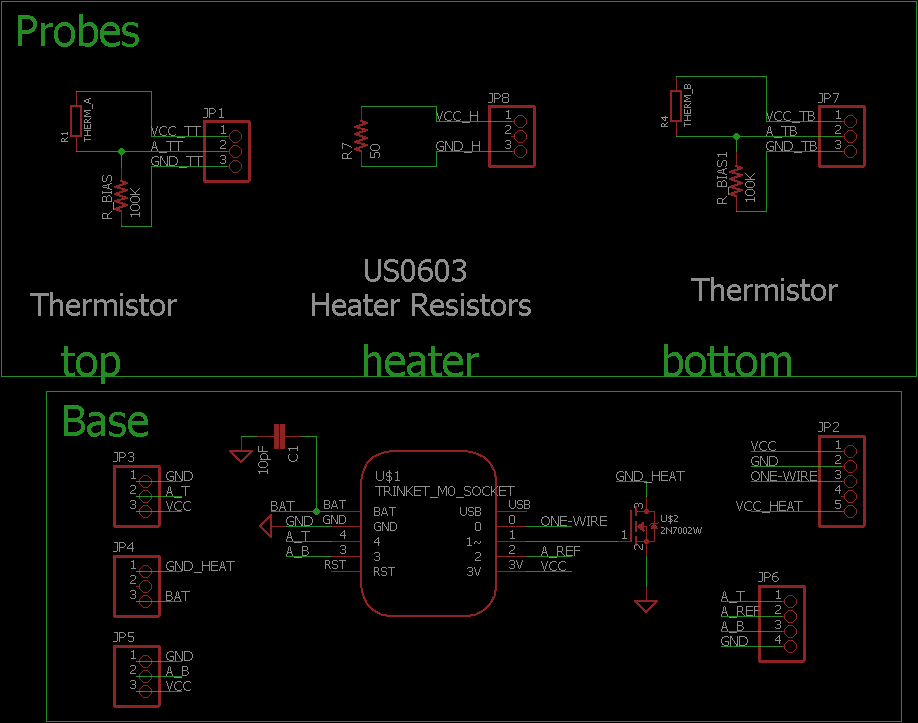
Schematic of the Sap Flow/Flux sensor with thermistor temperature sensors.
Image of the board design for Sap Flow sensor with thermistor temperature sensors. The two probes on the left are the thermistors and the one on the right is the heater probe. The PCB on the right houses an Adafruit M0 Trinket.
The bill of materials used is below.
A future blog post will go into a more detailed, step-by-step tutorial on how to build your own! It will also have finalized design files and best pracitces.
Room for Improvement
As with any project design, there are a multitude of ways that this could be improved. A few ideas with good potential are listed below in no particular order:
Linearizing voltage output using a parallel thermistor configuration
A/D conversion on the probe sensor to avoid signal loss across the line
Housing to protect the temperature probes from solar radiation
Insulation to protect the probes from ambient temperature fluxes
To test the probe described in my previous blog post, I deposited the probes in a banana plant I had handy.
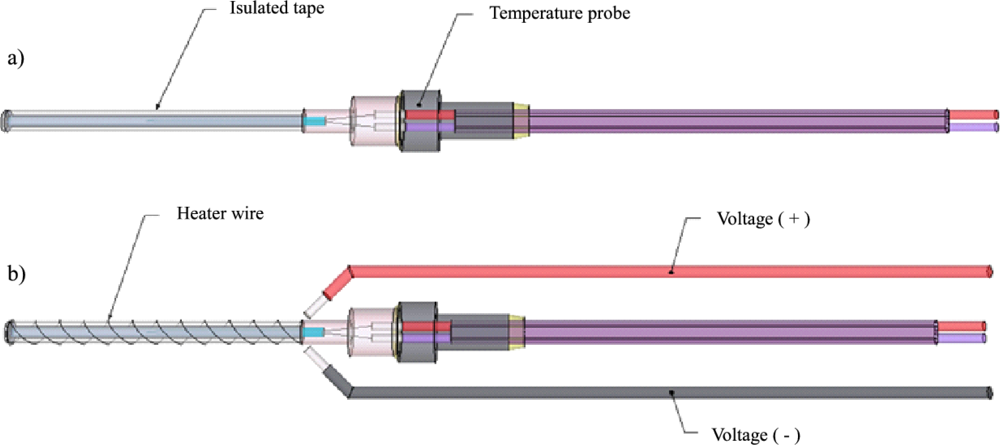
How I built the probes by inserting heater wire and type T thermocouples into hypodermic needles. More resources can be found in my last post and in the following paper by Davis et al. Post here. Paper here.
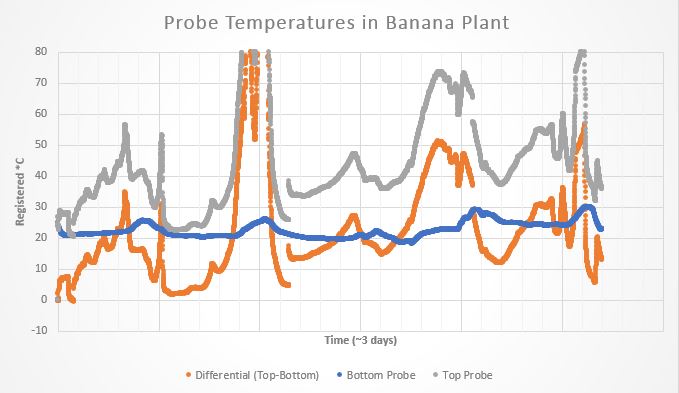
The graph result of the test is below:
As you can see, the top probe was not reading the correct temperature. This was probably an issue with the accuracy because it remained surprisingly precise meaning that the results shouldn’t be completely discarded. Daily trends are evidence that the sensor could be working somewhat. This is nowhere near the accuracy I intend to get with my final design.
However, there definitely is something interesting going on here. The data was recorded over an interval of three days. Examining the Differential plot, there seem to be roughly three major up-and-downs that PROBABLY are related to the day-night cycles of photosynthesis.
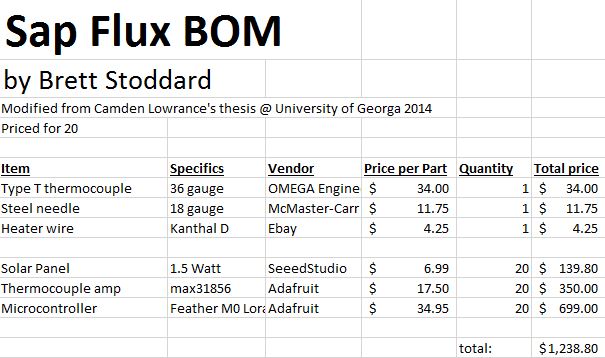
Before I got started designing the SMT sap flow, I built and tested the probe sap flow sensor popularized by Grainer. This design popular with researchers probably because of its inexpensive BOM ( ~$10/sensor ) and promisingly low labor ( 1 hour/sensor ) which puts the total price at ( ~$60/sensor ).
When I replicated several of these probes I found significant difficulty in making them. The 36 gauge wires are especially difficult to work with and the nichrome wire heater probe was almost impossible to wind to a high enough resistance. For the 7 I built, only 2 were usable enough to record meaningful data. This is not a process I would recommend to anyone.
The biggest difference is that I used a thermocouple amplifier chip instead of building my own. This greatly simplified the design and made fabrication a lot easier. I chose an Adafruit Universal Thermocouple Amplifier MAX31856 Breakout board. I made sure to set it to the Type-T setting. Adafruit has an excellent guide on how to use one of these on their website here.
Thermal sap flow sensors were initially proposed in the paper [German paper] in [date of german paper] by [german paper author]. Since then, several key improvements have created a sensor that semi-popular amongst researchers. However, their current high price point has reduced adoption.
A good case study for the modern state of commercial thermal sap flow sensors is Dynagague. Their probe style sap flow sensor which costs around $300-500 for a single sensor and an additional cost of ~$400 for the datalogger.
By using a few tricks in the design, we at the OPEnS Lab in contribution with [Friend of Trees] hope to design a sap flow sensor that costs less an $100 to produce including labor (priced at $50/hour) that meets the same performance at Dynagague. I plan to do this by redesigning almost everything to incorporate modern SMT manufacturing techniques open sourced communication protocols.
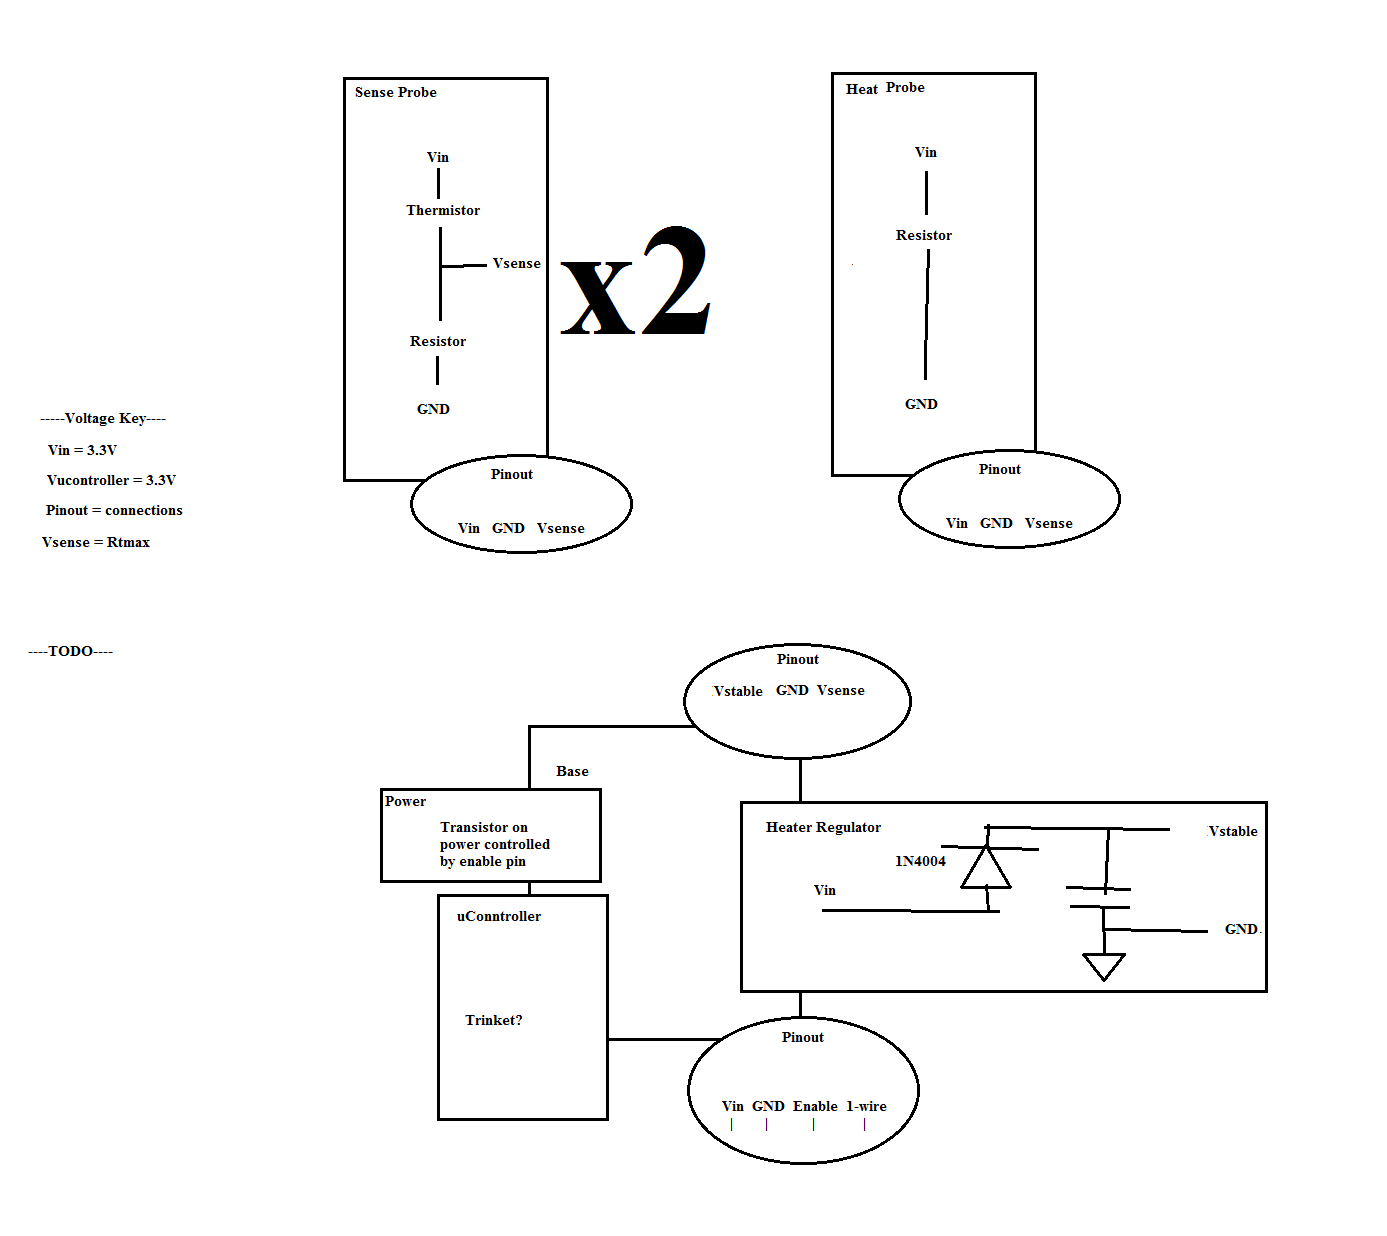
Here is an image of the rough schematic for the build.
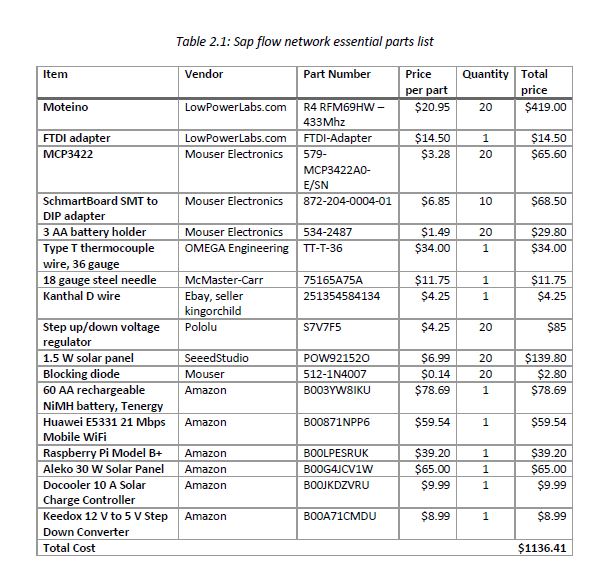
This is the BOM for the first draft design. The raw eagle design documents can be found at [https://github.com/stoddabr/sapflow/tree/master].
To open them you will have to download my parts library from [https://github.com/stoddabr/EaglePCB].

 The trend of this data is consistent and promising!
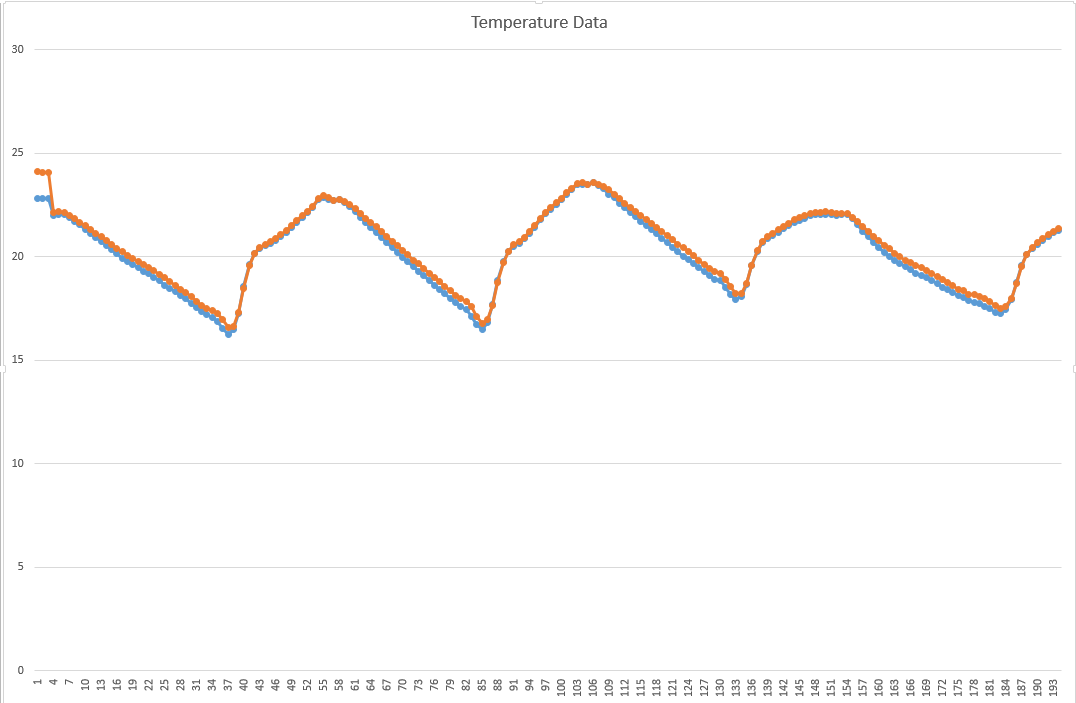 This plot shows all of the data points we measure on our HRM test. The y-axis is degrees Celsius. Because we collected data every 15 minutes during this test, the x-axis is time, and represents X*(15 minutes)
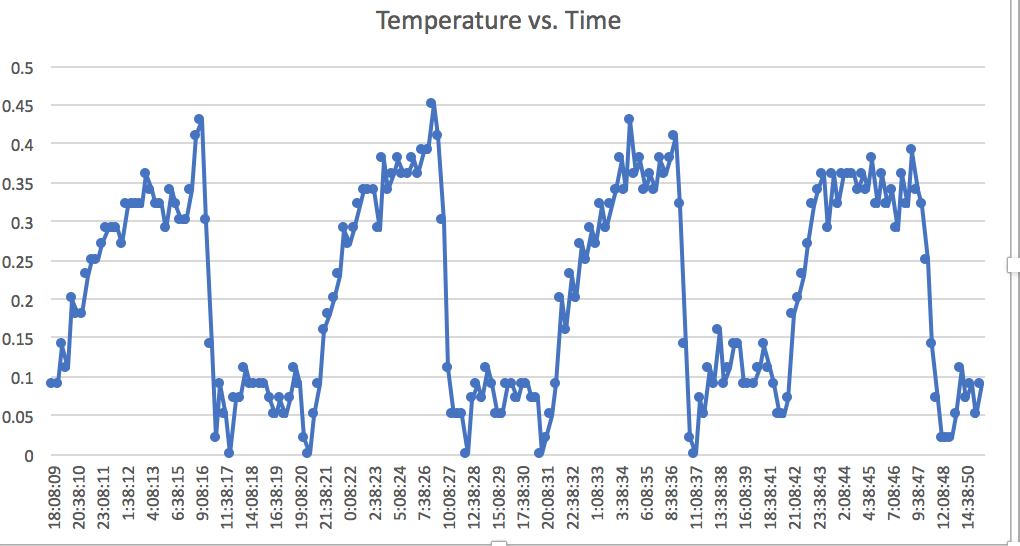 Here we have the difference between the temperatures of the two probes you see in the first graph. The y-axis is still in degrees Celsius and the x-axis shows time of day.
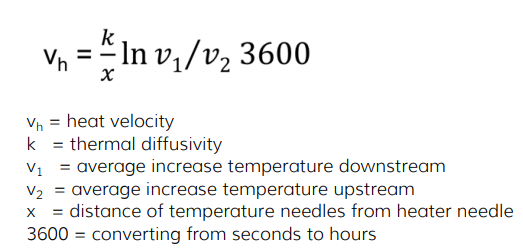
 Our TDM probe prototype in the wild cherry tree! (8/03/2018)
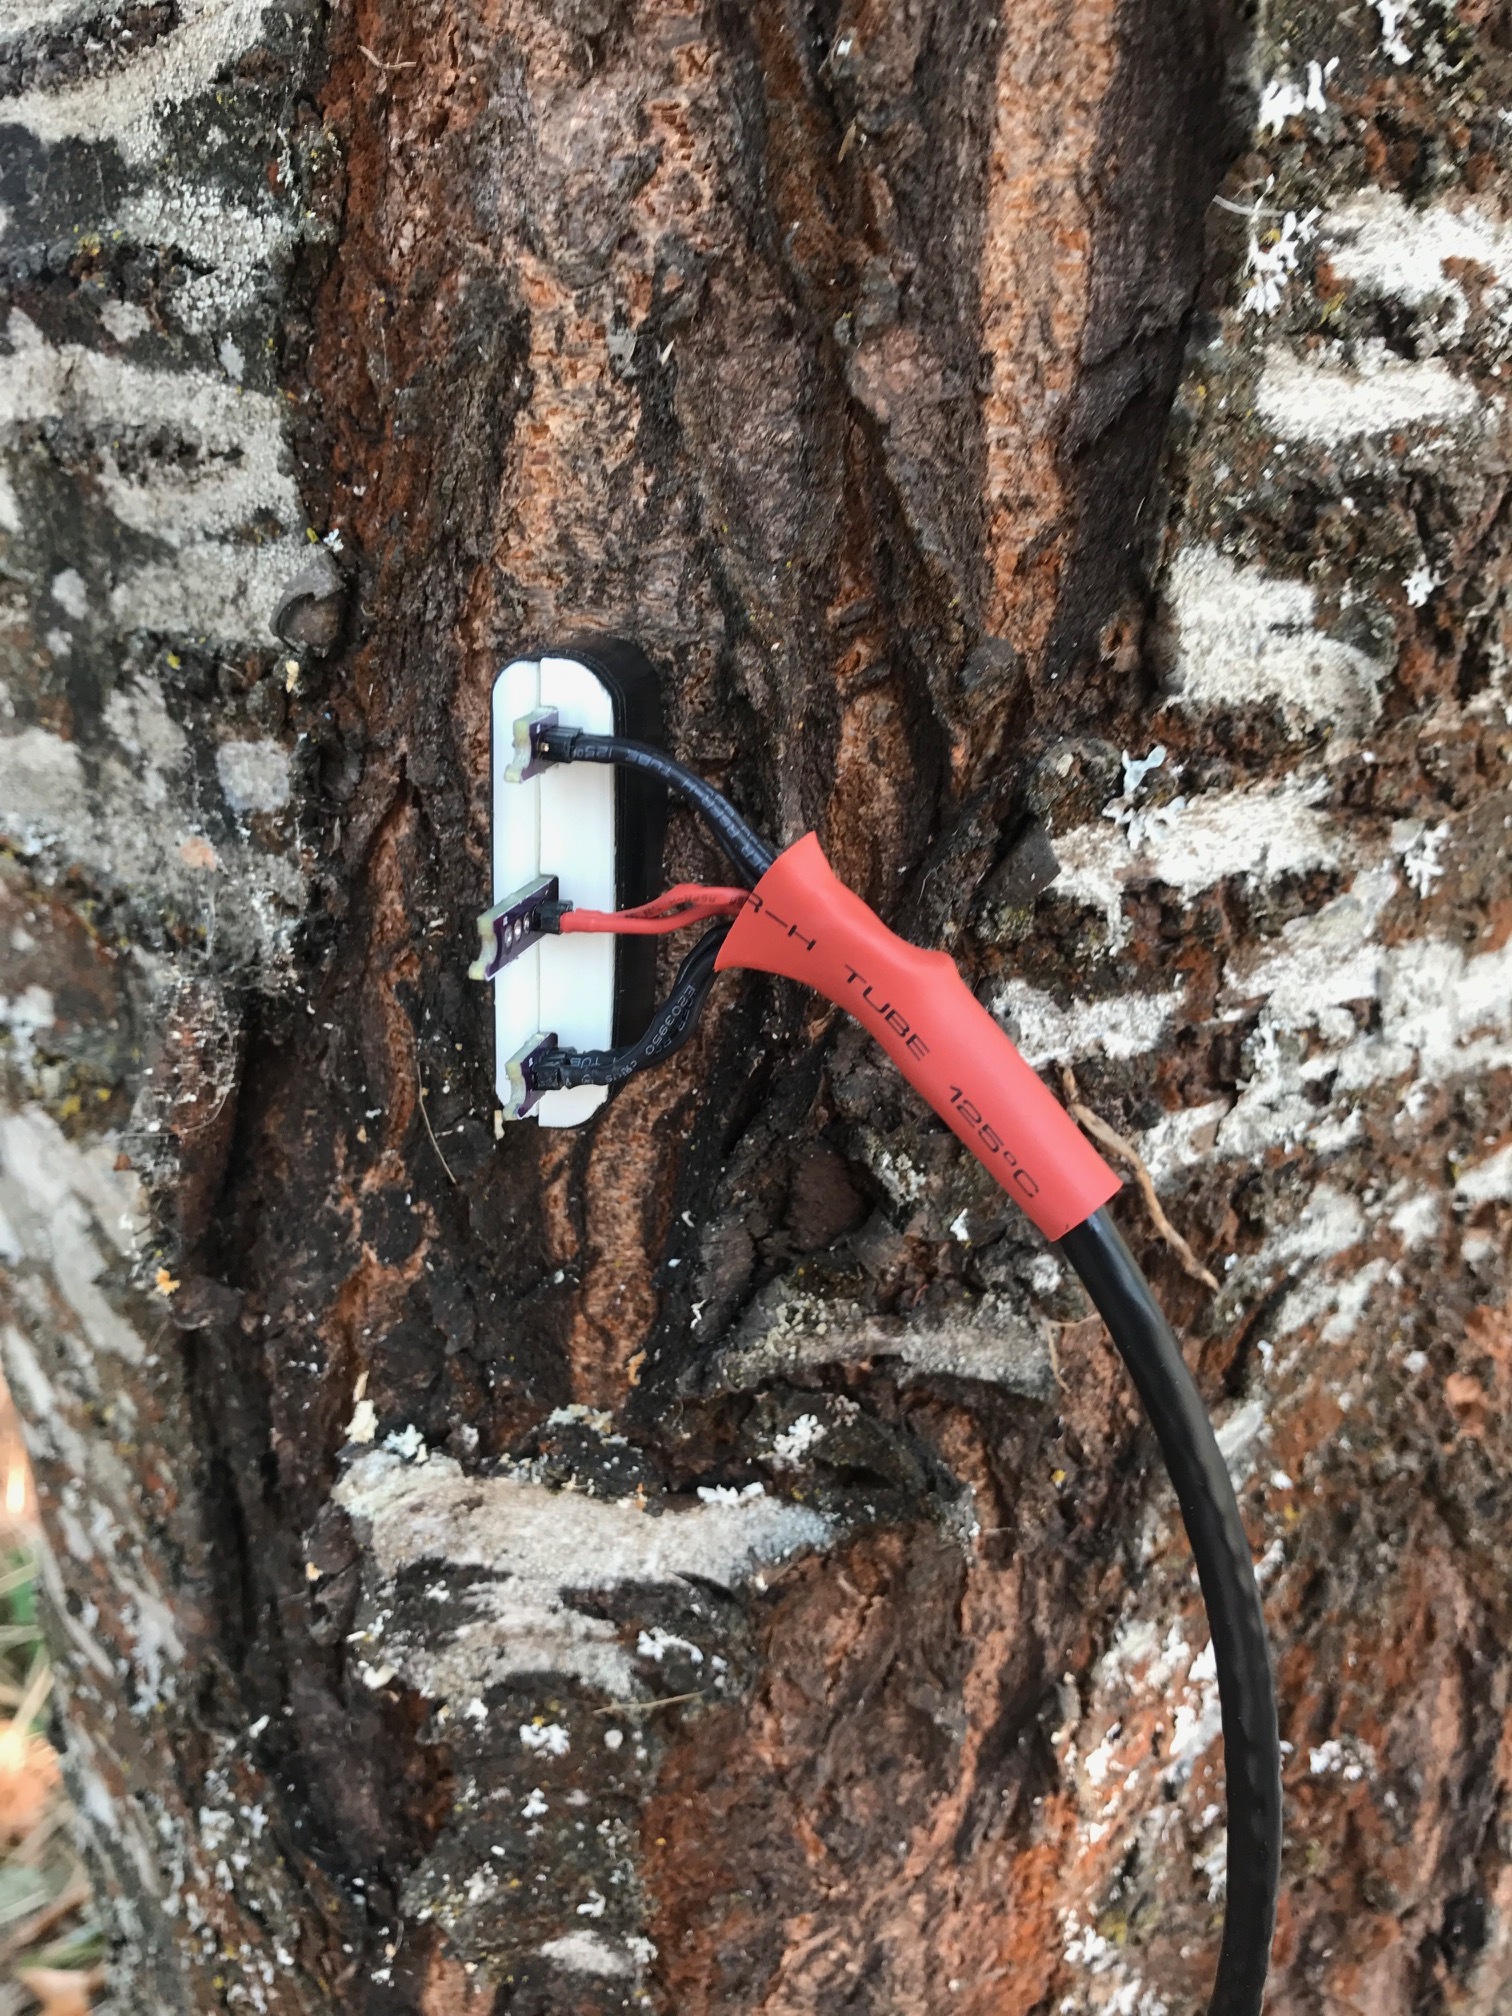 Our HRM probe prototype in the wild cherry tree! (8/16/2018)