
By: Brett Stoddard
Plant Data!
Design
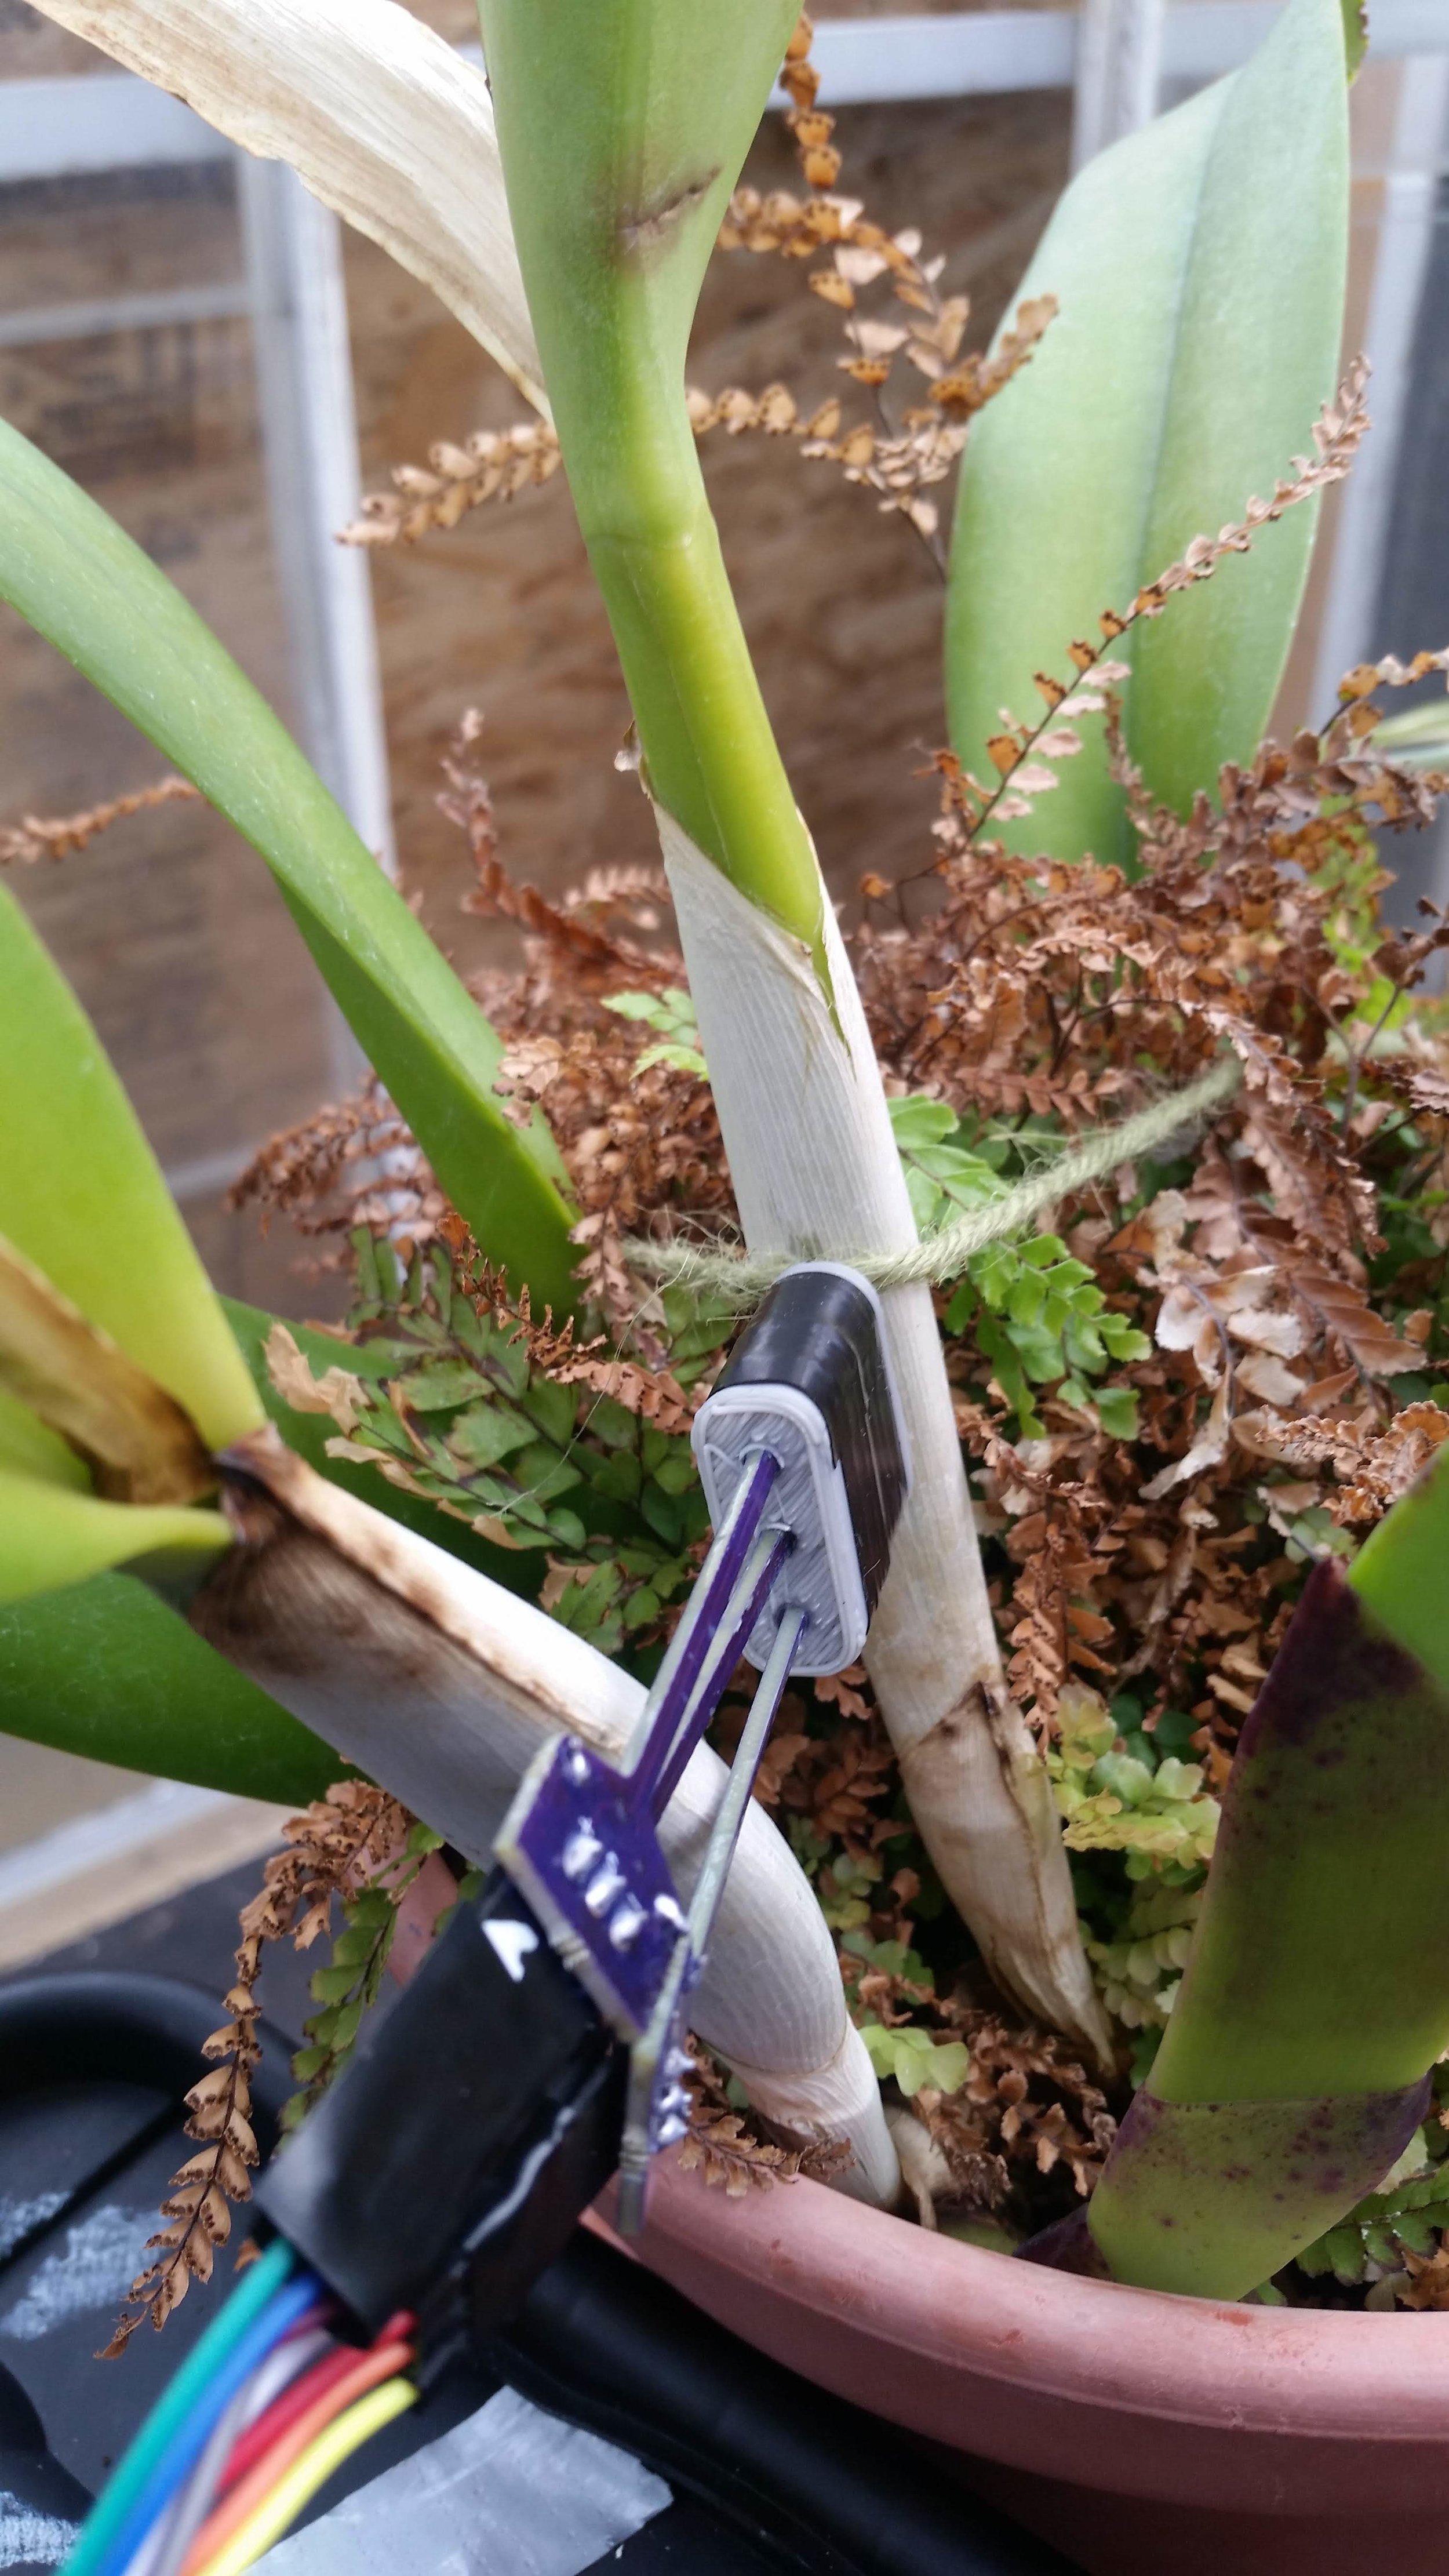
A probe was built as described in this build-guide. The following data was returned from the sensor.
Methods
An Adafruit Feather M0 with Lora capabilities was used to take measurements from the sap flow sensor. It activated an NPN mosfet that was connected in series with the +battery the heater probe and ground (or -battery).
Analog values were recorded by the board’s dedicated analog in pins. As per default, these readings were 10-bit although the M0 chip has the capability to do 12-bit ADC (detailed in this link). This would increase the theoretical precision four-fold and is something that should be investigated in the future. These raw values were logged onto an SD card. The electronics were run off of a 4AH battery until it died (after around days).
Additionally, an Adafruit SHT31-D breakout board was wired up and placed in the enclosure to provide ambient temperature values that also recorded day-night cycles.
In order to make the setup water resistant, electrical tape was wound around any electrical connections, the probes were covered in silicone conformal coating, and the microcontroller and battery were placed in a waterproof box, the DriBox.
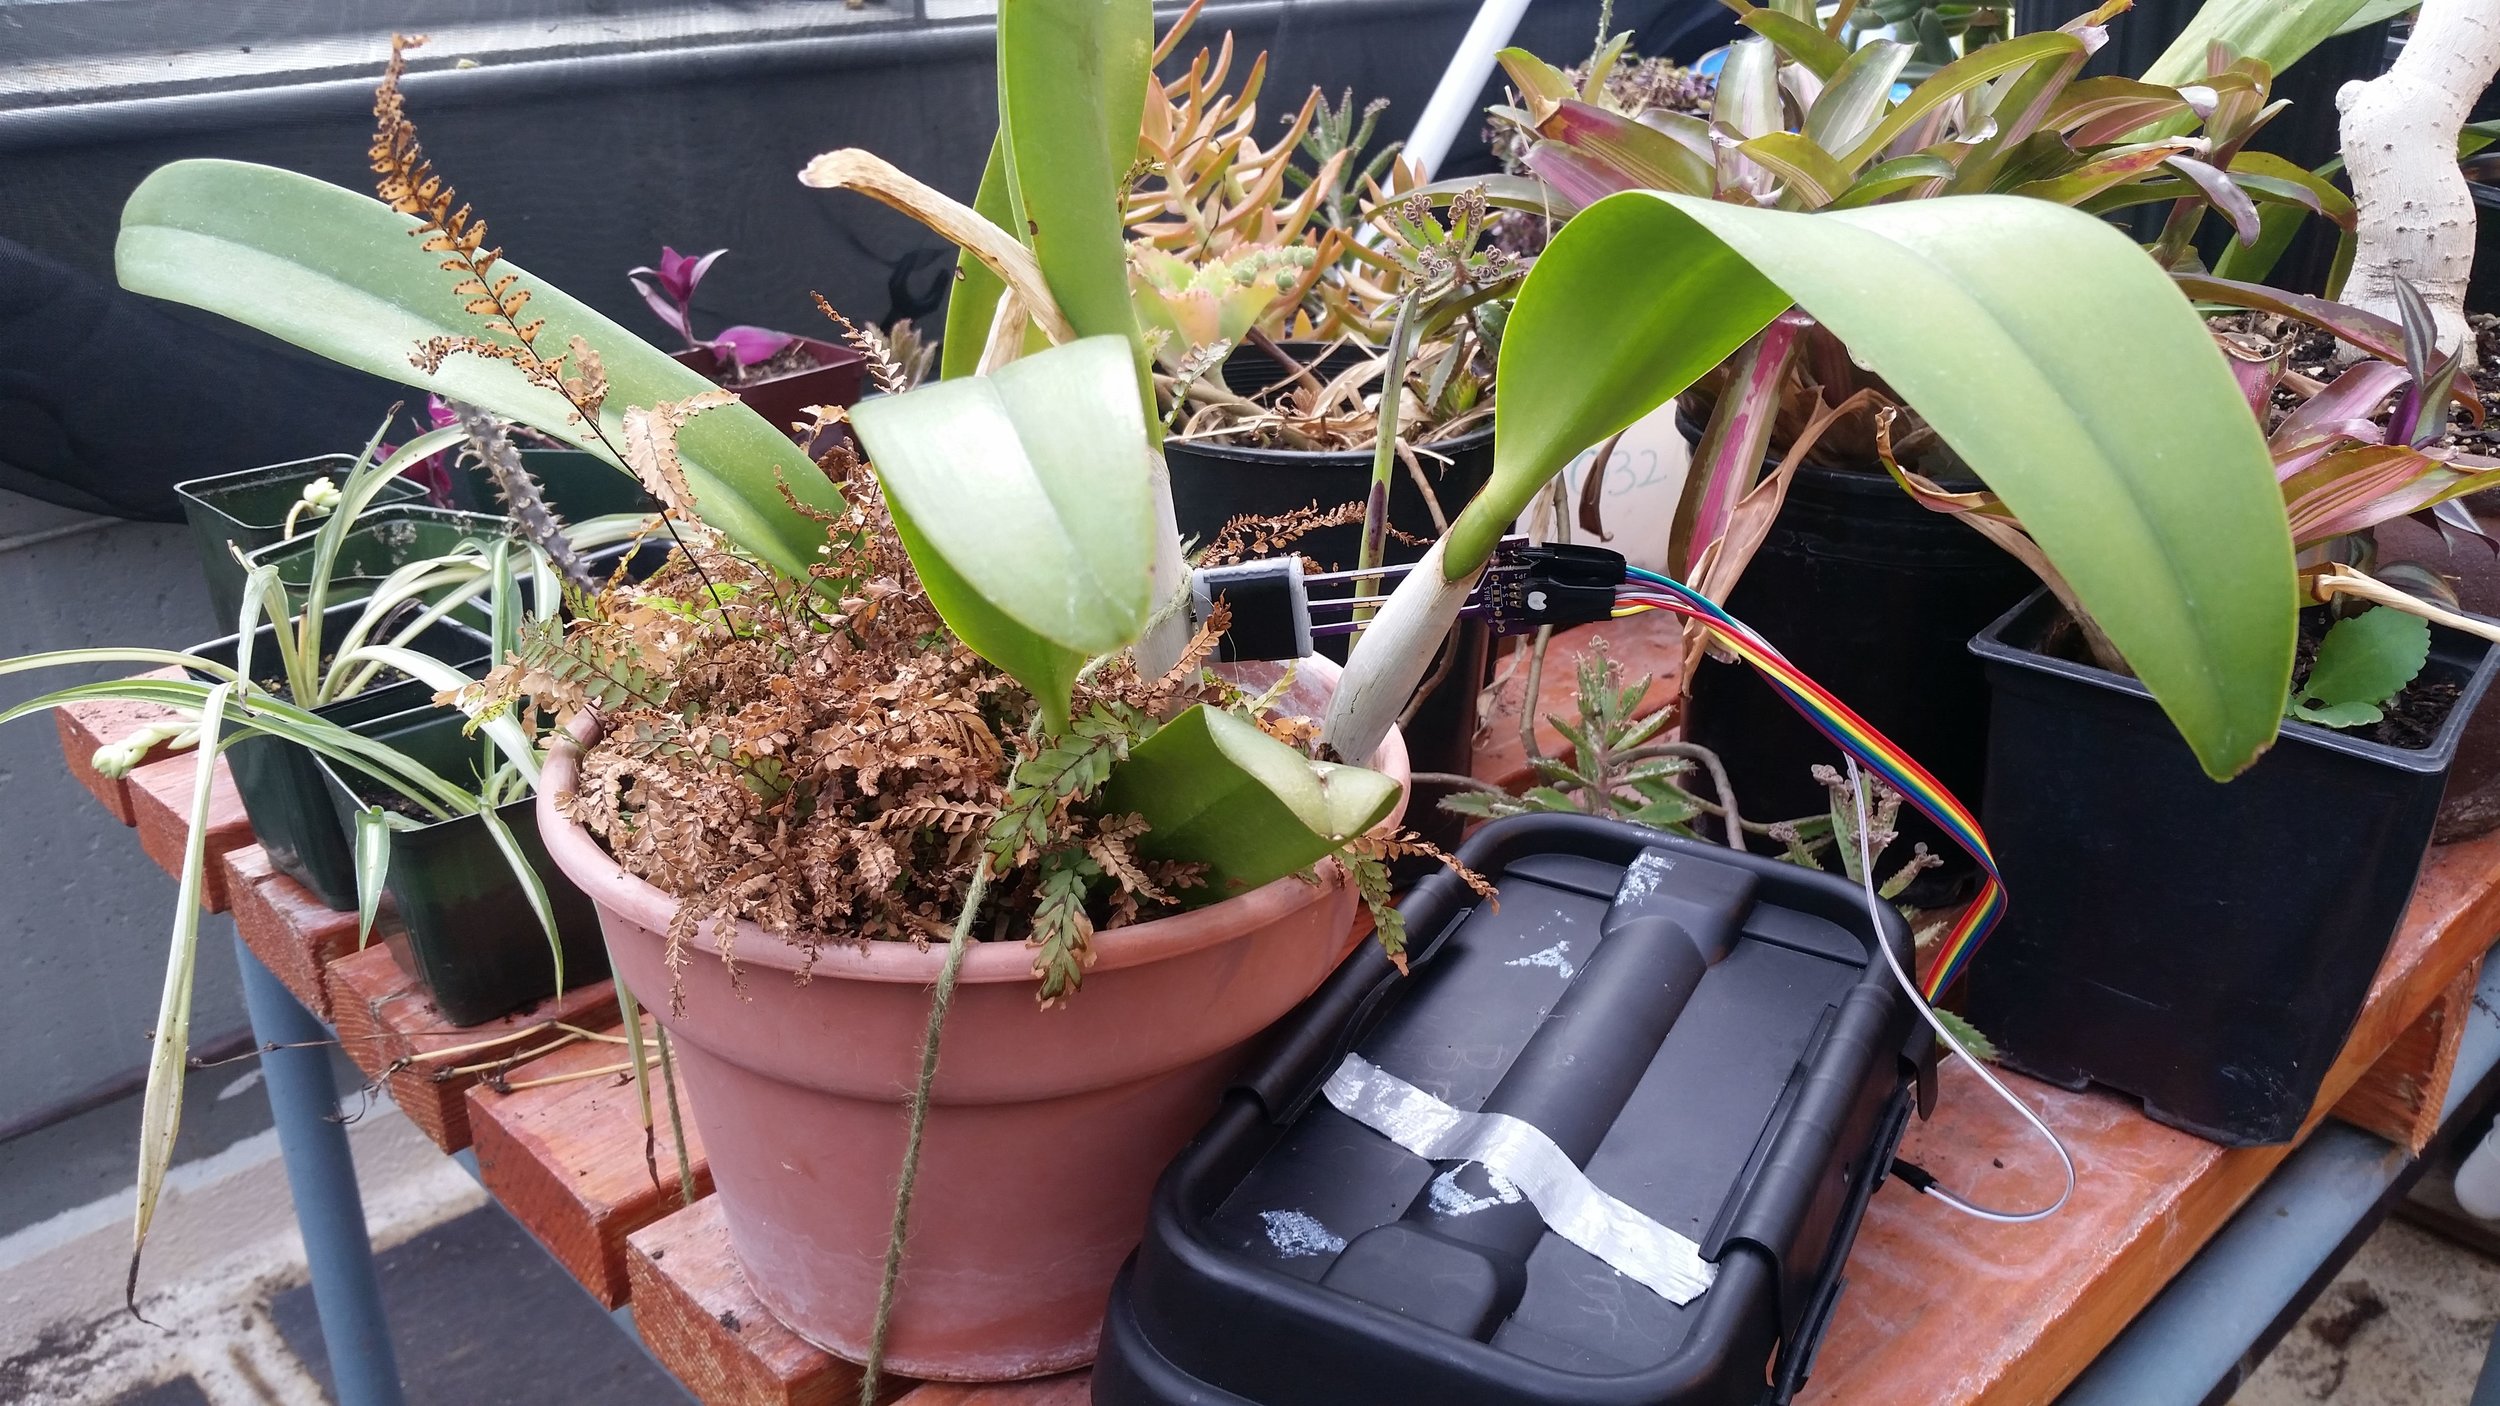
Image of the testing setup.
Results
The following graph was determined from the plant data. As you can see, there is a cyclic pattern happening, with the temperature differential. However, there are also several large “spikes” in the data. Talking with the greenhouse manager, it turns out that the timing of those spikes corresponds directly with the time he waters the plants. Best guest, water either cooled down one of the probes or got into the connections and acted as a short briefly before evaporating. The full raw data can be downloaded here.
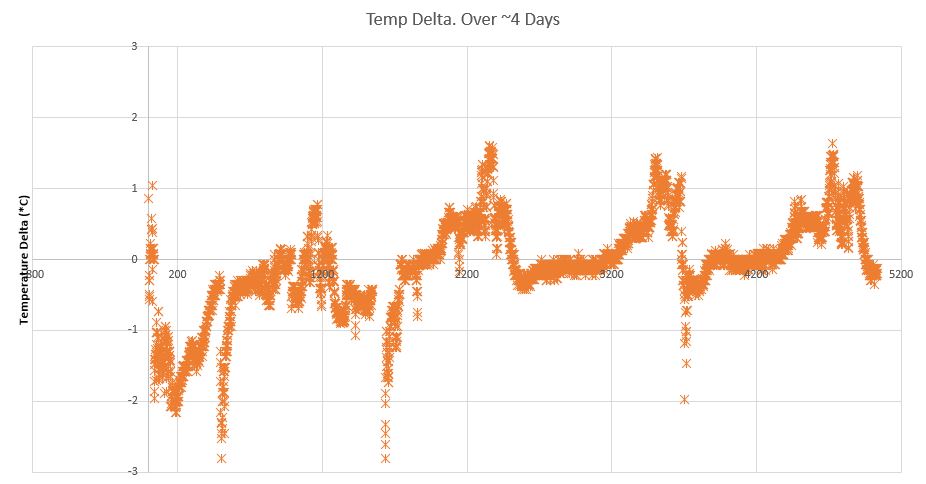
Graph over ~3.6 days worth of data. Data was logged every 60 seconds by an Adafruit M0 Feather with Lora.
To determine the exact temperatures from the two probes, two equations were used. The first one was a simple voltage divider equation to get the resistance of the thermistor. From the resistance, the thermistor beta equation was used to determine the temperature. The beta value for the beta value of the thermistor used (link here) was determined from its product datasheet. Unfortunately, the exact equations used were removed when I saved the file as its native CSV format after editing it in excel instead of saving it in an excel format (learn from my mistakes!).
Code
The code used for this project can be found here: https://github.com/stoddabr/SapFlux