
By: Jonathan Fookes
Design
A probe was built as described in this build guide. The following data was returned from the sensor. This probe is was designed by Dongjun Lee and Jonathan Fookes using the previous design from Brett Stoddard.
Methods
Because our probe was designed with an Ethernet connection, we created a PCB with an eight pin connector that sat directly on top of our Adafruit Feather M0 with Lora capabilities. Instead of using an NPN mosfet similar to the one used in the Orchid Test, a voltage regulator kept the voltage across the heater at a steady 3.3 V. These device was fully integrated with the LOOM interface for easy setup and implementation, as laid out in our LOOM implementation guide. The electronics were run with two batteries: 12 V, 2 AH to power the heater in pulses, and a 3.7 V, 2.5 AH battery to power the M0.
Similar to the Orchid Test, analog values were recorded by the board’s dedicated analog in pins. As per default, these readings were 10-bit although the M0 chip has the capability to do 12-bit ADC (detailed in this link), therein increasing the theoretical precision four-fold. These raw values were logged onto an SD card.
The waterproof enclosure was built to contain the fully constructed circuit and each of the batteries. Even though the tree was too far away from the lab to successfully transmit and received LORA data, there is space for an antenna and LORA can be set up using the LOOM interface if desired. The waterproof Ethernet connector is where the probe can connect to the circuitry, ensuring a secure connection. A hot glue gun was used to add an extra waterproof seal.
Energy Saving: The Power Problem
Our design uses heat pulses in order to save energy. Given the current models and code for both the TDM and HRM sapflux measuring methods, we conducted a current draw test with the batteries we had on hand to see if our designs will be able to run continuously in the field for 2 weeks as requested.
TDM Probe
Current Draw: 20.88 to 20.91 mA while on, 0.13 mA while off (not negligible)
TDM heater Pulse: 4 minute pulse every 30 minutes, aka 8 minutes an hour, 192 minutes per day. This is 3.2 hours.
The TDM probe uses: 67 mAh per day(Heater on) + 2.7mAh per day(Heater off) ~= 70mAh per day. The TDM heater probe can be on for 28.5 days with a 2,000 mAH battery.
TDM base
Assume we measure SHT31D + probe temperatures + soil moisture
M0 Current draw: 25 mA in Idle, and +130mA when measuring and transmitting data. (25mA * 24h per day) + (130mA * 48sec per day) = 600 mAh(idle) + 1.73mAh(Transmit data) = 601.73 mAh per day. The M0 can run for 16.6 days when we use a 3.7V 10,000mAh battery.
HRM Probe
Current Draw: 225 to 237 mA
HRM Heater pulse: 2.5 sec on and 2.5 sec off. It works on 2 minutes every 30 min, aka 2 minutes an hour, 48 minutes(0.8 hours) per day. 180 mAh to 190 mAh per day. The HRM heater can run for 10.5 days when we use a 12V 2,000mAh battery. For 2 weeks test, we need higher capacity of battery.
HRM base
M0 Current draw: 25 mA in Idle, +130mA when measuring and transmitting data, and 156 mA when relay switch is on.
Relay switch is on for 2.5sec and off for 2.5 sec. It works on 2 minutes every 30 min, aka 2 minutes an hour, 48 minutes(0.8 hours) per day. (156mA *0.8h per day) + (25mA *23.2h per day) + (130mA * 48sec per day) = 124.8mAh(Relay on) + 580mAh(Relay off and idle) + 1.73mAh(Transmit data) = 706.53mAh per day. The M0 can run for 14 days when we use a 3.7V 10,000mAh battery.
TDM Test: Return of the Data
After a couple of failed test runs, we were finally able to graph data using our TDM probe. We used the Dynamax data calculation example from their website and created the following graph for the sap flow in a wild Cherry tree for about
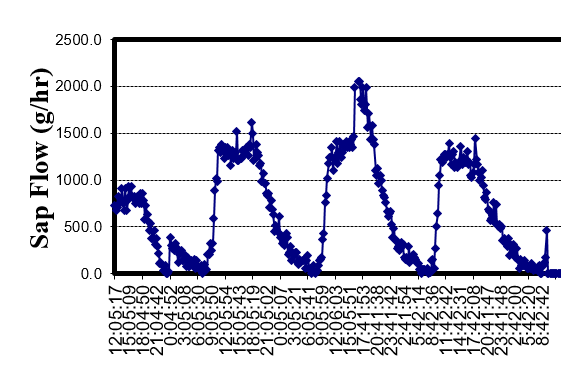 The trend of this data is consistent and promising!
We have a two-week long test of our TDM probes coming up in the following weeks, where we will be able to show more conclusively if our probes are providing accurate sap flow data.
HRM Test: The Phantom Data
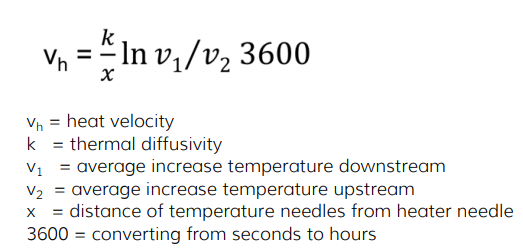
Our first HRM test was a success, however we are still working on a method to calculate sap flow from the data we have collected. Below is the data we collected in the wild cherry tree. We are continuing to work with the Heat Ratio equation to plot Sap Flow in grams per hour with respect to time.
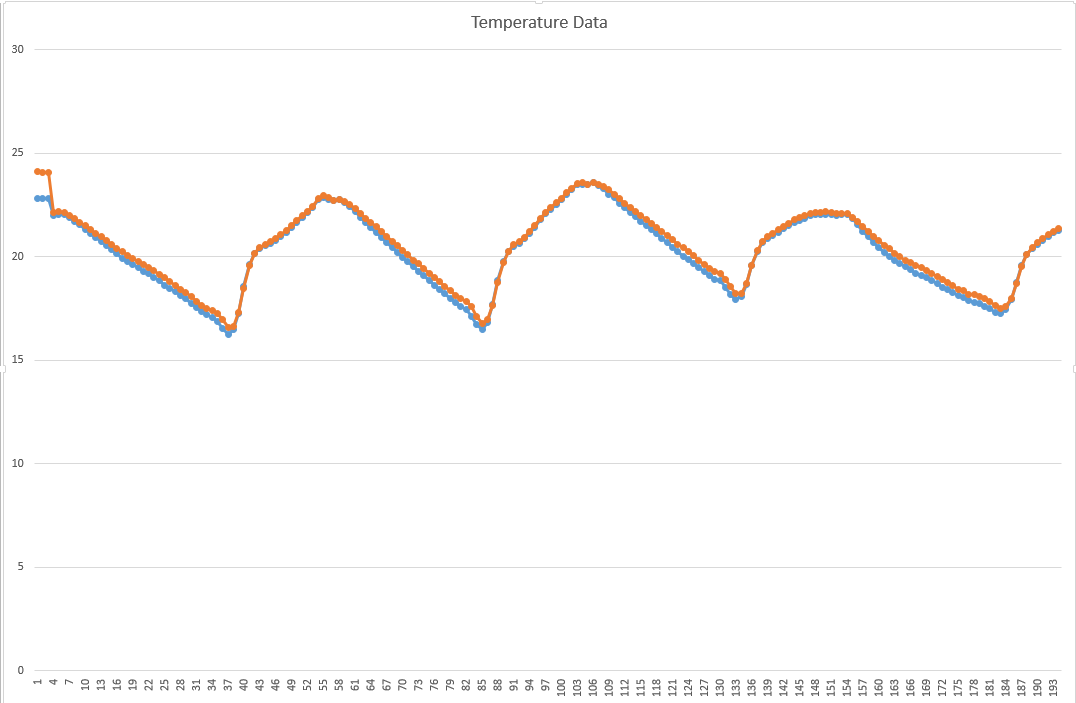 This plot shows all of the data points we measure on our HRM test. The y-axis is degrees Celsius. Because we collected data every 15 minutes during this test, the x-axis is time, and represents X*(15 minutes)
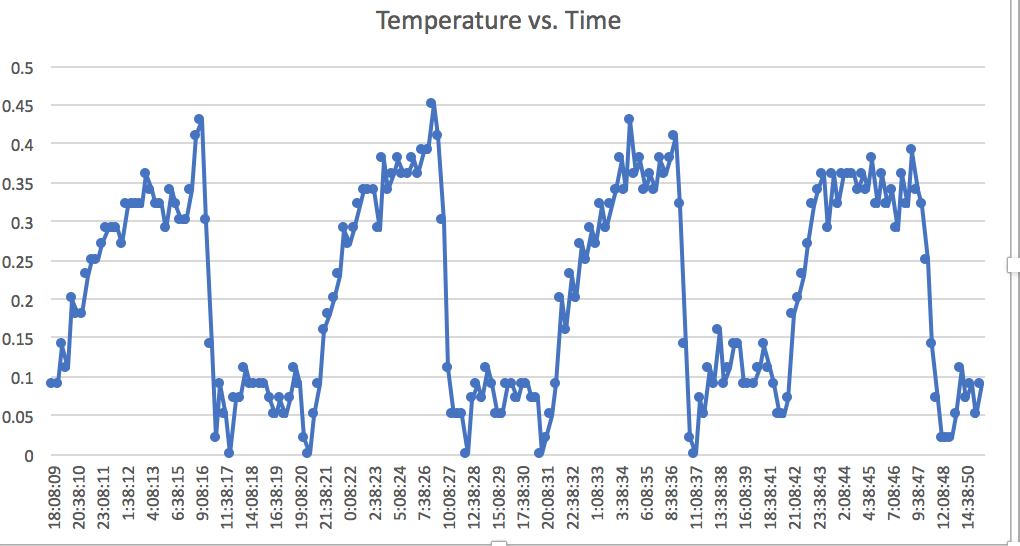 Here we have the difference between the temperatures of the two probes you see in the first graph. The y-axis is still in degrees Celsius and the x-axis shows time of day.
While we do not have calculations for Sap Flow yet, we know that a lower difference means that there is an increase in sap movement up the trunk of the tree, and a higher difference means less. We can infer this from the Heat Ratio Equation. The HRM difference data shows that the lowest difference occurs between ~11:30am and 7:00pm. This is consistent with our TDM data, shown in the section above. While our TDM measuring method is more complete and can render Sap Flow calculations, we are confident that our HRM measuring method can be used to produce accurate readings as well.
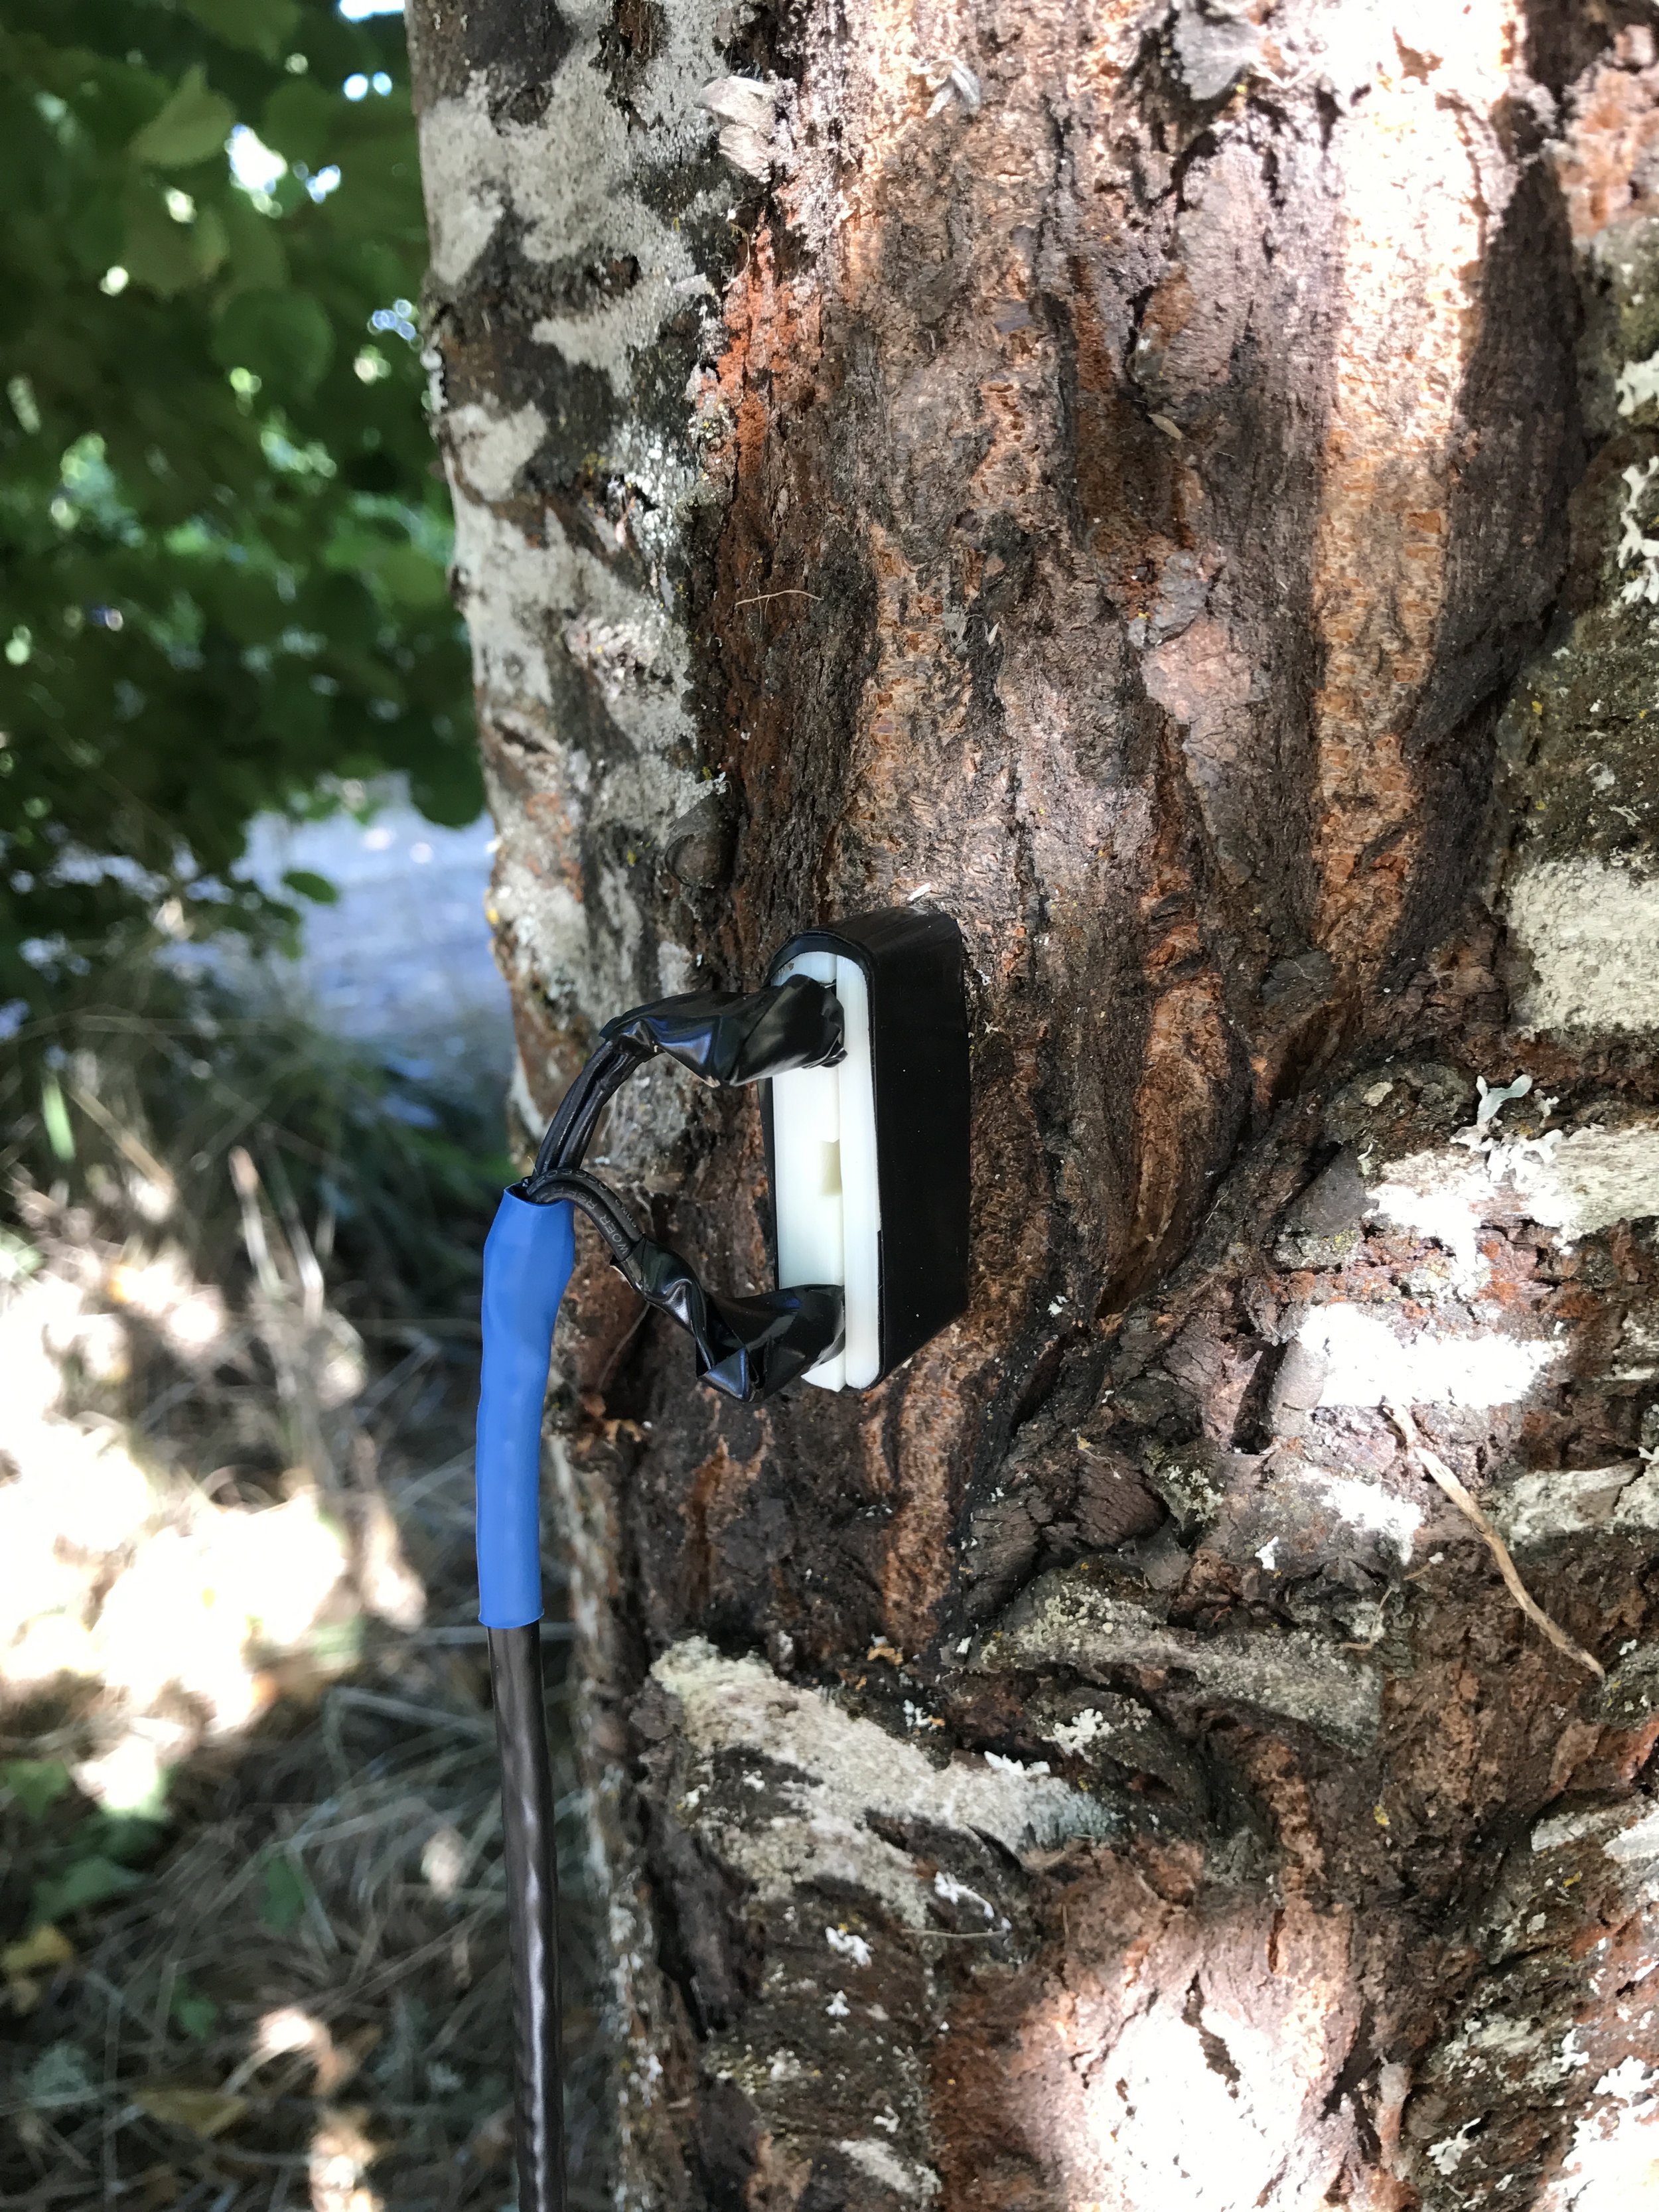 Our TDM probe prototype in the wild cherry tree! (8/03/2018)
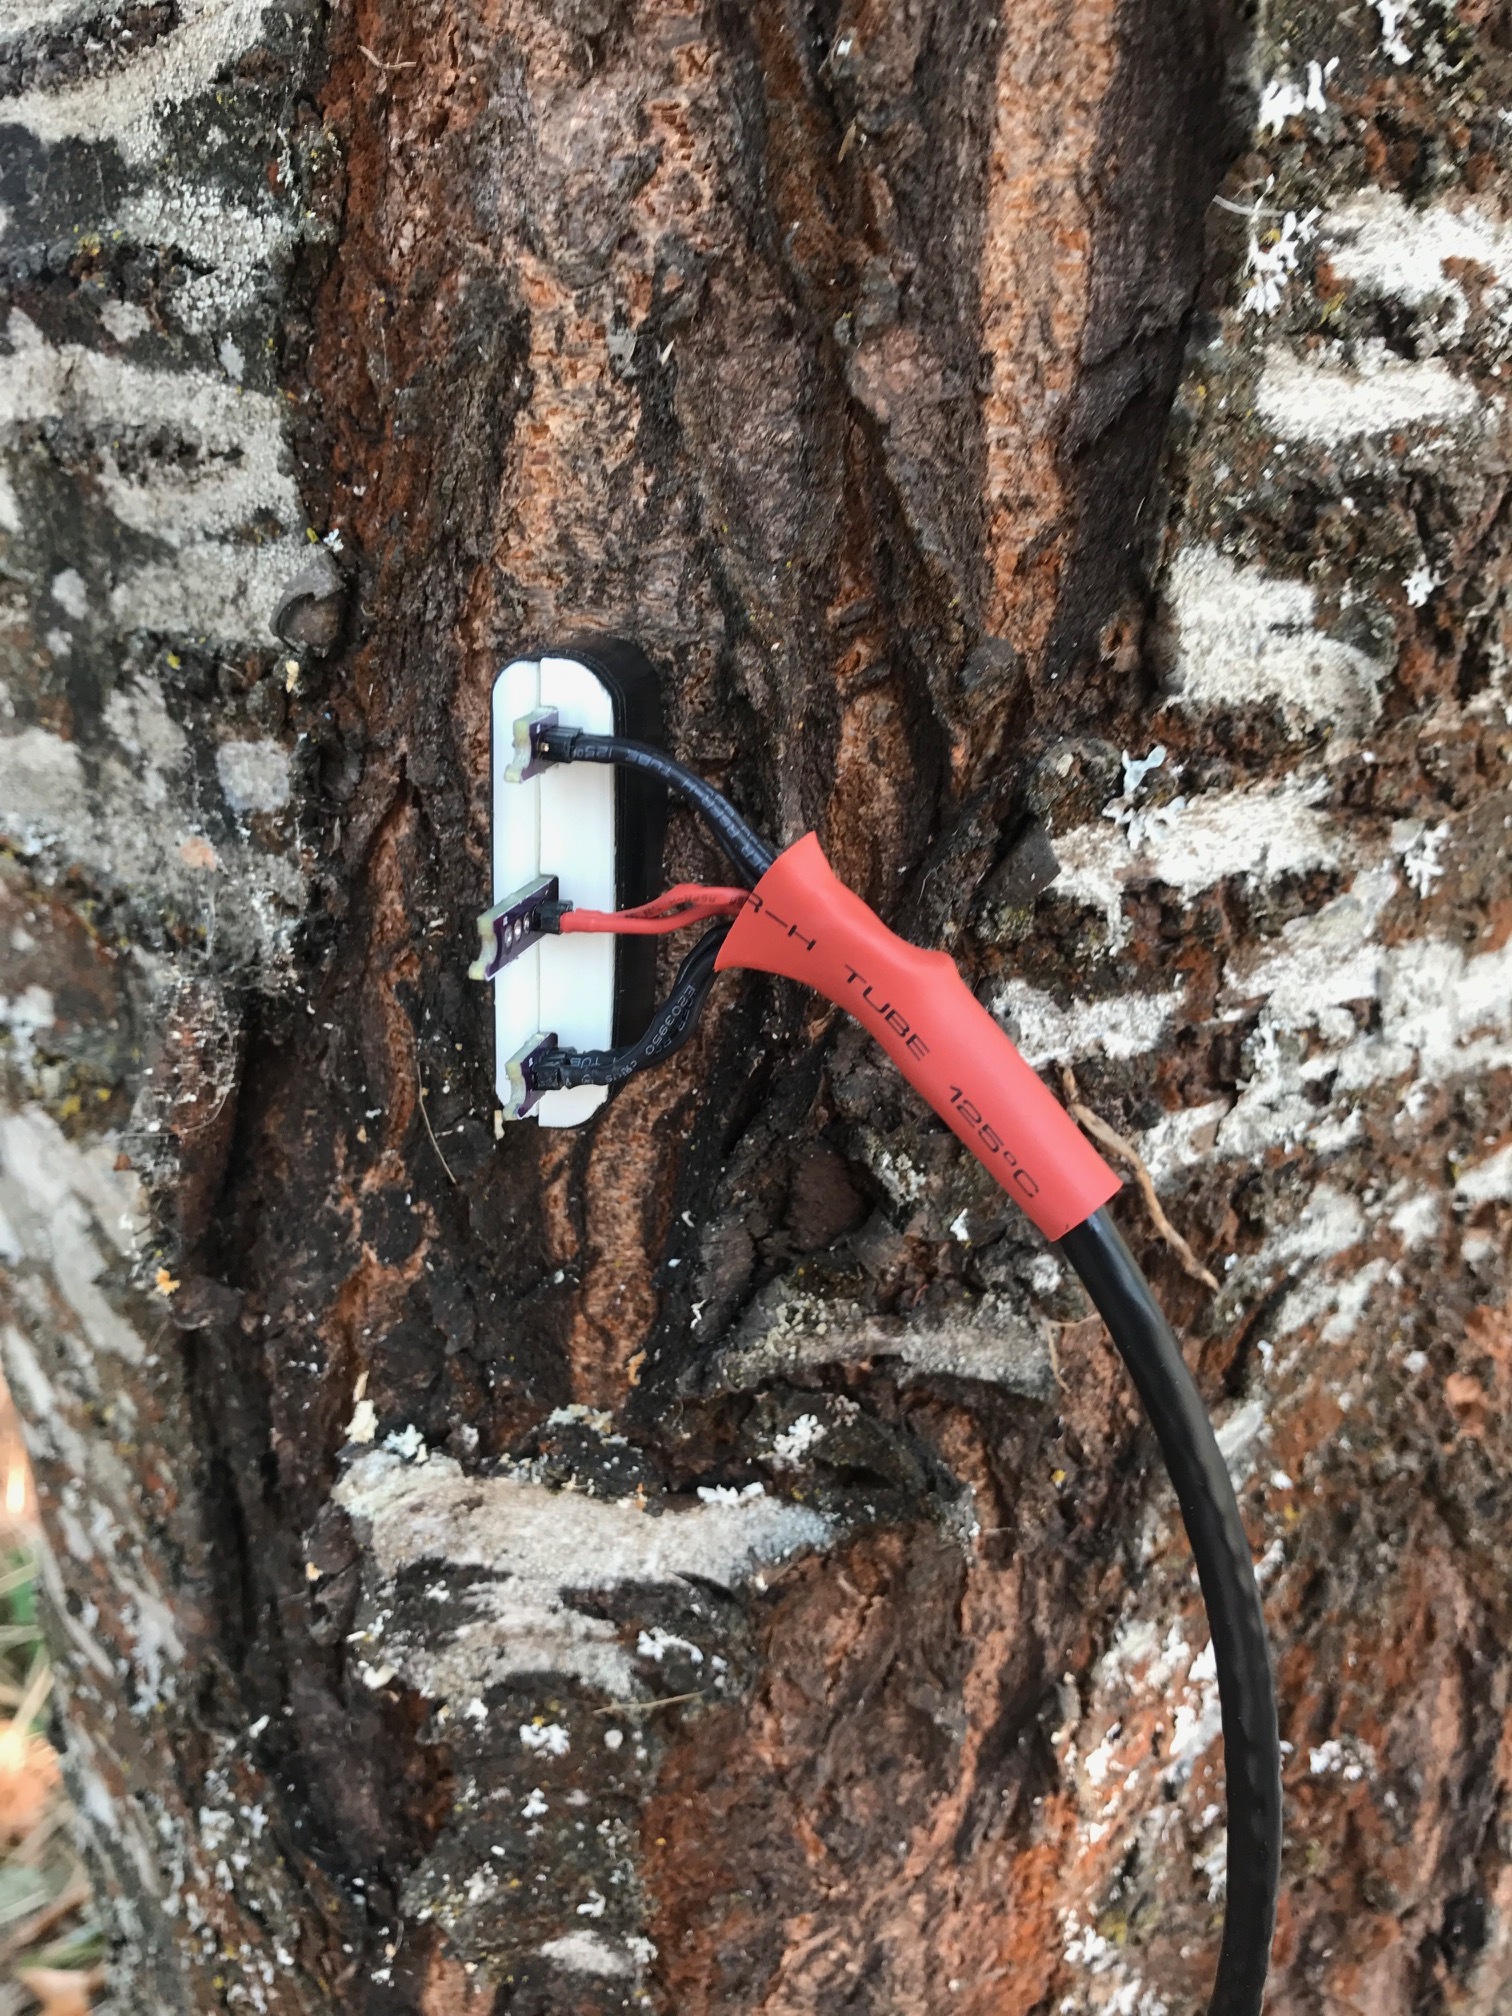 Our HRM probe prototype in the wild cherry tree! (8/16/2018)
What’s next for the Sap Flow Team?
Now that we have gathered promising data from a tree, we will be deploying both our TDM and HRM prototypes in an orchard, where we will attempt to gather data for two weeks continuously. More on this to come!