
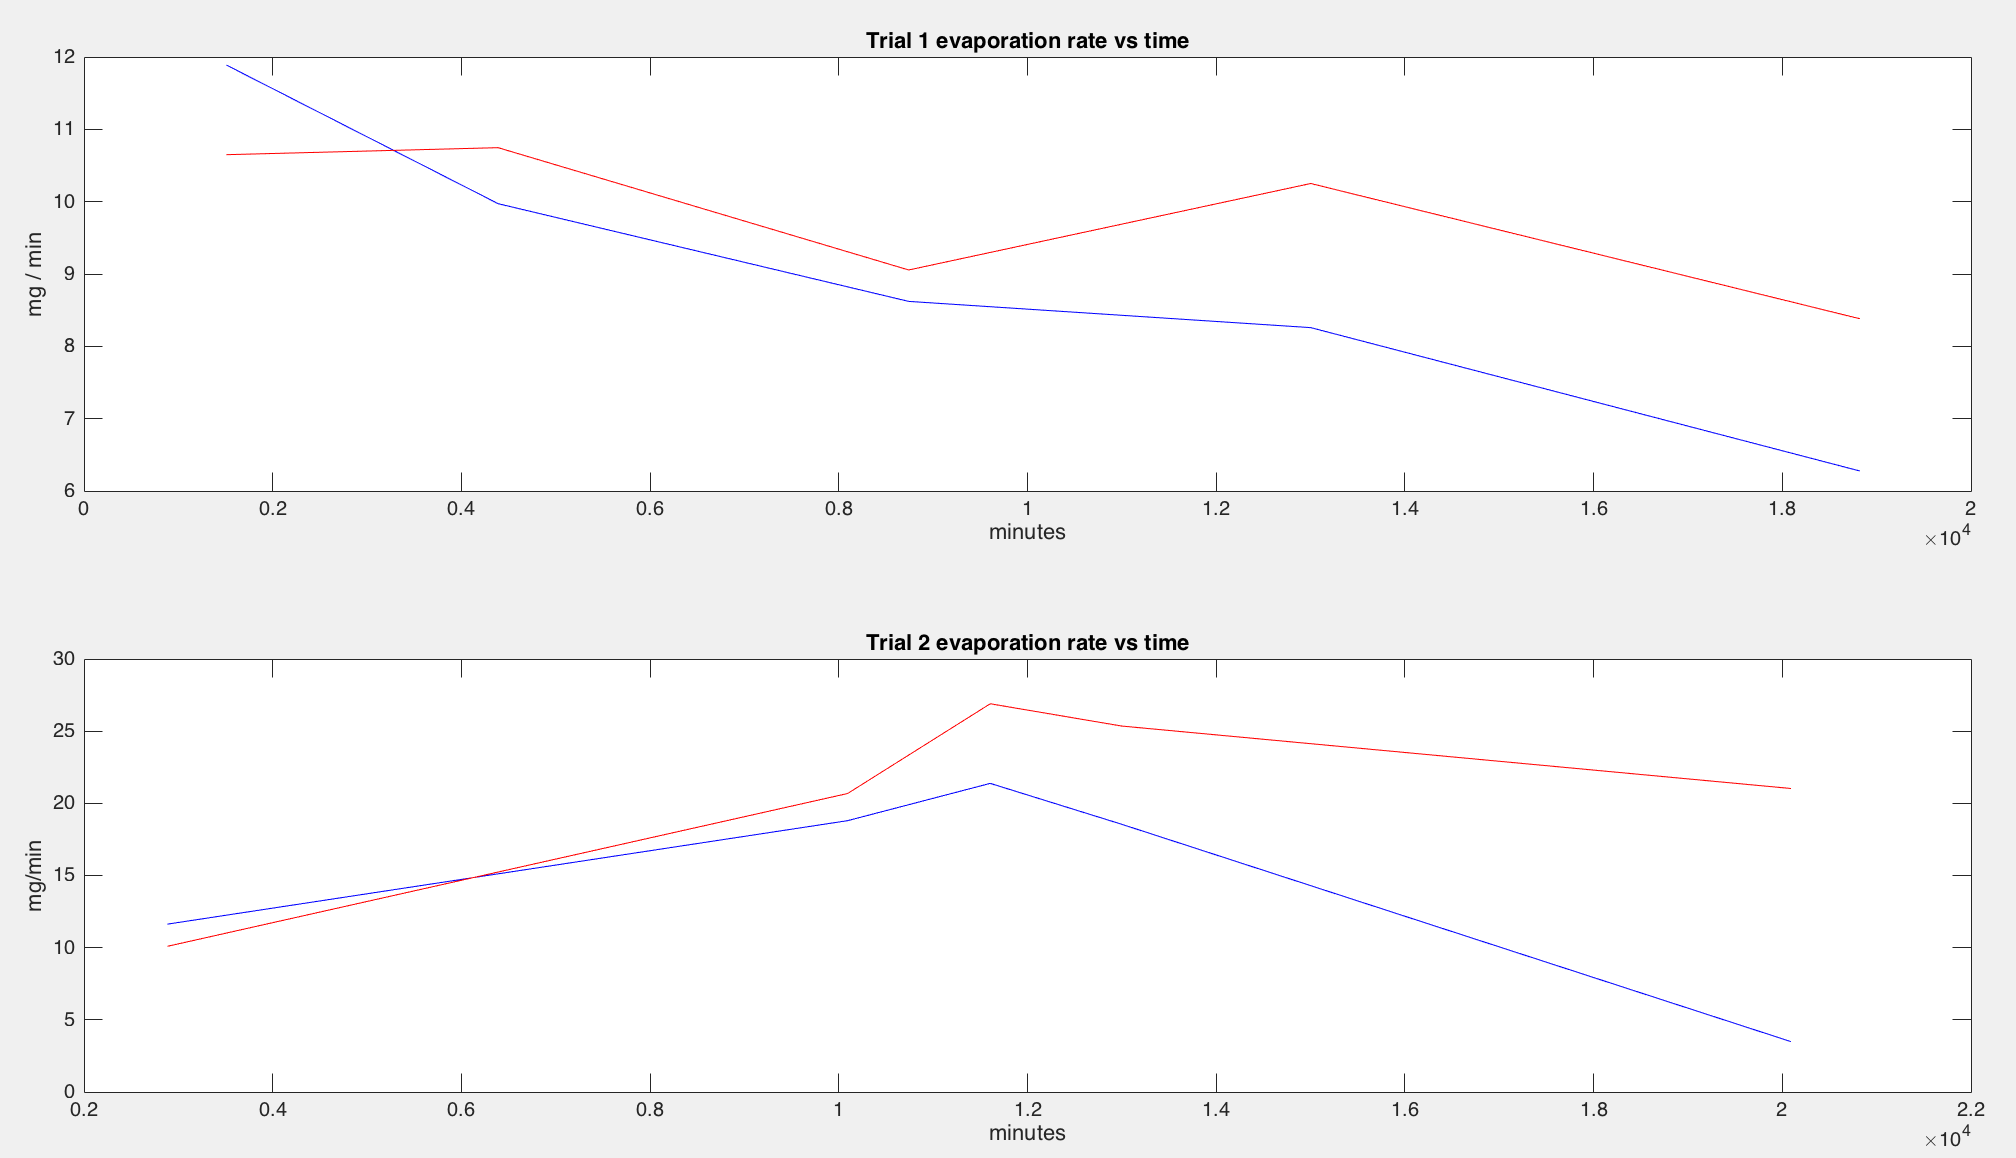
The rain validator test has undergone two trials, each spanning about two weeks. The results so far seem to be promising: the validator’s rate of evaporation is very similar to the beaker’s. Below is a graph of the average rate of evaporation at each point, calculated by taking the difference in mass between each set of points and dividing that by the change in time between them.
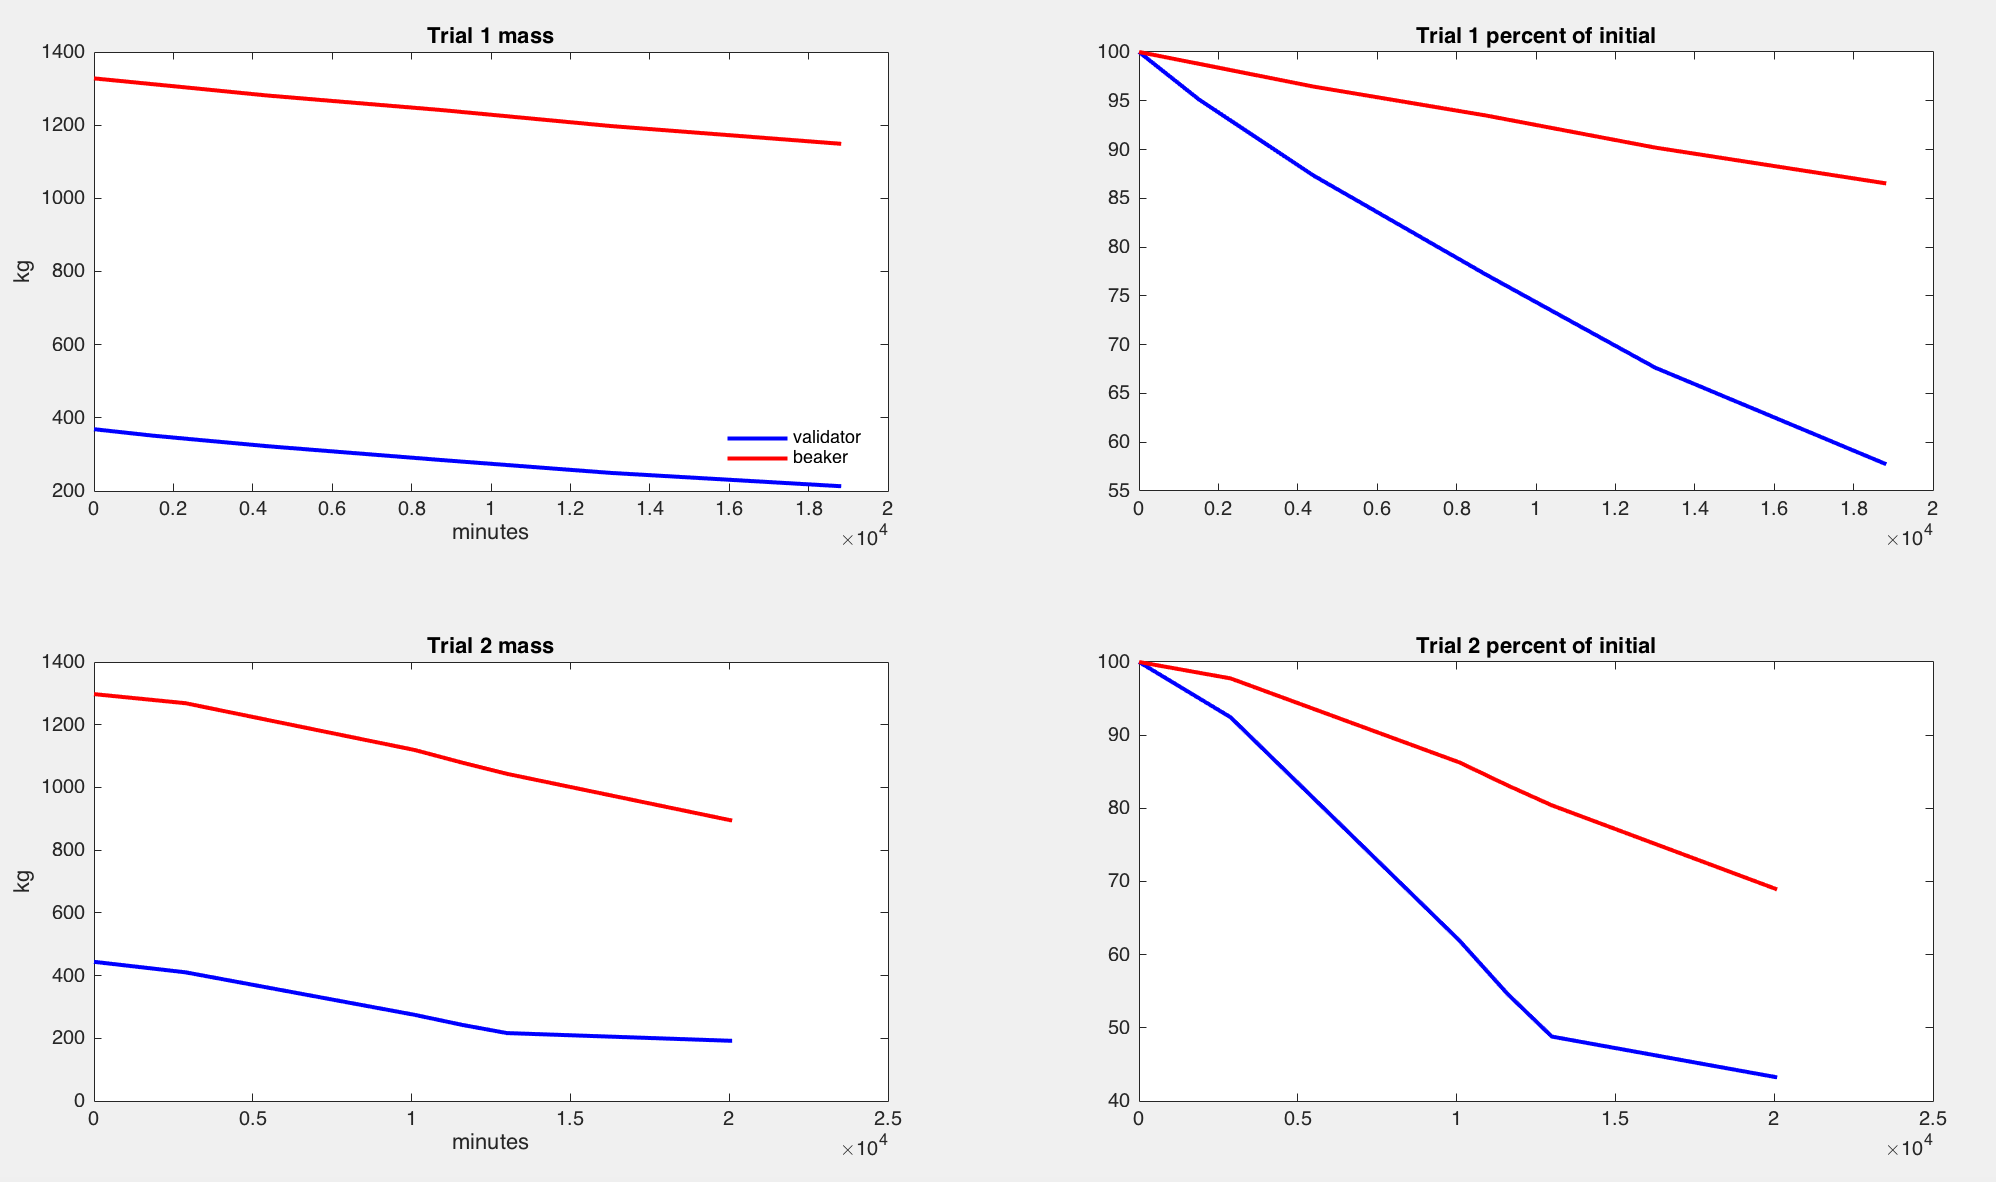
In all graphs, red represents the data from the beaker, while blue represents the data from the validator.
It’s interesting that for both trials, the rain validator’s water evaporates at a faster rate for the first day and then it’s rate becomes increasingly slower than that of the beaker. The beaker has a larger radius, so this is likely due to a combination of the saturated wick having more surface area and a smaller percentage of the validator’s total mass remaining over time compared to the beaker. This can be seen in the right two graphs in the first picture: the beaker’s percent mass decreases more linearly than the validator’s, which has a slight upward concavity.
Some errors with these trials include the changing humidity of the environment as well as the temperature of the room, especially since the beaker and validator were set near an oven that ran at varying temperatures for varying amounts of time. Because the beaker’s and validator’s locations were constant and adjacent, the validator’s performance can accurately be compared to that of a plain, 1L beaker of water.