The OPEnS Power Control Board: A circuit to reduce the standby current draw of microcontroller projects to 130uA

At the OPEnS Lab, we’ve found a common requirement amongst our projects: a long, long, long battery life. The OPEnSampler was particularly challenging due to its simultaneous 3.3V, 5V, and 12V power requirements. MOSFET circuits exist that can manipulate power sources and drop their standby currents to near-zero, but designing these in a way that latched their state in both directions, and were powered exclusively from the source battery, was difficult. This short blog post will discuss the features and considerations of Release 1.0.0 of the OPEnS Power Control Board.


RL_board.jpgRL_board.jpg

The schematic


Power7.1.pngPower7.1.png

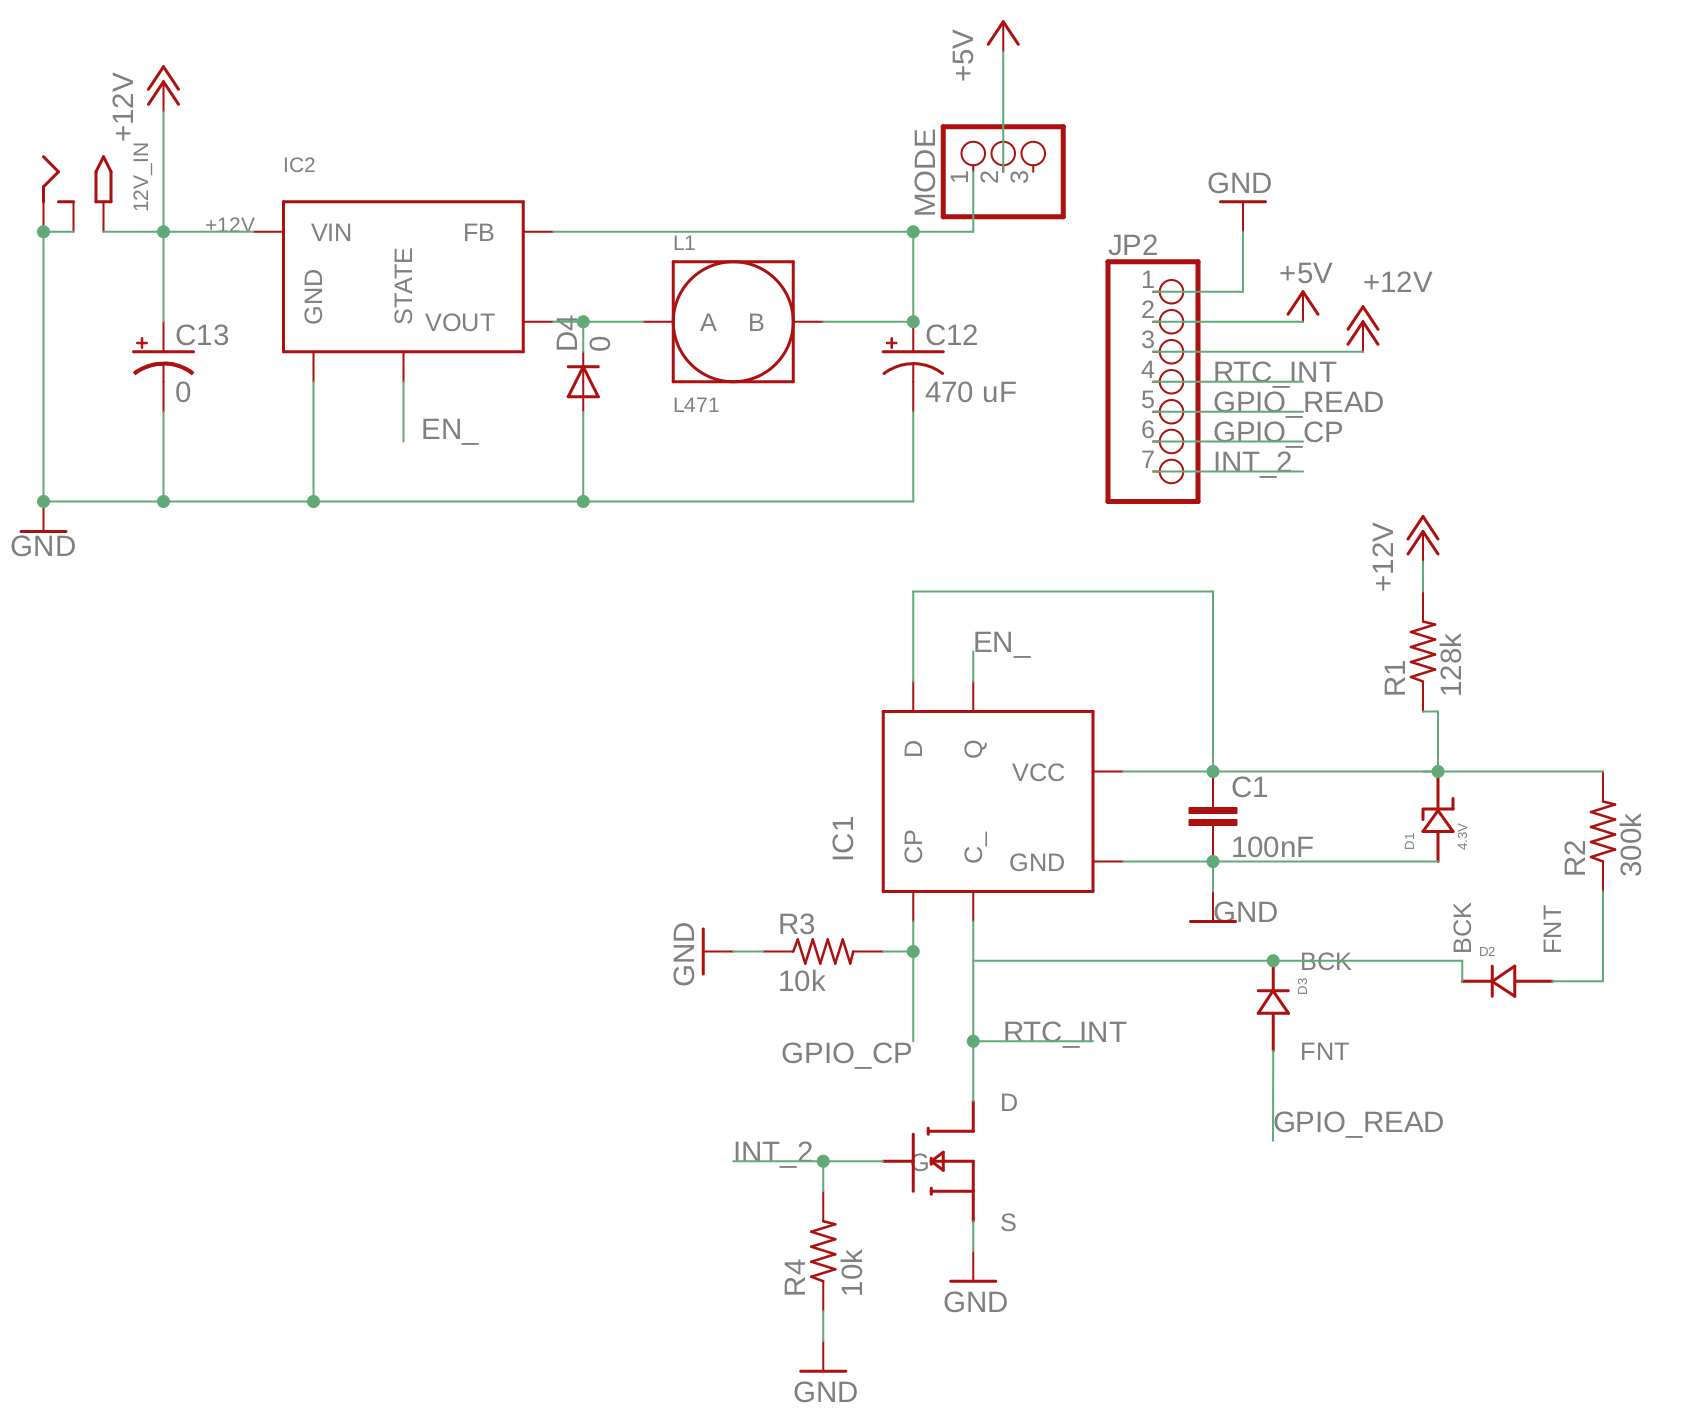
The circuit was designed by Mitch Nelke. There are two core integrated circuits in this board. IC1 represents the flip flop IC and is responsible for latching its EN-bar output HIGH or LOW after a HIGH pulse on its Clock Pulse input or a LOW pulse on its C-bar input, respectively. IC2 represents the 12v-5v switching regulator component that drops the battery’s 12v supply to the 5v used to power the microcontroller and other components.


The Flip Flop

The flip flop circuit power is sourced from the battery’s raw 12v, though it is dropped down to 4.3v by the zener diode D1. R1 was chosen based on a minimum required current of 60uA, derived from the max required input current of the switching regulator’s enable pin and the current required by the flip flop IC plus a bit of extra as a buffer. This 4.3v source is also used to pull the flip flop’s D input HIGH at all times. The Clock Pulse (CP) input is pulled to ground by a 10k resistor. On a rising edge on CP, the flip flop reads the boolean state of D and sets its Q output to match that value. With this setup, a HIGH pulse to CP will always set Q HIGH.


The C-bar input has a weak pullup resistor, R2, to 4.3v. When C-bar is pulled LOW, such as through the RTC_INT input or a HIGH input from INT_2, the flip flop IC ignores any clock pulses and sets its Q output LOW. When C-bar is raised HIGH, Q will stay LOW until the next clock pulse.


GPIO_READ allows a microcontroller input pin to read the state of the real time clock’s (RTC) interrupt alarm while the device is on. RTC_INT should be attached directly to the RTC’s INT/SQW pin, and GPIO_CP should be attached to the microcontroller’s output pin that is responsible for shutting the device off.


The Switching Regulator

The switching regulator efficiently converts the 12v input to a 5v output. This part of the circuit is essentially ripped from the LM2575 datasheet’s recommended circuit. Its EN-bar input acts as a low-true output-enable and is attached directly to the flip flop’s Q output. The 5v output of the regulator is fed through the MODE jumper. The MODE jumper’s first two pins should be connected during regular use, but should be disconnected when a USB is plugged into the microcontroller (to program it, for example) to not have competing 5v supplies.


The Board

The board layout was done in EAGLE CAD by Sam Edwards. I’ve added dimensions and turned off tStop and pour planes so it is more clear.
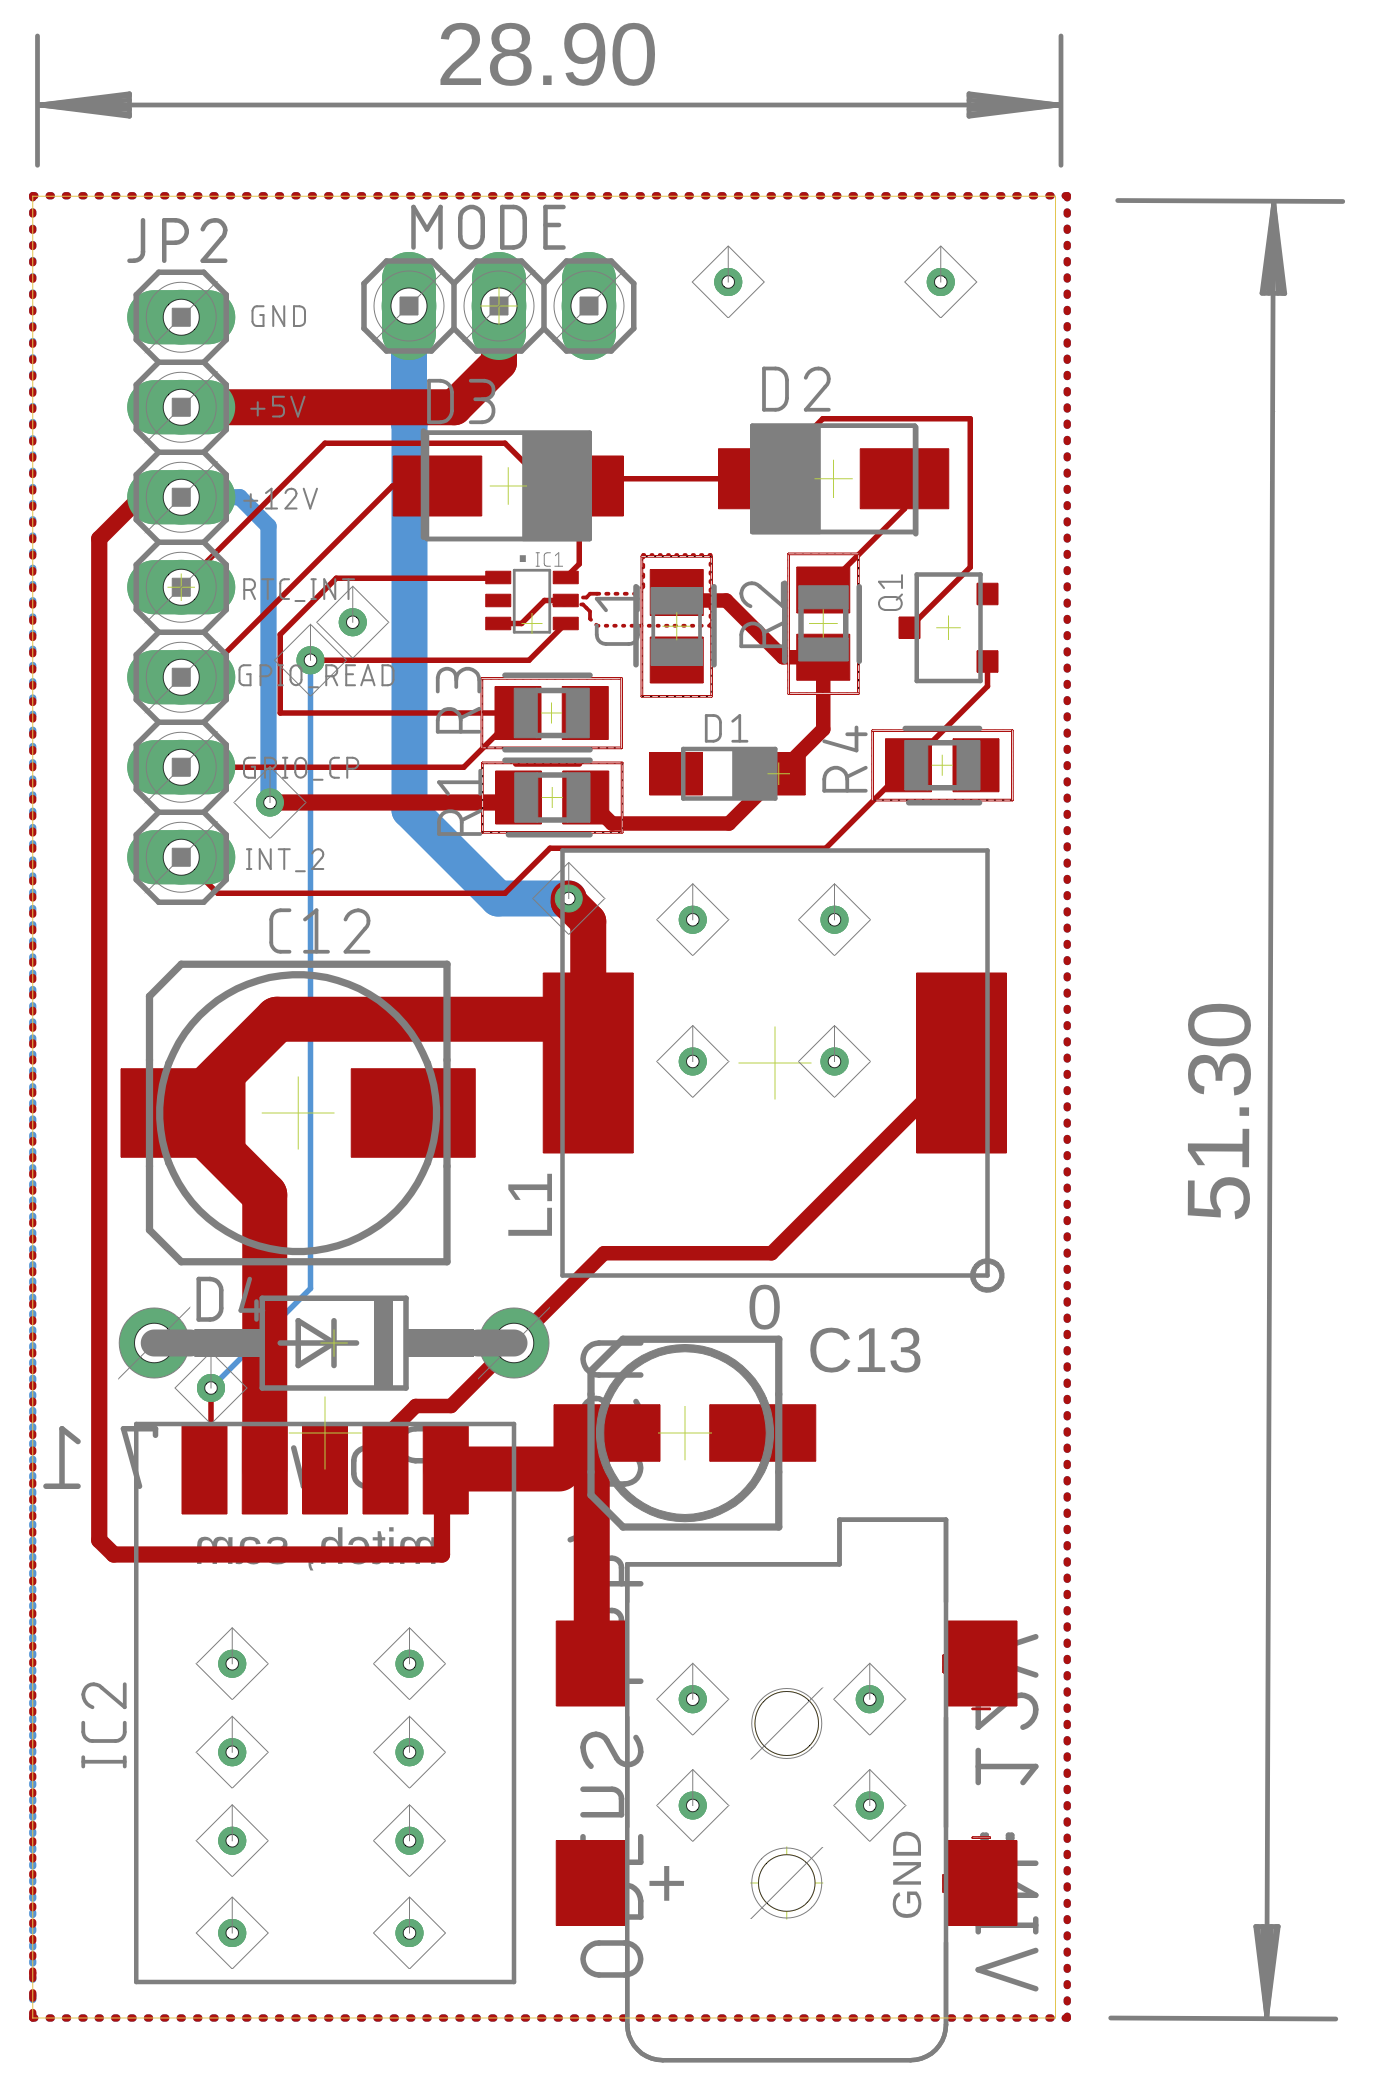

Power7.1-board.pngPower7.1-board.png

Connections

The board is designed specifically to work with Adafruit’s Feather M0 microcontroller series. It should be powered by a 12v battery plugged into the 2.5×5.5mm barrel jack receptacle.

  • The +5V pin should connect to the M0’s USB power pin or the Arduino Uno’s Vin. MODE should be closed with a jumper to enable the 5v output of the board.

  • The +12V output should be connected to any circuitry that requires 12v.

  • RTC_INT should be connected to the real time clock’s interrupt output, or any other independent circuitry that sends a LOW-TRUE signal to turn the device on.

  • GPIO_READ should be connected to an input pin on the microcontroller if the real time clock’s alarm needs to be read by the microcontroller when power is already enabled.

  • GPIO_CP should be connected to the microcontroller’s digital output that is designated as the shutoff pin.

  • INT2 should be connected to any external circuitry that should power the device on with a HIGH-TRUE signal.
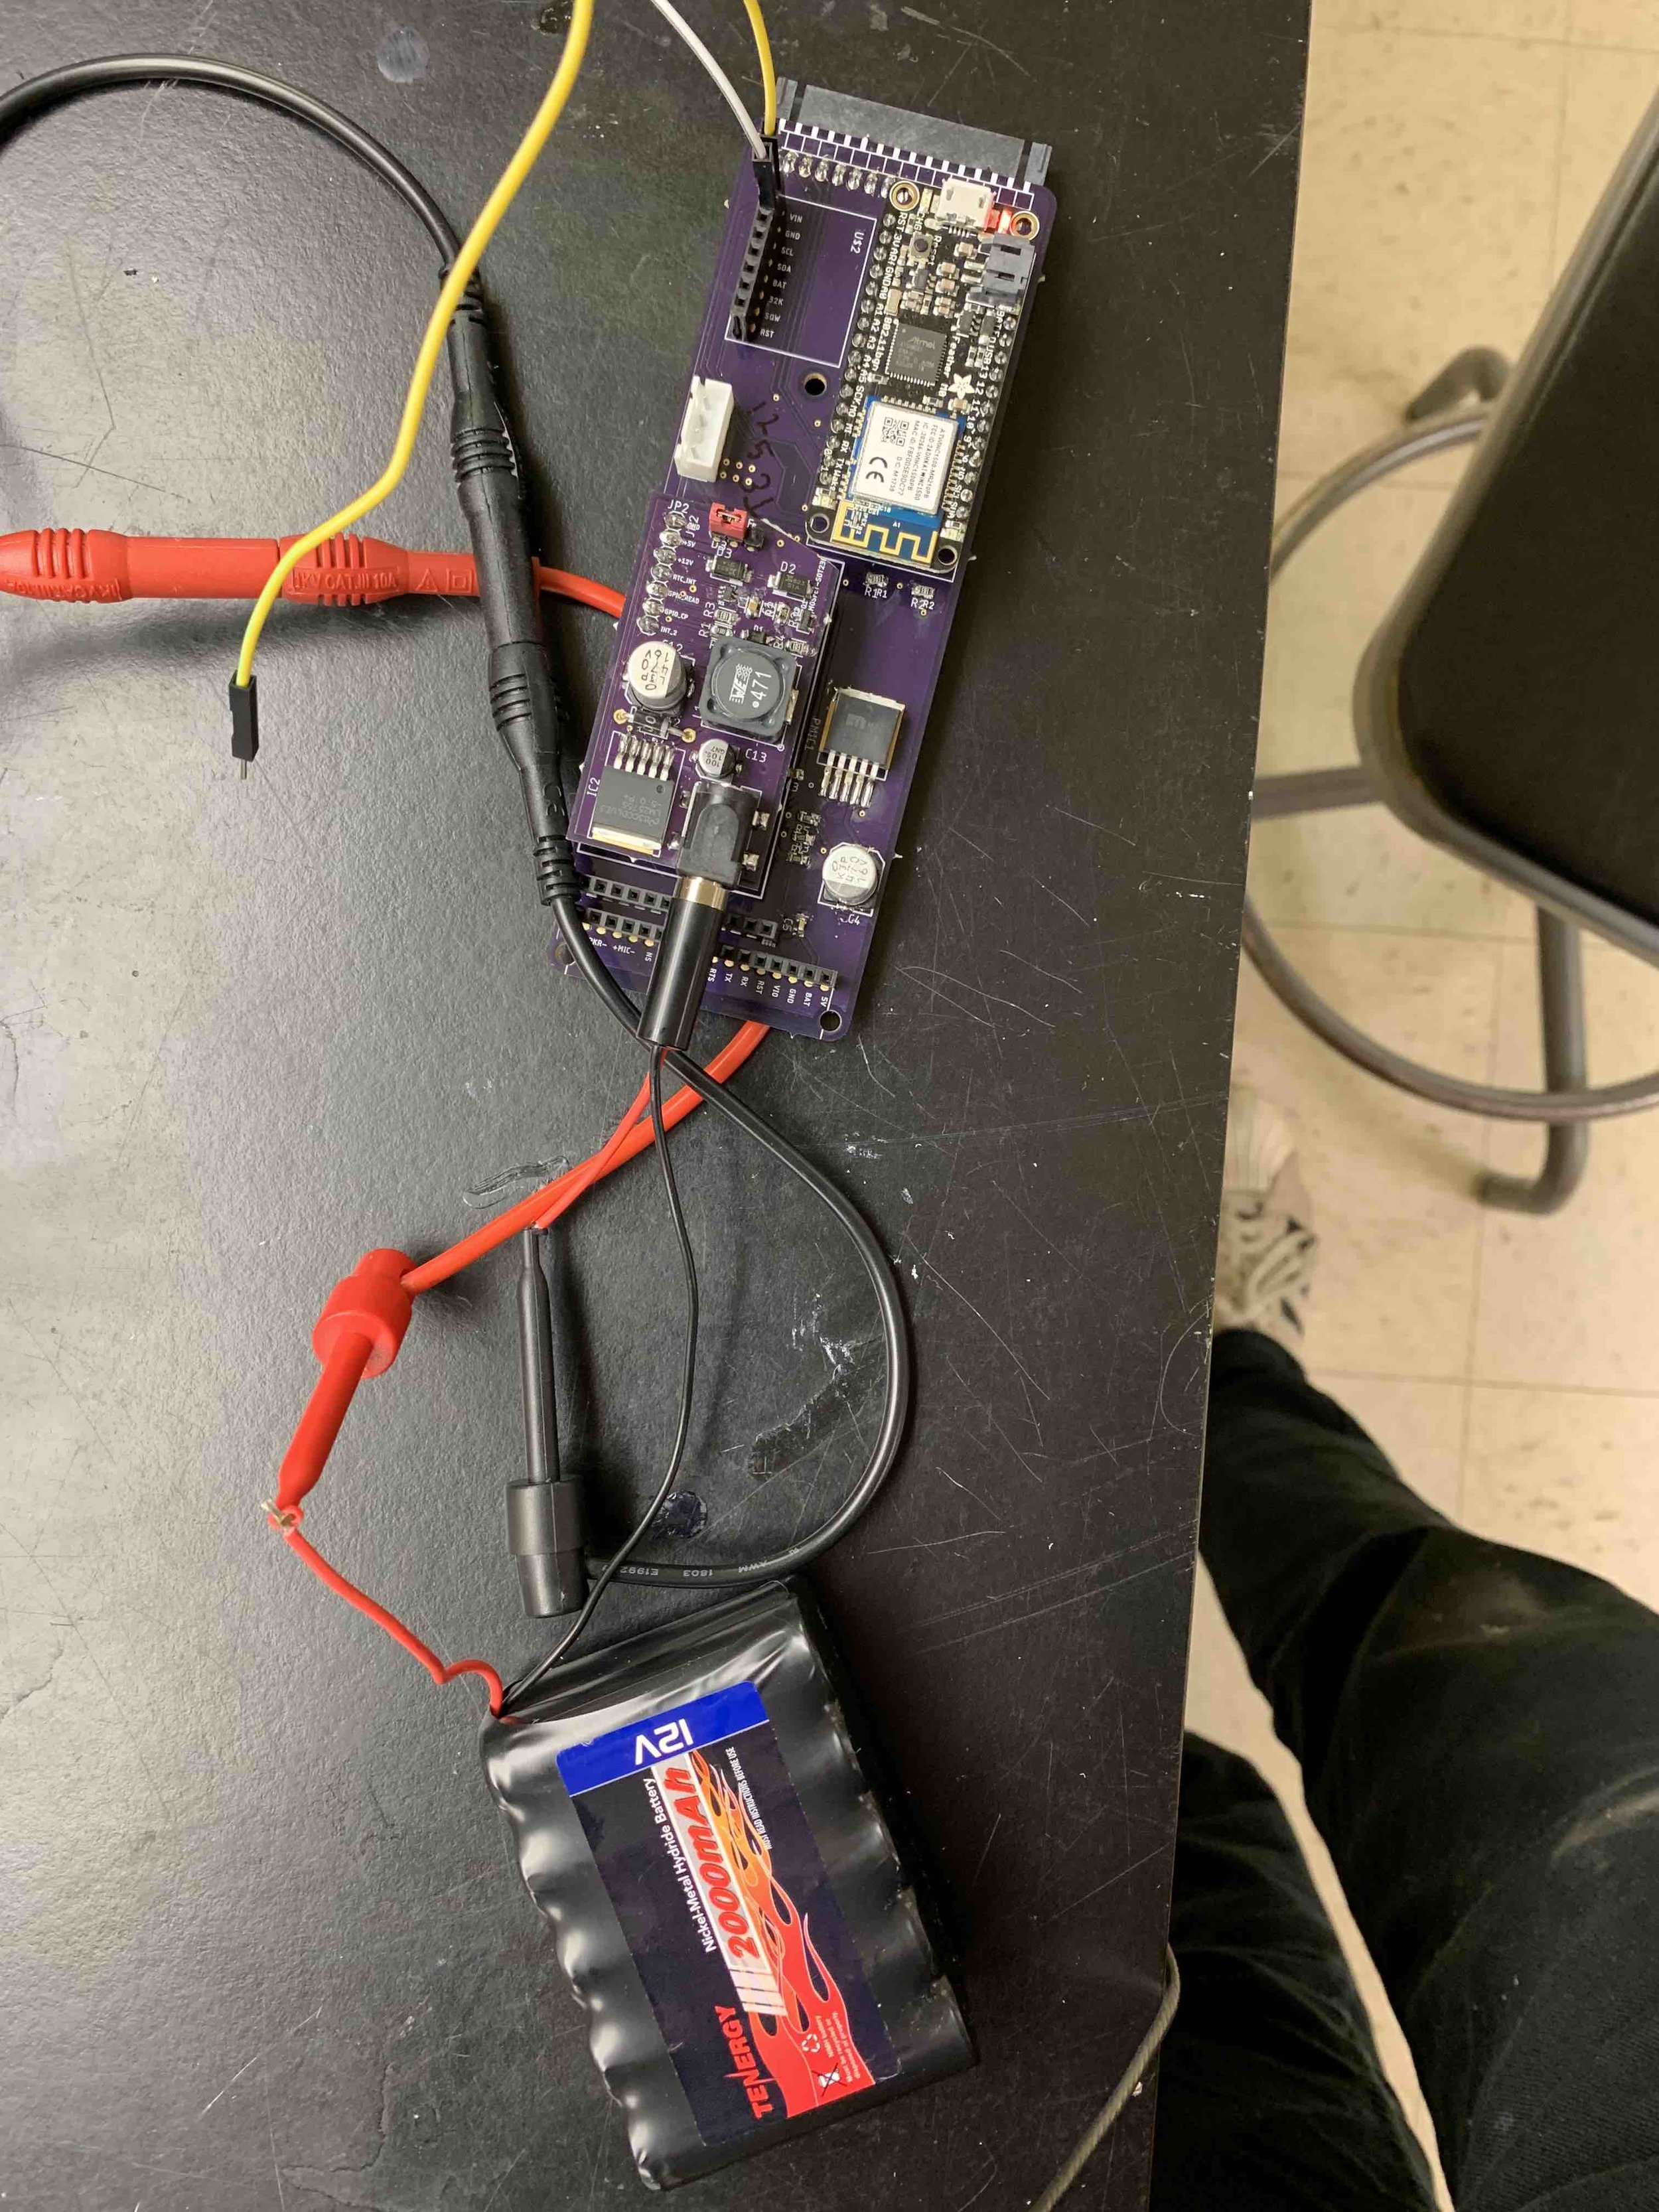
 

Testing

A current draw test was conducted by measuring the current with a multimeter between the battery’s positive lead and the positive input on the power control board. The power control board was attached to the OPEnSampler’s Microcontroller Breakout Board, upon which Adafruit’s Feather M0 Wifi microcontroller was also attached. The microcontroller was programmed ahead of time to simply power its LED upon powering up. One jumper cable was connected to the real time clock’s 3v3 power pin, supplied by the M0, and was temporarily connected to the power control board’s GPIO_CP pin to turn the device off. Another jumper cable was connected to ground and RTC_INT to turn the device on.


Testing.jpgTesting.jpg


The device had a current draw of 22mA when powered on and only 130uA when powered off. When powered by the small 2000mAH, 12v battery used on the OPEnSampler, the device will have a maximum standby battery life of 641 days (not accounting for the battery’s internal leakage current). If the device had used normal sleep methods that can reduce the consumption down to 1.5mA, the maximum standby life would have only been 55 days. With no standby mode at all, the battery life would have been less than four days.


Considerations

An important consideration is that I am not an electrical engineer, nor am I pursuing a degree in electrical engineering. There is much to be improved on this board, and if you have any ideas, or find a bug in its design, you shouldn’t hesitate to contact the OPEnS Lab or leave a comment on this post! Additionally, this was only tested on Adafruit’s Feather M0 Wifi breakout, so your mileage may vary on other boards (especially ones that are not in the Feather M0 family!).


Finally, when using this board it is important to understand that the microcontroller is completely shut down on “standby” mode. This means that after the real time clock wakes the device up, it will start at the setup routine and any variables stored in flash will be erased. Be sure to use non-volatile storage methods for variables that must be saved between power cycles. The OPEnS Power board, for example, includes a small EEPROM chip. Adafruit’s Feather M0 Express includes extra SPI or QSPI flash memory that isn’t erased between power cycles as well.


Conclusion

The primary application of the OPEnS Power Control Board is to increase the battery life of a sensor suite powered by a 12v, 2000mAH battery. This board is capable of dropping the standby current of microcontroller-based projects down to 130 micro-amps. The minimum standby current that could be achieved previously was about 1.5mA based on Adafruit’s tutorial linked previously. The OPEnS Power Control Board increased the theoretical max standby battery life from 55 days to 641 days. The device fully shuts off on standby and wakes up from pulses to either of its two interrupt vectors, one HIGH-TRUE and one LOW-TRUE.

Link to GitHub

DOI

Written by Mitch Nelke, OPEnS Lab OSU

A Review of SLA Printed Bag Caps To Improve Sealing Over FDM Bag Caps

Abstract:

An important feature of the OPEnSampler is the ability to seal the collected water post-sample such that evaporation and contact with the air has a negligible impact on concentrations of minerals and isotopes in the samples. We’ve tried many different options but solid resin-based 3D printed caps proved to be the best option.

This post was drafted but unfinished in late 2017. Because it is still relevant and the conclusion still valid, I finished and posted it with the pictures I took but it is lacking in pictures of the setup and testing.

An SLA Bag Cap, unprocessed, printed by OSU’s Robotics Lab.

The Problem:

Most water samplers leave the sampled bottles open for evaporation and contamination of the samples due to contact with air results in the reduced quality of samples of volatile compounds. To address this weakness, we connected the sample bags through solenoid valves that close to seal the sampled water from outside conditions. As it turns out, this is quite difficult to achieve: FDM printing using spooled filament causes many small defects that result in microscopic holes in the otherwise solid plastic component.


The Causes:

There are many causes of defects in a print. In FDM the most common ones are varying filament thickness, filament that has absorbed moisture from the air, and poor layer-to-layer adhesion.

Filament is created by heating up plastic and pulling it out in a line. How consistently it is heated and pulled directly affect the thickness of the final product. Manufacturers of 3D Printing filament have ways to control for changes in thickness over a certain tolerance, but the tolerance is usually +-3% [source]. Filament with lower tolerances cost significantly more. A change in filament diameter results in a change in extrusion thickness and height, which can impact the way subsequent layers adhere to one another. This variability in extrusion rate can create relatively large holes and cracks in the part, or very thin areas in the wall.

Absorption of moisture from the air is the hardest factor to control. ABS plastic in particular can absorb up to 2% of its weight in water per day [source]. The moisture trapped in the plastic expands rapidly when the filament is heated as it passes through the nozzle. This can cause any size of defect in the form of bubbles on the surface or interior of the component and is unpredictable. We store all our filament in a sealed container with desiccant, but any amount of moisture in the filament is capable of causing microscopic holes or weak points in the final product. These holes are rarely visible and can persist even after heavy vapor-finishing.

To check for microscopic holes, a printed bag cap would be heavily treated with acetone vapor. The cap would be set out for a day to solidify and then attached to a partially filled bag. The bag would be turned upside down. After several seconds, most caps would not show signs of leaking. Many, however, would produce slow drips of water from a seemingly solid surface of the cap, and no hole would be visible. The explanation for the phenomenon was that microscopic holes in the surface allowed a very small amount of water, when under pressure, to pass through the interior of the component and out of the side surface.

Lastly, poor layer-to-layer adhesion can be the result of any number of settings and calibration failures as well as the mechanical failures caused by quality defects described above. Often the biggest factor is a significant temperature gradient across the part as it is built up. This can be seen most frequently when the printer’s bed is not covered. The cover acts to protect the part against drafts and insulates the interior to maintain a consistent temperature well above room temperature. A temperature gradient across the component causes cooler areas to contract while the top layer being printed on is still very hot, warping the print inward and causing the nozzle to print on a non-level surface.

Additional causes of poor layer-to-layer adhesion include rapid cooling of the layer before the next is deposited, large layer heights, or a poorly calibrated printer.

An FDM Printed Bag Cap with an NPT x Compression Fitting attached. It has been post-processed with acetone vapor to smooth the outer surface.

The Solution:

Many solutions were tried. Progress was made in some but the only solution that completely sealed the sample bags was to print the caps on the Form2 (shoutout to OSU’s Robotics Lab!)  in a resin-based Stereolithographic (SLA) 3D printer.

SLA-printed components reduce the inconsistencies caused by heating filament because they do not melt plastic in the process. Instead, a laser with a specific UV frequency polymerizes the liquid plastic in layers, linking chains of plastic molecules together (Formlabs.com). Additionally, solid components are created as truly solid parts rather than solid walls with interior mesh as in FDM printers.

We asked the Robotics Lab at OSU to print us several caps with the same design as those that had been printed on our own FDM printers. To test each bag cap, a bag was filled with water and a cap was screwed on. The through-hole was tapped and an NPT x barbed fitting was screwed into it while a short length of tubing was attached to the other end of the fitting. The tubing was folded and pinched off with a small clamp and the bag was turned upside down and squeezed.

Three FDM bag caps were tested and each leaked through a different position. Four SLA bag caps were tested and only one leaked through the threaded interface between the cap and bag. The leaking SLA cap was found to have significant chipping, almost completely eliminating one-third of the O-Ring groove responsible for sealing this interface.


One of the first bag caps printed had major defects in the O-Ring groove, showcased in the red box.One of the first bag caps printed had major defects in the O-Ring groove, showcased in the red box.

One of the first bag caps printed had major defects in the O-Ring groove, showcased in the red box.

To solve this issue, the remaining 21 caps for the device were printed on their sides (also by the Robotics Lab).


Further Considerations:

While the SLA-printed caps were effective at sealing the bags, they introduced new problems. One of the major issues with SLA caps are how brittle they are – a huge setback when any defects need to be fixed with post-processing. Additionally, the brittle plastic breaks easier when shipping: one cap broke at the interface with the extruded aluminum when the device was flown to the AGU fall conference.

Labs are also less likely to have access to an SLA printer, and even if they did it is a more time consuming process that requires additional post-processing. The cost of resin is also significantly higher than plastic filament.


Conclusion:

SLA bag caps were 3D printed in a successful effort to eliminate leaking found in the FDM alternatives. A Form 2 SLA printer was ordered for the lab and the remaining 21 caps were printed by the Robotics Lab in time for the AGU conference. In the future it could be worthwhile to refine the design and processing of the bag caps such that FDM printed caps seal the bags, but in the meantime this is an effective, repeatable solution.

Author: Mitch Nelke

Redesigning the Bottle Trays

Abstract:

A tray to hold 12 ISCO bottles was previously designed without considering the weight of water when they are filled. The plastic tray was redesigned using Fusion360’s sheet material modeling and static stress simulation tools.

Introduction:

I was recently made aware that the design of the ISCO bottle trays did not consider the weight of the filled bottles (thank you, Azad, for noticing that)! Stresses in bent sheet materials are quite difficult to calculate by hand, so the design process for the new tray, under load, is as follows:

1. Initial Design

2. Perform Computer Simulation

3. Check results for low safety factor and high stress points

4. Redo Steps 1-3 until I am confident in the design


Design:

Let’s go over the initial design:


Screen Shot 2018-01-17 at 10.34.49 AM.pngScreen Shot 2018-01-17 at 10.34.49 AM.png

The ISCO bottles are split into two trays of 12. The constraints are as follows:

– No longer than 740mm long

– No wider than 160mm

– Flat Pattern cannot exceed 2” x 4” dimensions of stock sheet plastic

– Must hold 12kg (about evenly distributed along bottom face)

– Material is .04” (~1mm) PETG

The problem is the open face of the tray. By holding the shape of the tray by two pieces of aluminum extrusion, nearly all the weight of the bottles stresses two sets of M3 screws. Even with washers, the plastic would likely stretch or tear. The design was modified to address these issues.


The new design uses a PETG sheet folded into an open-ended rectangular prism with an overlapping face. This overlapping face includes 6 holes for M3 machine screws and will also be glued together. Two kevlar straps for holding the device, connected on the bottom of the tray and tied with room at the top, are not shown. They will be located 1/3 of the length from either end.


The straps and glue are especially important because they aren’t included in the simulation. Because of them, I can assume that the safety factor for stresses on the sides and top of the tray can be lower than would be otherwise acceptable, since the straps will pull the device from the bottom face.


Simulation:

I performed a Static Stress simulation with a 120N distributed weight along the bottom face. The top face was constrained as “fixed”, and 6 ~M3 bolted connections were added on their respective holes, simulated as pinned connections, to hold the overlapping sides together.


Screen Shot 2018-01-16 at 2.19.30 PM.pngScreen Shot 2018-01-16 at 2.19.30 PM.png

While the result of the simulation appears catastrophic in the above picture, it is important to know that Fusion360 greatly exaggerates displacement by default! The actual displacement should be about 13mm which will look much better. The addition of kevlar straps will likely have a negligible effect on this bottom displacement. Notice in the image below that the max stress is located at the bottom corner of the tray. Because the Yield Strength for PETG plastic is about 47MPa, a stress of 64MPa as shown would lead to stretching and possibly tearing along the edge. However, distributing the weight via kevlar straps along the bottom will minimize the stress along the edges of the tray, greatly improving the safety factor shown in the subsequent image.

Safety factor is the ratio of applied stress over acceptable stress. A SF of 1 or lower means that under static conditions, the component will start to exhibit failure. This will improve greatly by the addition of glue in between the bolted flanges in addition to adding kevlar straps. However, if the tray was accidentally carried from the top face it would potentially break.


Iteration:

To account for additional stresses and accidental carrying methods, I decided to add an additional flange on the bottom that is the same length as the side flange, as shown below.


Screen Shot 2018-01-16 at 2.30.27 PM.pngScreen Shot 2018-01-16 at 2.30.27 PM.png

The results of the new simulation are much more promising:


Screen Shot 2018-01-16 at 2.57.44 PM.pngScreen Shot 2018-01-16 at 2.57.44 PM.png


Screen Shot 2018-01-16 at 2.58.27 PM.pngScreen Shot 2018-01-16 at 2.58.27 PM.png

With the new flanges, the maximum deflection is slightly reduced and the safety factor is well above what is necessary. Because straps will be used rather than holding the tray from the top, the actual safety factor is likely much higher, but the tray is unlikely to break if accidentally picked up by the plastic.


Conclusion:

The new bottle tray was simulated with promising results. Larger safety factors and smaller displacements show that it is less likely to break under greater load, and the addition of straps to support the weight from the bottom will reduce the stress in the sheet plastic and provide the user with a more optimal carrying method.

Shipping the OPEnSampler


IMG_0281.JPGIMG_0281.JPG

The late-summer OPEnSampler is shipping! We’ve come a long way from the foam puck concept with several iterations throughout the process. The team at Zurich will provide us with much needed field and user testing as we add more members to the team working on the firmware and companion software. Packed into the 80QT Pelican Rolling Cooler is the OPEnSampler, batteries and power supplies, spare tubing and bags, and lots of foam and bubblewrap. The sampler we are sending uses silicone tubing and the June 22 board, but samples effectively and reliably. The serial command interface allows the operator to plug in a laptop and tell the sampler when and how to sample, and the operator interface makes initiating the sampling process quite simple.

There is still much more development to be done! The next batch of samplers include many more features described in previous posts, such as GSM communication capabilities, power decoupling and filtering, and additional sensors to control the sampling process. The hard Teflon tubing will increase the quality of the sampled water and the new pumps, once integrated, will allow large-particle suspended sediments to be sampled with ease.

The next step is to update documentation. This has been a weak point in the design process and the changes and timing of one iteration to the next were not always transparent. Considering the purpose of the device is to be shared with the community of water sampling, you can expect more frequent and detailed updates on the designs following this milestone. I will be updating the GitHub page shortly with the latest and greatest .STL part files for our printed parts, documentation, and the new PCB board files. Later on I will be adding assembly instructions and new code will be posted. In the coming weeks there will be two of the new samplers on our lab tables: the bottle sampler and the bag sampler.Stay tuned!

OPEnSampler October 17 Update

Abstract:

Much has happened with the samplers in the past two weeks! There are two categories of updates: those relevant to the Zurich Sampler and those relevant to the new versions of samplers. In short, the frames have been assembled for the new samplers and the PCBs are being soldered up; the new pumps arrived; the final pieces of the Zurich Sampler are coming together and it will be ready to ship very soon.

Updates:

New Sampler Updates:

Frame:

The sample-bag OPEnSampler frame was assembled by Adnan and I the other week and it fits snug in the Pelican 80QT rolling cooler. It fills up quite a bit of the space as intended, and there is extra room on the sides (the thickness of the wheel wells) for ice packs. Before more are assembled I think I will reduce the width of the sampler by about 5mm to account for the wells being slightly convex.

PCBs:

The Main Control Boards arrived the other week along with all the components of the two samplers. They look great! Azad and Adnan are soldering the components to them and will likely finish in a couple weeks.

New Pumps:

The new pumps arrived and we will be testing them soon. It looks proming but we will need to change either the tubing or the tube fittings to work with the rest of the sampler tubing. These will be added to the new samplers Azad and Adnan are assembling.

Android App:

In other news, three students will be working on adding an Android app to receive updates from and control the sampler remotely as their senior capstone project for their majors in computer science. In the coming weeks they will be contributing to the blog by introducing themselves and eventually posting updates on their work on the app.

Zurich Sampler Updates:

Quick Disconnect Fittings:

I finished the design of the endcap on which the two quick disconnect fittings are mounted and it is currently printing. Designing the endcap was more of a challenge than I initially predicted due to the awkward nature of the barbed fittings and the Pelican’s small outlet port. Because the threaded outlet on the Pelican cooler is too small to fit two fittings side-by-side, the endcap was designed in two pieces that would clamp together with an o-ring and three M2 screws. The male fittings can be threaded through the front panel with an o-ring to mitigate airflow. The sampler tubing can be pushed through the main body of the endcap while it is disconnected from the front panel, and then attached to the barbed ends of the fittings. The main body is then screwed onto the Pelican’s outlet port and the front panel is attached to the main body via M3 screws and nuts, completing the assembly. Intake tubing is attached to the intake fitting via the female quick disconnect fitting.

Filter:

The optional filters were quite easy to integrate into the design. The filter mesh is 470 micron stainless steel from Grainger with open ends. The front of the intake is blocked with a simple 3D-printed plate and the other end is blocked with another plate with a compression fitting screwed into it. All components of this assembly are glued with “ABS paste”, a solution of dissolved ABS plastic filament in acetone. The paste acts to weld the plastic components together.

Operator Interface:

The new Operator Interface turned out quite well. It consists of a 12V barrel jack port for powering the device with either a battery or a voltage regulator, a power On/Off switch, an enable switch for changing sampler modes (field use vs lab testing), an interrupt override button for initiating sampling in the field and also for lab testing, and a USB type B socket for communicating to the Arduino with a laptop. The panel is 3D printed and slides into the 15mm extrusion.

Conclusion:

There’s a ton of development happening on the OPEnSampler and I’m excited to showcase the new design once the two new samplers are completely assembled. In the coming weeks we will ship out the OPEnSampler for the first time, I will update the gitHub page with the latest designs and bill of materials, the capstone students will introduce themselves on this blog, the new pump will be tested, and the new samplers will be fully assembled.

Choosing a Different Peristaltic Pump


newpump screenshot.pngnewpump screenshot.png

Abstract:

An alternative to the previous Honlite 1000mL/min peristaltic pump was required: our department cannot buy from Aliexpress or Alibaba, and Honlite only sells their pumps on those sites. Luckily, I found a 24DC, 2200mL/min pump for $99 on Amazon! Let’s discuss why this is a big deal and how it will work.

Discussion:

Peristaltic pumps generally come in two categories: cheap with a low flow rate, and extremely expensive with a high flowrate. Perform a simple google search for “high flow rate peristaltic pump”, and you’ll quickly realize why the first design tried to get away with two $12 pumps in parallel. On top of this, high flow rate pumps often require greater supply voltages or even an AC current not compatible with the current electronics. 

The 2200 mL/min pump, despite its 24VDC rating, has a very affordable price for the specs. The 2200 mL/min is over 4 times the minimum requirement of 530 mL/min, based on the EPA’s recommended line velocity of 60cm/s or greater (source) and our chosen tube ID of 0.17” or 4.3mm. The manufacturer, in an answer to a customer’s question, said the user should expect their pump’s flow rate to increase linearly with supplied voltage. Based on this, we could expect the pump to provide a flow rate of roughly 1100 mL/min when powered from our system (12VDC). 

Other Considerations:

The new pump comes with barbed fittings on either end of its soft tubing that are too large for the teflon tubing ID of 0.17”. Barbed x Compression fittings are an awkward, hard to find (possibly non-existent) kind of fitting so instead a Barbed x Barbed reducing fitting should be purchased. US Plastic doesn’t stock anything close to what we need, but two of these 3/16” x 3/8” stainless steel fitting from KegWorks should do the trick since 3/16 is 0.1875.

Assembly Day 1


20170926_095157.jpg20170926_095157.jpg

Abstract:

Azad and I spent part of the morning assembling the frame of the bottle-based OPEnSampler. I found quite a few changes I will make when assembling the next sampler. In the end we found the device didn’t quite fit in the duffle bag and so some machining will need to be done to reduce a couple dimensions.

Assembling:

The assembly of the frame was a simple but tedious process. There were only a few unique parts: two different lengths of 15mm square aluminum extrusion, aluminum brackets, M3 screws, and M3 square nuts. The aluminum extrusion was cut by the manufacturer to specified lengths to skip right to the assembly stage. Azad and I each assembled an end face and attached a long extrusion, though it would have been easier to attach all the long extrusions to one face first and then attach the other face afterwards.

We found that attaching all the brackets at once to an extrusion resulted in sliding and flopping brackets while joining the opposite end to the frame; I’ll be sure to write the instructions so that brackets are attached only when necessary to avoid headaches. If that was unclear, most of the problems can be summarized as not attaching brackets when we should have attached them. 

Fitting into the Bag:

Unfortunately I failed to dimension the frame to fit into the bag opening, which is slightly smaller than the bag space itself. Additionally, the height and length of the sampler were a bit too large to fit in the space anyways, so tomorrow I will have to disassemble the frame and head down to the machine shop to reduce a couple dimensions. Luckily it is easier to reduce the size of the device than to expand it, and there seems to be plenty of space for the bottles if I remove the ice tray from the design.


IMG_0213.JPGIMG_0213.JPG


IMG_0214 2.JPGIMG_0214 2.JPG

Investigating a Solenoid Valve’s Strong and Weak Orientations


IMG_0200.JPGIMG_0200.JPG

Abstract:

We observed our $1 solenoid valves were failing under low pressure conditions. After some investigation and testing, we found we could safely orient the valves in  to ensure the flush valve will fail first while the sample valves will form quite strong seals when closed. This solution allows us to continue to use the cheaper valves and keep our cost of materials down.

Introduction:

Cost is a limiting factor when choosing components for the OPEnSampler. There are many repeat components, including the 24 sample containers, 52 compression fittings, 25 feet of tubing, 32 aluminum brackets, 16-20 pieces of aluminum extrusion, and 26 solenoid valves. Increasing the cost of any of these by several dollars would increase the total cost of materials by $100 to $200, depending on the component. We chose cheap $1 solenoid valves from AliExpress with this factor in mind, knowing the next best alternative were adafruit’s $7 solenoid valves. It turns out, however, that our $1 solenoid valves are quite weak and fail under normal use conditions due to the water pressure from the pump. Luckily, the solution was quite simple.

Explanation:

Solenoid valves open and close the flow of water with a linear actuator that pushes out or pulls in. In cheap normally-closed solenoids a spring holds the actuator out, pressing an o-ring against the face of the inlet as a seal. When current passes through the solenoid, the actuator pulls in against the spring and water is allowed to pass from inlet to outlet. The diagram below, taken from dyxminipumps.com, shows how our $1 valve’s inlet and outlet (openings A and B, respectively) are perpendicular to each other.


dyxpump diagramdyxpump diagram

Using A as the inlet and B as the outlet, the valve will fail under quite low pressures. This is because the actuator is only blocking flow because of the force of the small spring; a small pressure from a pump only has to surpass the force of the spring to force the actuator backwards, opening flow from A to B. Orienting flow in the reverse direction, however, yields different results. Any pressure applied from opening B acts perpendicular to the motion of the actuator, neither adding nor subtracting from its closing force. In this orientation the valve will stay closed under very high pressures and a pressure buildup will cause other components of the water line failing first, such as the tubing popping out of fittings. This is quite undesirable in the normal application of these valves, such as in coffee machines, but we can take advantage of the failure behavior of the two orientations for the OPEnSampler.

By directing flow in the sample valves from B to A they will stay closed in the event of a pressure buildup, maintaining the integrity of the samples by preventing cross contamination. If the flush valve is oriented opposite, from A to B, it will be the weakest point in the water line and will fail first, effectively becoming a pressure relief valve for the system so that the water is released out the drain before fittings break. 

This was tested in the lab by connecting the outlet of the pump directly to each of the valve’s openings in turn and running until failure. The pump ran for two minutes without valve failure while B was connected as the inlet and A the outlet, but failed after a few seconds in the A-B orientation.

Conclusion:

The sample valves will be oriented with flow from B to A and the flush valve will be oriented A to B. By taking advantage of the failure conditions of each orientation we can continue to use the cheap $1 valves without worrying about their low-pressure rating. This not only reduces further design work and prototyping but also saves about $150 per unit compared to the $7/piece alternative.

Choosing a Peristaltic Pump

Abstract

There are currently two pumps to choose from for the OPEnSampler: a low flow rate, unknown-precision peristaltic pump and a high flow rate, “low precision” pump. They have their pros and cons and this writeup will discuss the angles of attack for deciding which one is more appropriate for our system.

Specs:

The WMC Pump has the following specs:

  • 12V DC 400mA
  • 297 mL/min flow rate, among other lower flow rate options
  • 5mm Viton Tubing, among other options
  • Barbed Fittings

The Honlite Pump has the following specs:

  • 12V DC 1.2A – 3.2A
  • 1100 +- 8% mL/min flow rate
  • Tygon Tubing, among other options
  • Compression fittings for 1/4” OD tubing, among other options

Discussion


WMC Pump Head

The WMC pump has been tested on our prototype system and has proven to be reliable and true to its specs. It can reliably pump 250mL/min of water at zero net suction head, which is about three times as fast as our previous dual-pump system. Despite such an improvement, the flow rate is still quite low for attaining representative samples of suspended sediments, such as fine-grain sands [source]. A flow rate of 530+ mL/min is required to reach the EPA’s recommended 60 cm/s minimum line velocity for such sampling where the flow of the analyte heavily relies on the mass and specific gravity of the particulates [source]


Honlite Peristaltic PumpHonlite Peristaltic Pump

Honlite Peristaltic Pump

The Honlite pump from AliExpress has yet to be tested however the manufacturer supplies more specifications than the WMC pump. The defining characteristic of this pump is its 1100 mL/min flow rate at 12VDC, almost 4 times the rated flow rate of the WMC pump and twice the minimum recommended flow rate for sampling suspended solids. Some downsides are its high variance in flow rate of 8%, though further testing of the WMC pump could prove this is not an usual variance, and further testing of the Honlite pump could prove this variance is controllable. The pump head only has two rollers (three is standard) and so the rhythm of the pump could be noticeable, but will quite likely have a negligible effect on the sample quality.

One method of fixing the inconsistency of any pump used is to add a flow rate meter in series with the pump line. This flow rate meter can catch when the pump is struggling or increases its velocity significantly and adjust the PWM control of the pump driver chip, effectively increasing or decreasing the voltage supplied across the pump to account for the change in flow.

Conclusion:

Both pumps cost around $65 (the Honlite pump costs $30 with $35 shipping to the US) so reliability and flow rate are the most significant factors. Neither pump states its maximum suction head, though almost all peristaltic pumps seem to have a maximum suction head greater than 5m. This is why the Honlite pump was chosen for the Q4 2017 design, but several WMC pumps will be purchased as backups in the event we find the Honlite product to be faulty.

It is quite difficult to find a peristaltic pump with a sufficient flow rate for such a low cost and this is the primary source of skepticism for using the Honlite pump. How are they able to achieve such a large flow rate without increasing cost? The answer could be they are mass producing these pumps in a highly efficient system, or perhaps their pumps are not as reliable. Consistency in sample volume may not be a large concern, however an inconsistent sample volume is almost exclusively caused by a varying velocity of sampled water in the tubes. This varying velocity can certainly lead to varying turbidity and suspended solids measurements [source] [source], and so consistency is a huge factor in choosing a pump.


Reviewing the Diameter and Material of OPEnSampler Tubing

Intro

The EPA recommends a flow rate of 2 ft./s or greater to minimize the relative difference in velocities of suspended sediments. They also recommend a tubing diameter of 1/4 in. as well, but not for a particularly well documented reason. One unanswered question brought up in the design review meeting was the impact of tubing diameter on the quality of water samples. This short writeup discusses some of the considerations involved in the decision to use 1/4” OD Teflon tubing for future sampler designs.


Design Considerations

A paper published in 1985 collected some data on this subject [link to paper]. It discusses several trials where different concentrations of dissolved organic compounds were passed through tubing of varying diameters and materials at a known rate. The concentrations of the passed solutions were measured and recorded.

There are two obvious factors involved: the tubing absorption rate and friction. Absorption is based on contact time, tubing area, tubing material, and the analyte. Absorption is not a concern in suspended sediments but is critical when the analyte is dissolved carbons and gases. Contact time is based solely on flow rate. 

The friction coefficient is decided by the material and the force of friction will be proportional to the tubing diameter and flow rate. The force of friction will reduce the flow rate of the sample water, increasing contact time between the tubing wall and the sample water. Lower flow rates also reduce the accuracy of suspended sediment sampling where particle mass is a dominating factor that creates a differential velocity between the particulate sizes, shown by this study [link] mentioned to me by Dr. Babbar-Sebens.

The results of the experiment suggest the diameter of the tubing has a lesser effect than the material of the tubing on absorption rates for inner diameters between 1/4” and 1/2”, however increasing the tubing diameter decreases the absorption rate for the same material. This effect is unexplained in the paper and the relationship between tubing diameter and sample quality has very little research behind it. It is likely that the largest factor in choosing the tubing diameter is the maximum particulate size of suspended sediments, which requires a minimum diameter cross section throughout the entire hydraulic system including the solenoid valves and pump tubing. 

Both the study mentioned above and this other study [link] show that teflon tubing absorbs the lowest proportion of dissolved organics. The EPA in this paper [link] also suggest that a high velocity decreases the slime buildup against the inner surface. 


Conclusion

Because large suspended sediments (1mm+ diameter) are beyond the scope of the current sampler, Teflon tubing with a .17” ID and .25” OD will replace the current 3/16” ID Silicone tubing. Compression fittings will have to be used rather than barbed fittings. The change in diameter of the tubing will increase the velocity significantly and the teflon tubing will have much lower coefficient of friction, improving small particulate movement in sample water. Teflon tubing will be nearly impermeable to gases and will absorb extremely low amounts of dissolved compounds in the sample water, making it ideal for most of our intended applications, such as sampling for dissolved organics or volatile isotopes.