Peer Reviewed Publication

Author: Tom DeBell

The Hub Finds a Global Audience

Since my last blog post, the Hub has been making its rounds to conferences and demos from interested parties.

The Hub made its first conference appearance at the American Geophysical Union at the Fall meeting in 2017 in New Orleans, LA and again this past winter at the AGU meeting in Washington DC. In Novermeber of 2018 the first academic peer reviewed draft of the OPEnS Hub paper was sent in to the Frontiers in Earth Science special topics section.

Today I am proud to announce that the Paper has been accepted for publication and is currently being typeset! A link to the abstract can be found here.

I can’t wait to see where this project goes from here and I am happy to have been a part of its creation.

Cheers

Tom DeBell

Sleeping Beauty; Low Power, RTC’s, and Sleeping Processors. – A guided walkthrough

By: Tom DeBell

Abstract

As our production of open source devices with a variety of sensors continues to roll out, it is of the utmost importance to try and make these devices as power efficient as possible in order to conserve battery life. The solution is simple, using a variety of adafruit and SparkFun libraries such a LowPower.h, RTClib and a custom RTClibExtended. However, the problem at hand is the compatibility and settle discrepancies between the processors we are using and how they interface with these libraries. This post will serve as a walkthrough on how to work with these power saving libraries with the latest 32u4 and M0 processor boards as well as integrating this logic into Arduino UNO projects.

Methods

I think the best place to start off is a diagram of what a template program using sleep functionality should look like. Below is flow chart of sorts of how your program should be set-up in order to follow the structure of the example code included with this guide.


Sleep-RTC Logic Diagram (1).jpgSleep-RTC Logic Diagram (1).jpg

*Important note, any delays or program functions should be contained within a conditional statement in the wake flag routine. *

Using Pin Interrupts

Often times the simplest way to conserve battery is to put the processor to “sleep” which causes the device to enter a lower power state where it is no longer constantly checking all peripherals or running any processes. However, the most common (and simplest) way to wake a processor is to specify an interrupt pin. An interrupt pin is a specified digital or analogue pin that is expecting an interrupt signal (typically rising or falling voltage). An interrupt is a signal that tells the processor to immediately stop what it is doing and handle some high priority processing, in our case WAKE UP! Below is a brief breakdown of the different syntax used to initialize an interrupt pin on the 32u4 and M0 Adafruit processors boards as well as a basic Arduino.

Arduino Uno

– use A0 pin as an interrupt (using attachInterrupt function as laid out in the code provided)

Example Code:

32u4

– Use SleepWake32uPCINT

Example Code:

M0

– Use SleepWakeMoInt

Example code:

Using the DS3231 Real Time Clock to Send an interrupt signal

Note: There are two types of alarm styles (Wake up once daily, or after a certain elapsed time) included in the RTClibExtended library, Both are included in the linked sketches.

Arduino Uno

– use RCTSleepWakeUseIntA0

Example Code:

32u4

– use SleepWake32u4RTCPCINT

Example Code:

 M0

– use SleepWakeMoRTCInt

Example Code:

Conclusion

After looking at three of the most common processor boards and how to establish Pin interrupts and RTC interrupts, this tutorial should greatly increase the power efficiency of our future projects.

Tom DeBell

First Look at The Data

Abstract

Over the last two months, our OPEnS Data logging hub in the HJ Andrews forest has relayed over 100,000 data points to our Google Spreadsheet through the transmission protocol below. This post will provide a brief look at some interesting trends found within our dataset.


Data Transmission DiagramData Transmission Diagram

Objective

The Objective of this post is to look at some POI within our data set including some interesting plots of data during the Great North American Eclipse.

Data

After collecting data points every 5 minutes for a little over two months we were fortunate to begin looking at the wealth of valuable data we had collected. As I began to analyze specific areas of the data that I found interesting, I was able to see some pretty fascinating trends that one would expect to see such as the Inverse relationship between relative humidity and temperature. I then began exploring other trends within the data and found that although some trends were expected some were not.


Graph showing the inverse relationship of relative humidity and temperature Graph showing the inverse relationship of relative humidity and temperature 

It became clear after looking at the load cell data (well after all water we added to the system would have evaporated) that there was a periodic fluctuation much greater than any residual noise would account for. When plotted alongside daily temperature, it was clear that fluctuations were temperature dependant and we deducted that the exposed aluminum force gauge was expanding with high afternoon temperatures and contracting with colder overnight lows. This behavior visible in the graph below.


Our data is not without its issues, We found our load cell (evaporation mass) data was greatly compromised by the thermal expansion properties of the aluminum rod throughout daily temperature fluctuations.Our data is not without its issues, We found our load cell (evaporation mass) data was greatly compromised by the thermal expansion properties of the aluminum rod throughout daily temperature fluctuations.

All issues aside, we were able to capture some pretty remarkable data during the Great North American Eclipse on August 21st, the below plot focuses on the point of totality, and how this event altered the standard linear trend of light intensity increase throughout a morning with a very steep fallout in both the Infared and Full spectrum light intensity. This anomely can be viewed below.


Light Intensity Data during the Total Eclipse 8/21Light Intensity Data during the Total Eclipse 8/21

Conclusions

After briefly looking at the data from this spreadsheet it clear that a more in-depth analysis will be required to really gain an understanding of the relationships and trends within the data set. However, even at a glancing look, it is clear from the strain gauge and temperature relationship will be a major consideration in the redesign and further models of our sensor suites.

-Tom DeBell

Picking the Right Feather for You

Abstract- The 32u4 or the M0

As our projects continue to evolve alongside with the advances of technology it is important to keep the OPEnS lab up to date with the latest and greatest prototyping technologies at our disposal. There is no example greater than that of the microprocessor. This post will explore two of the most advanced, widely available microprocessors on the market today.

Background and Objective

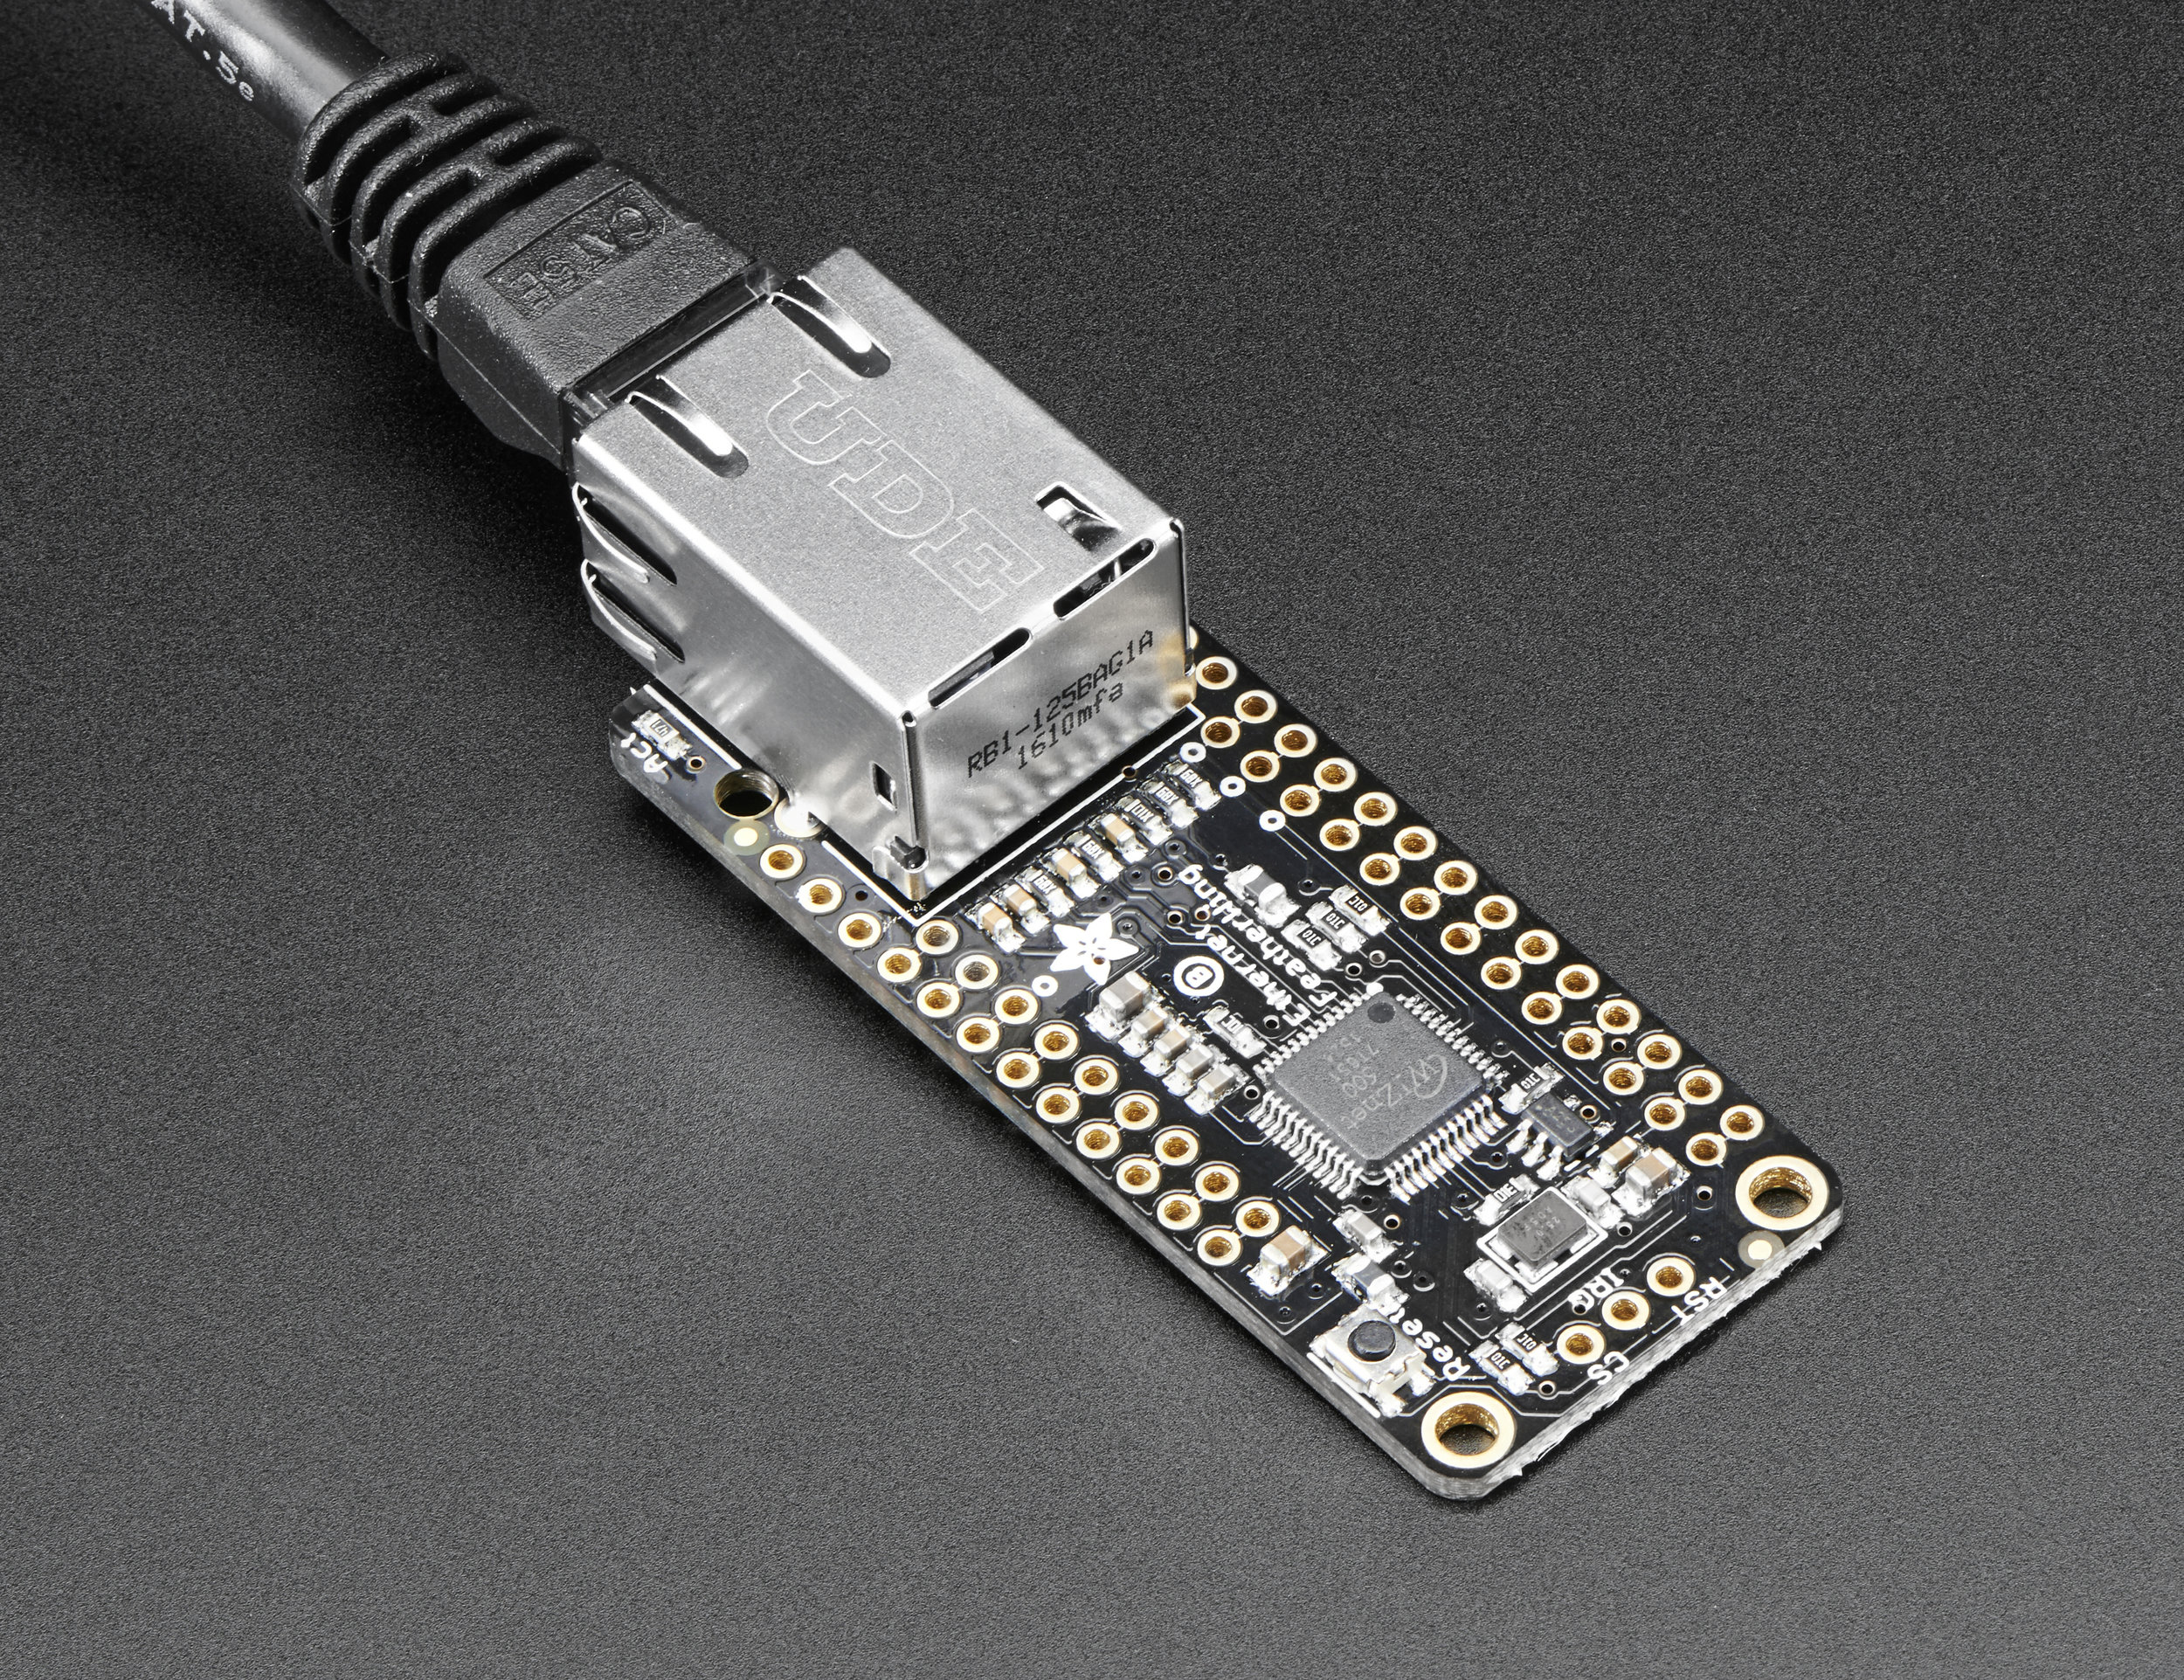
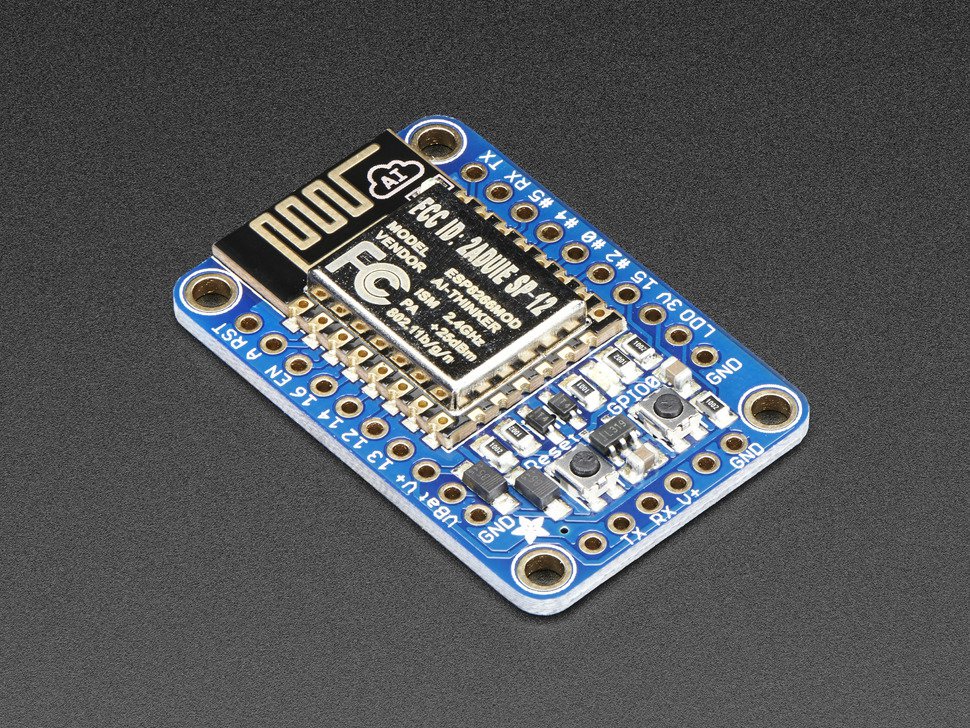
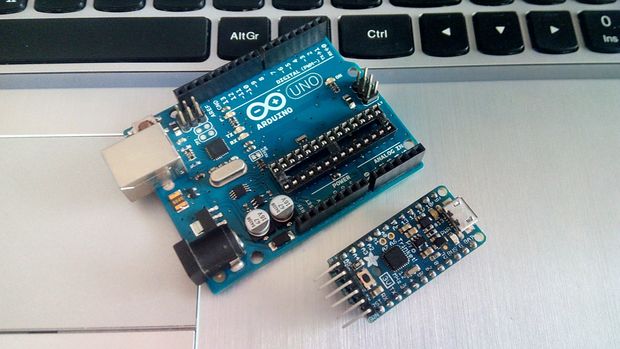
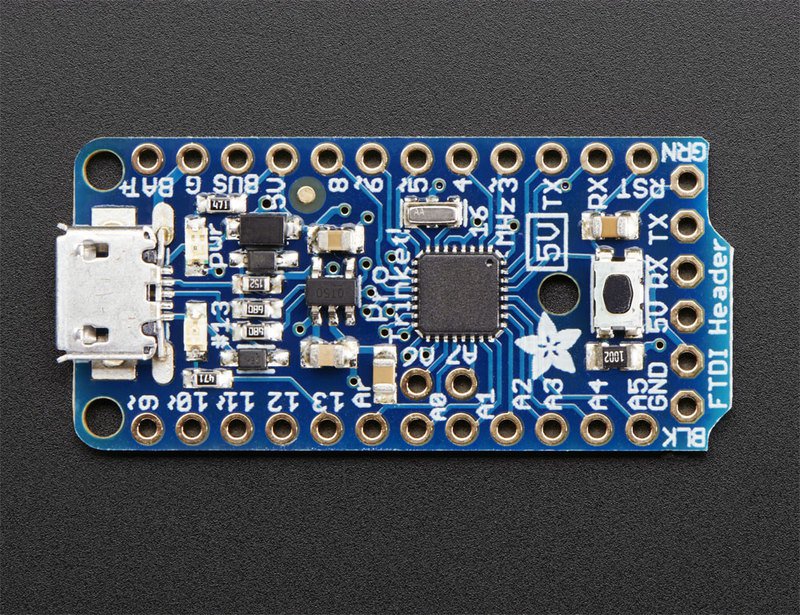
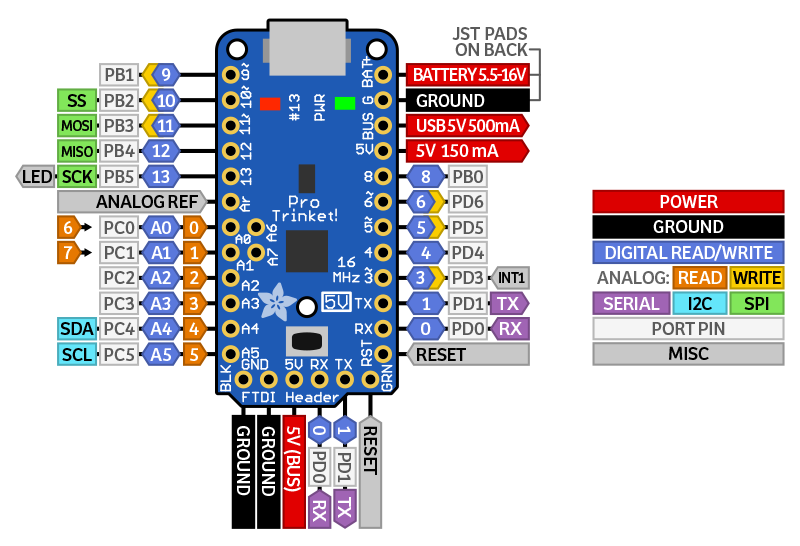
Since 2010 the Arduino Uno has been the standard in prototyping electronics due to its wide variety of functions, ease of programming, and cost. However, much like any other piece of technology it is becoming outdated by faster, smaller and cheaper microprocessors such as the pro-trinket model released in 2014. (A previous article I wrote linked here highlights the key advantages of the Trinket over the Uno.) Fast forward to early 2016 to the release of adafruits most current line of development microcontrollers, called “Feathers” with a host of companion shields referred to as “Featherwings“, where these processor boards now come integrated with certain features such as WiFi connectivity, Bluetooth, LoRa radio and Shields that allow for RTC data logging, Ethernet connectivity and various display interfaces. The Objective of this article is to discuss the two major types of processors used within the Feather line of microprocessors.

Materials and Methods

Featherwing 32u4 v.s Featherwing M0

Which is best? Well, it depends on a host of things. To begin let’s start with a side by side comparison with specs, cost and common troubleshooting problems that I and others in the maker community have encountered. Differences I found especially imporant are denoted with an *.

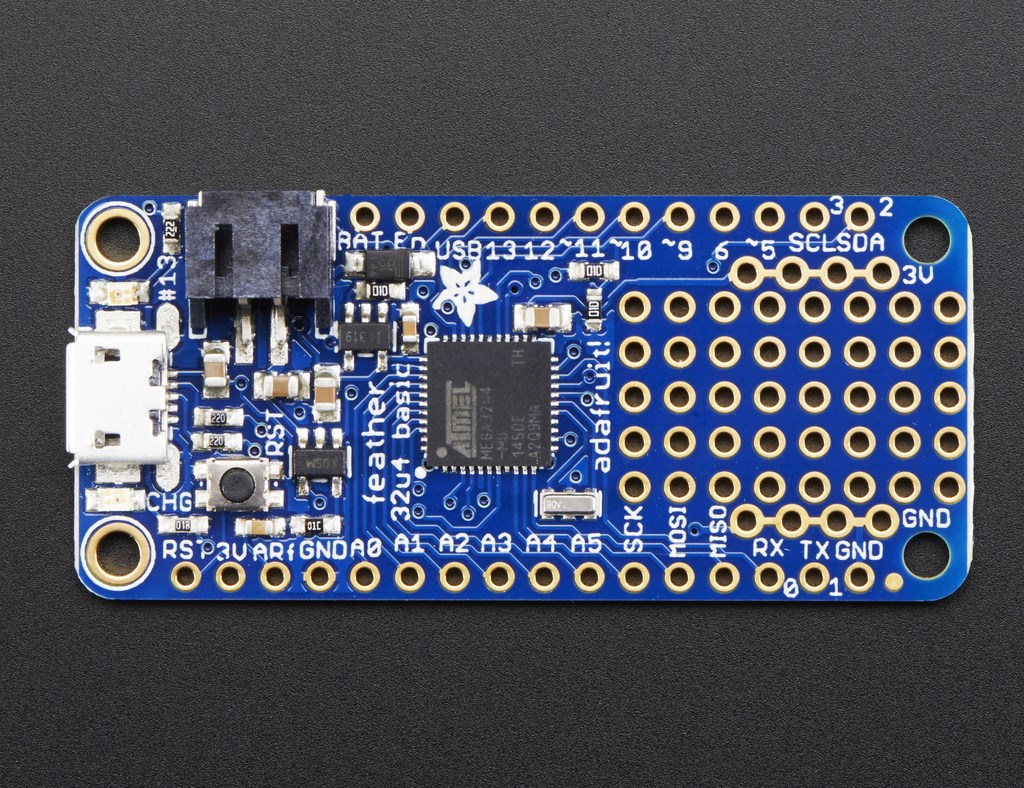
At the Feather 32u4’s heart is at ATmega32u4 clocked at 8 MHz and at 3.3V logic, a chip setup that has long been tried and tested. This chip has 32K of flash and 2K of RAM and is very comparable of that of a basic Arduino Uno (excluding the use of EEPROM memory).

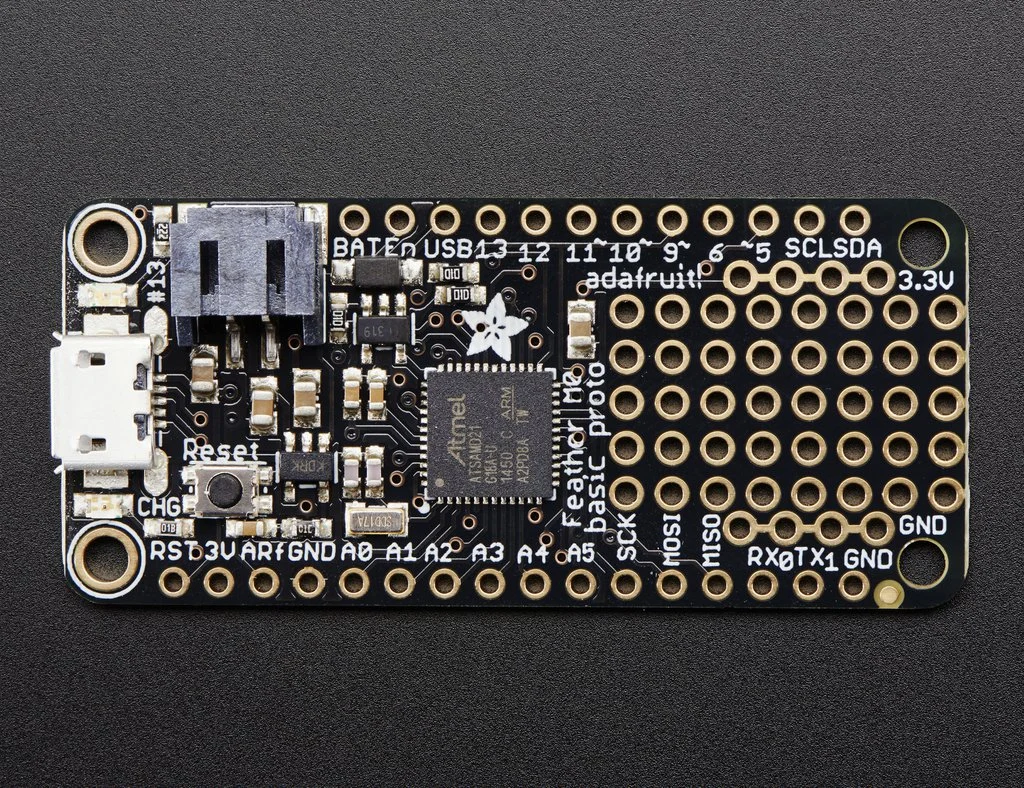
At the Feather M0’s heart is an ATSAMD21G18 ARM Cortex M0 processor, clocked at 48 MHz and at 3.3V logic, the same one used in the new Arduino Zero. This chip has a whopping 256K of FLASH (8x more than the Atmega328 or 32u4) and 32K of RAM (16x as much)!

Specs


ATmega32u4.jpg

Programming with the M0: The Basics Proto

  • Cost: 19.95 from Adafruit (Price equivalent only on Basic Proto Model)
  • Measures 2.0″ x 0.9″ x 0.28″ (51mm x 23mm x 8mm) without headers soldered in
  • Light as a (large?) feather – 4.6 grams
  • ATSAMD21G18 @ 48MHz with 3.3V logic/power*
  • 256KB of FLASH + 32KB of RAM*
  • No EEPROM
  • 32.768 KHz crystal for clock generation & RTC
  • 3.3V regulator with 500mA peak current output
  • You also get tons of pins – 20 GPIO pins
  • Hardware Serial, hardware I2C, hardware SPI support
  • PWM outputs on all pins
  • 6 x 12-bit analog inputs
  • 1 x 10-bit analog ouput (DAC)
  • Built in 100mA lipoly charger with charging status indicator LED
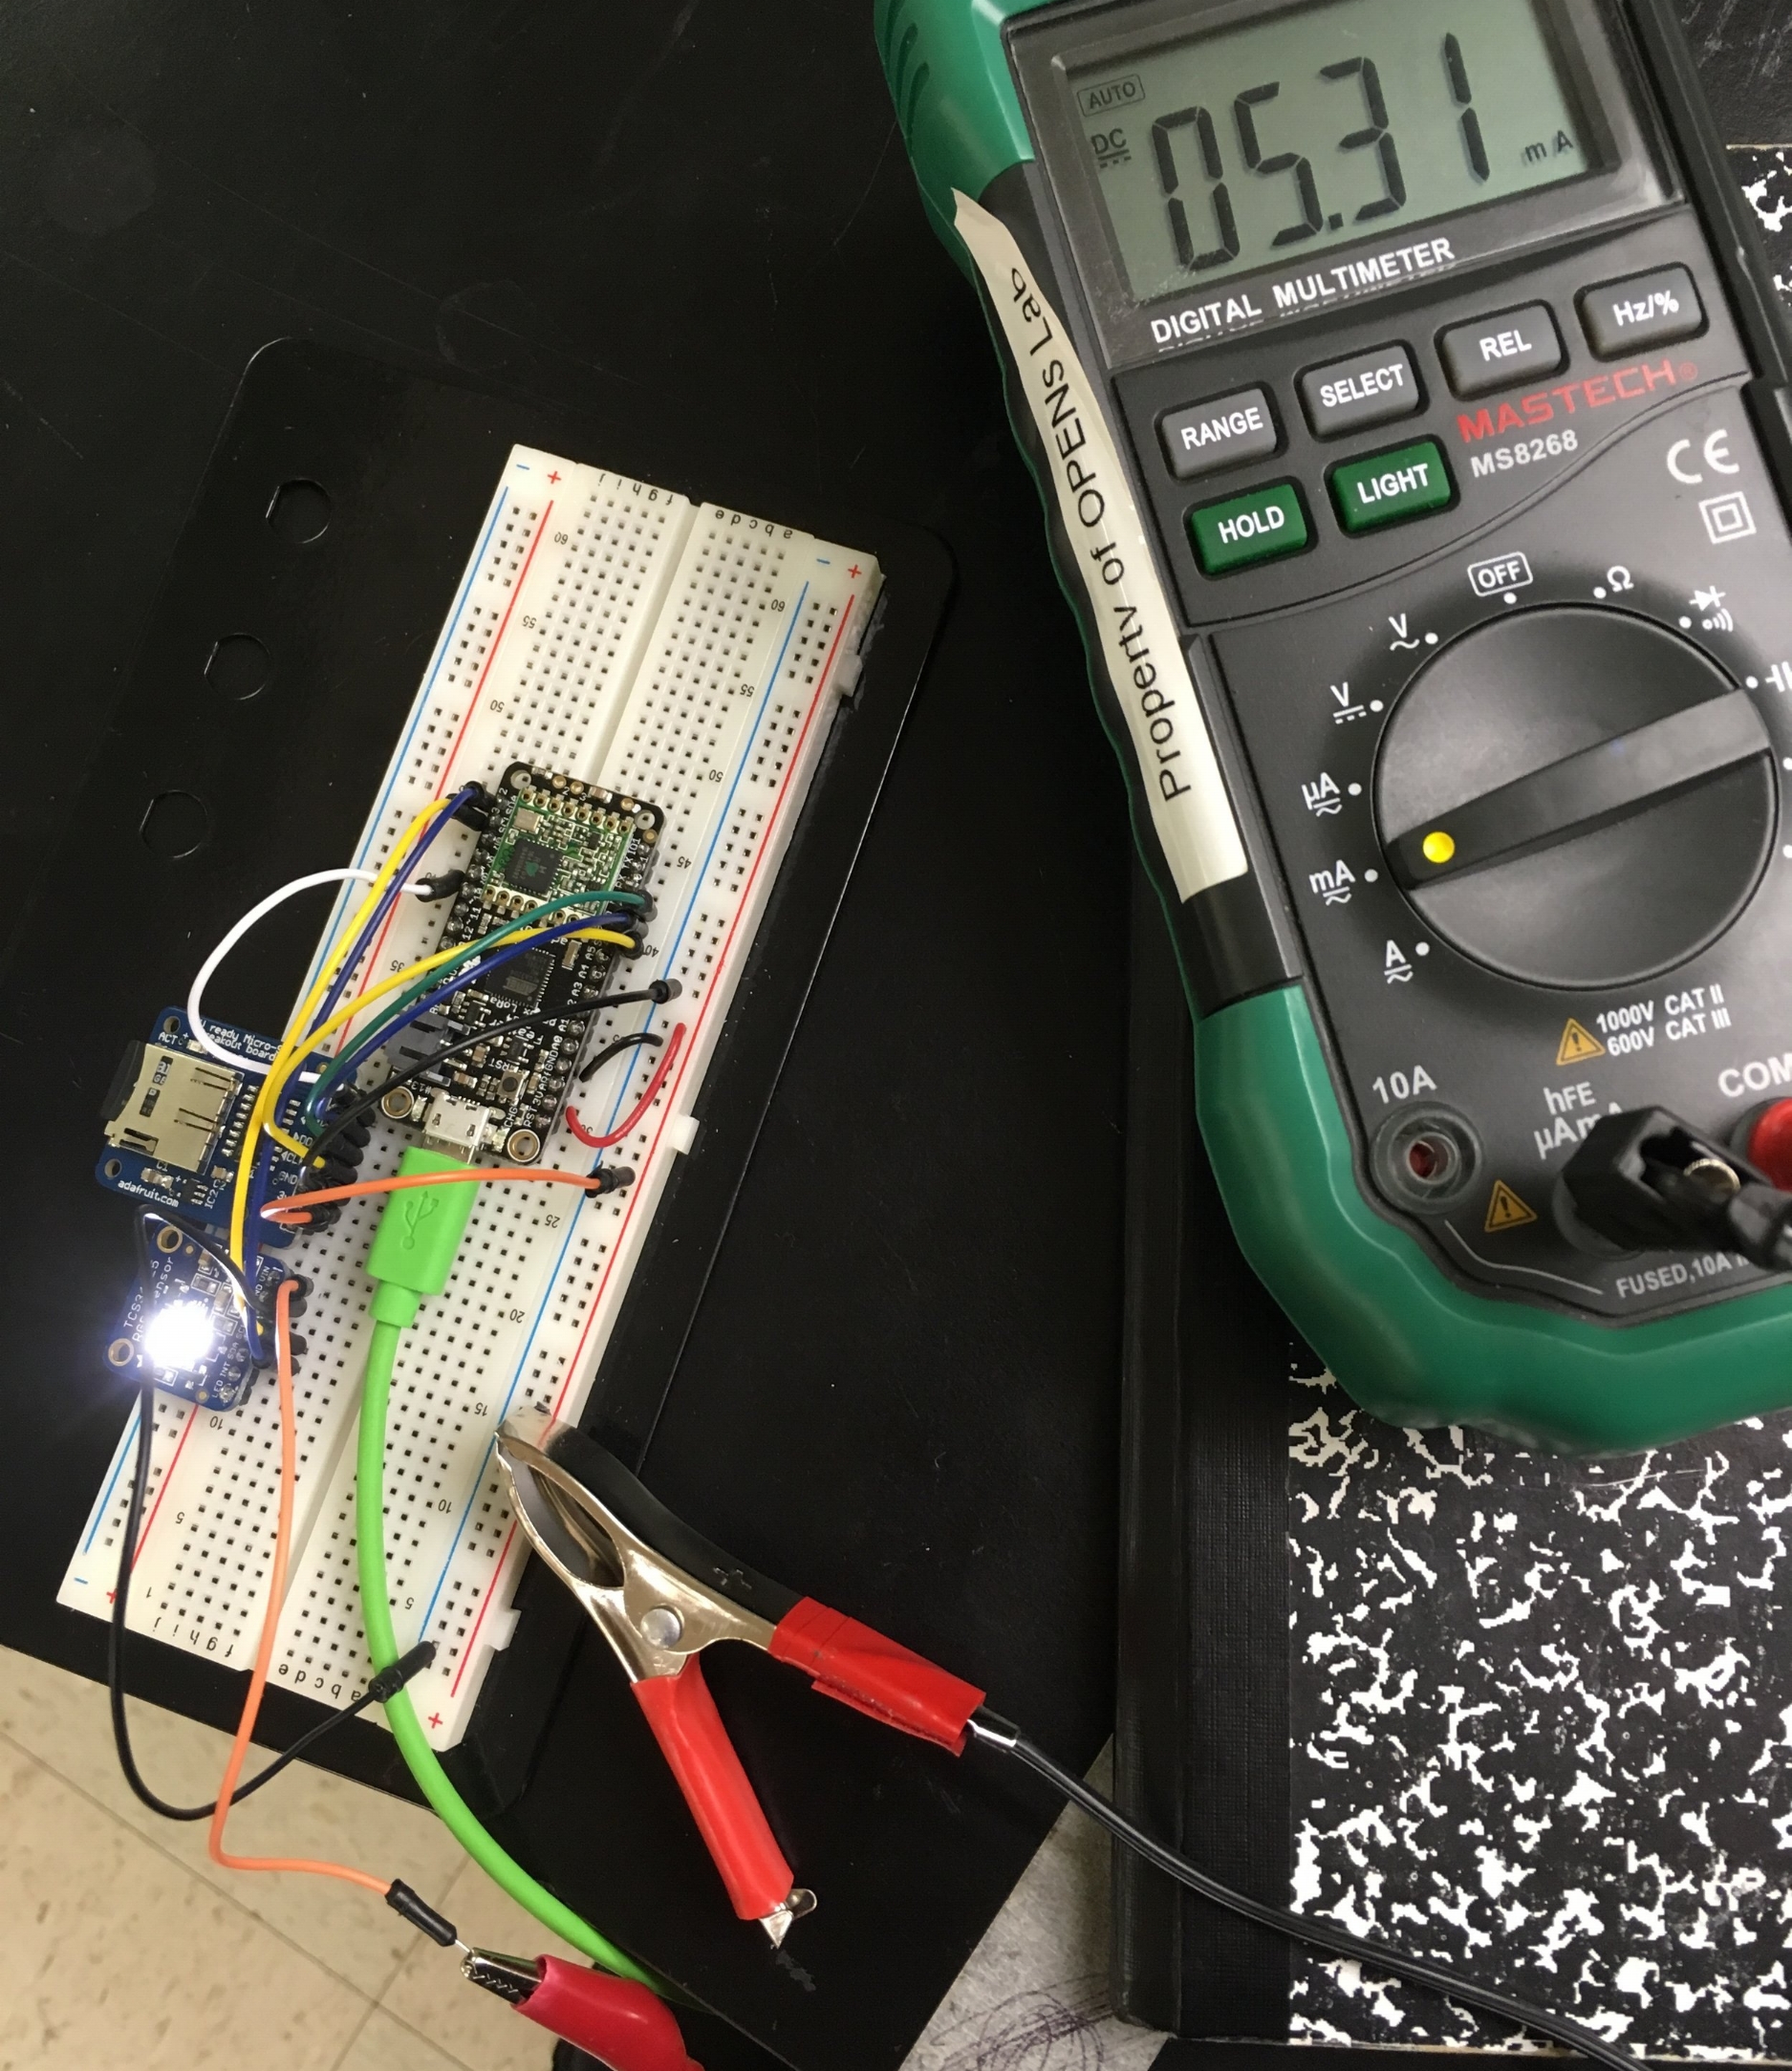
  • Higher sustained current draw to processor*
  • Power/enable pin
  • Reset button

Programming with the 32u4: The Basic proto  

  • Cost: 19.95 from Adafruit
  • Measures 2.0″ x 0.9″ x 0.28″ (51mm x 23mm x 8mm) without headers soldered in
  • Light as a (large?) feather – 4.8 grams
  • ATmega32u4 @ 8MHz with 3.3V logic/power*
  • 32K of flash and 2K of RAM*
  • 3.3V regulator with 500mA peak current output
  • You also get tons of pins – 20 GPIO pins
  • Hardware Serial, hardware I2C, hardware SPI support
  • 7 x PWM pins
  • 10 x analog inputs (one is used to measure the battery voltage)
  • Built in 100mA lipoly charger with charging status indicator LED
  • Pin #13 red LED for general purpose blinking
  • Power/enable pin
  • 4 mounting holes
  • Reset button
  • Long Battery Life*

From a purely technical perspective, it is clear that the ATSAMD21G18 ARM Cortex M0 processor is a superior processor in nearly every regard. However, running such a robust processor comes at the cost of power consumption which is likely an important factor in the design of whatever project you are looking at.

Ease of use and support

While specs are an important aspect to consider when selecting which type of feather you are going to work with another key component is the technical support available for the device. Like any new piece of technology, these adafruit products are not without their pitfalls, manly in the support of preexisting header libraries. I have found in my personal experience that the 32u4 model of the feather which uses an older processor found in many Arduino products has much more firmware support and has the ability to repurpose existing Arduino sketches much easier than with the M0.

The ATSAMD21G18 ARM Cortex M0 processor is much newer and more robust, which comes with the issue of not YET having support for many of adafruit and Arduino libraries. However, if your project doesn’t rely on interfacing with pre-existing technology or have dependencies on the old software you will probably be fine.

Discussion

In short, if you are doing projects that otherwise would have been prototyped on a device like an Arduino that doesn’t require a lot of processing power or large complicated scripts and battery consumption is of importance, the best choice would be the Feather32u4.

For more sophisticated projects that don’t require a lot of external dependencies, and for those with a strong background in computer and microprocessor programming, the feather m0 with ATSAMD21G18 ARM Cortex is a workhorse that allows for some pretty sophisticated programming with an abundance of memory and processor speeds.

Troubleshooting Some Common Problems

I “did something” and now when I plug in the Feather, it doesn’t show up as a device anymore so I cant upload to it or fix it…

No problem! You can ‘repair’ a bad code upload easily. Note that this can happen if you set a watchdog timer or sleep mode that stops USB, or any sketch that ‘crashes’ your Feather

  1. Turn on verbose upload in the Arduino IDE preferences
  2. Plug in feather 32u4/M0, it won’t show up as a COM/serial port that’s ok
  3. Open up the Blink example (Examples->Basics->Blink)
  4. Select the correct board in the Tools menu, e.g. Feather 32u4 or Feather M0 (check your board to make sure you have the right one selected!)
  5. Compile it (make sure that works)
  6. Click Upload to attempt to upload the code
  7. The IDE will print out a bunch of COM Ports as it tries to upload. During this time, double-click the reset button, you’ll see the red pulsing LED that tells you its now in bootloading mode
  8. The Feather will show up as the Bootloader COM/Serial port
  9. The IDE should see the bootloader COM/Serial port and upload properly

– Tom DeBell

Evaluating the TCS34725

Abstract:

An RGB light sensor we evaluated for use in the Evaporometer project.  This sensor measures RGB, color temperature, lumens, and visible light spectrum, and has features that currently aren’t useful for our project, but are still worth documenting in this post.

Setting up the sensor:


Screen Shot 2017-09-08 at 1.03.33 PM.pngScreen Shot 2017-09-08 at 1.03.33 PM.png

The TCS34725 was connected to an Adafruit Feather 32u4 using traditional I2C, although the RGB breakout features an additional port for a RGB LED to mimic the RGB values read by the sensor.  More on the full functionality can be found on Adafruit’s website here.  An SD card breakout was also connected to store the RGB, color temperature, lumens and visible light spectrum values.  


A sensor right next to the white LED reads the RGB values of light reflected by different objects. A sensor right next to the white LED reads the RGB values of light reflected by different objects. 

A sensor right next to the white LED reads the RGB values of light reflected by different objects. 

Testing the sensor:

For this test we were most concerned with measuring RGB values.  Color could be read by reading the different colored light that was reflected by an object. A built in white LED is used to present a consistent light source for the sensor to use.  This white light must be powered on in order to produce readings and RGB readings can only be made when objects are touching or placed directly in front of the sensor.  Our test sketch, which can be used on Adafruit and Arduino dev. boards exists here.


With the LED light powered on, the TCS34725 requires 5 mA of power to operate, making it an unfavorable candidate for long term deployment.With the LED light powered on, the TCS34725 requires 5 mA of power to operate, making it an unfavorable candidate for long term deployment.

With the LED light powered on, the TCS34725 requires 5 mA of power to operate, making it an unfavorable candidate for long term deployment.

Evaluation of the TCS34725:

After testing Adafruit’s TCS34725 and running a current test, it was clear that the functionality and power needs of this sensor were not what we were looking for on the Evaporometer project.  

A significant amount of power would be needed to read the RGB values and such data would be virtually useless in spacious outdoor areas.  While lux, color temperature, and the visible spectrum could be used to compare data with our Evaporometer’s TSL2591 sensor, it also makes sense to integrate a second TSL2591 sensor or conduct a side-by-side comparison of the two sensors to see if programming the TCS34725 to only measure lux values requires less power than the TSL2591.


UPDATE: A Closer Look at TCS34725 Functionality

As I mentioned at the end of the previous section, I thought this sensor could be useful to us so long as we disabled the RGB color reading functionality and shut off the white LED to save power.  After some digging around in the TCS34725 data sheet and TCS34725 library I learned a lot more about the full functionality of this neat light sensor – like many Adafruit sensors, this RGB sensor is capable of entering a low power mode that drastically reduces current consumption by only reading RGB color info at specified times.  Unfortunately, I also found that forgoing measurement of RGB values also makes it impossible to calculate Lux (lumens per square meter).  In this version of the TCS34725 library, lux calculations are derived from the RGB values of the light sensor, however this comment in the source code suggests that this may change: 


Screen Shot 2017-09-15 at 1.13.14 PM.pngScreen Shot 2017-09-15 at 1.13.14 PM.png

The developers suggest using the clear (C) measurement to find lux – hypothesizing that doing so may improve accuracy.  While the clear value is also measured in the same function that measures RGB values, it is possible an updated version of the calculateLux function and a well timed interrupt could also get the job done (using more power than our preferred IR/Full light sensor). 

– Marissa Kwon, URSA and NSF Grant Summer Student Researcher


Some Useful Diagrams Illustrating Evaporometer Processes

Author: Marissa Kwon

Abstract: 

So far we have used this series of blogposts to discuss a lot of the technical details about how certain processes are happening within the Evaporometer Transmitter and Receiver.  A series of diagrams has been made to help visualize how everything comes together.  First will be a diagram showing how all the sensors are connected to the Feather 32u4 and battery, followed by two flowcharts illustrating how abstract environmental conditions are transformed into the data logged in our spreadsheet.

Evaporometer Transmitter Connections:


Transmitter_diagram.pngTransmitter_diagram.png

Pictured above is a very simple assembly diagram for the Evaporometer Transmitter.  Notice that many of the devices have the same yellow and blue colored lines – these are the serial clock and data lines respectively and they are all hooked up to the same pins on the Feather.  The red and black lines represent power and ground, and all devices must be connected to these nodes in order to receive power.  In real life, the power and ground rails exist along the far edges of a protoboard or breadboard so that all the device wires do not need to be crammed into one small area.

Flowcharts Following the Progression of Evaporometer Data:

Sensors turn information collected from the environment into quantifiable values such as integer and float values that eventually get passed on to the receiver and logged onto a spreadsheet where we can see them online.  The diagram below shows how data moves from one component to the next through the Evaporometer Transmitter. Each labeled point on the flowchart indicates where the data must undergo at least one change before being able to proceed to the next.


Screen Shot 2017-08-28 at 3.14.36 PM.pngScreen Shot 2017-08-28 at 3.14.36 PM.png

Although it may seem like a fairly simple process, the sensor data must undergo several transformations before it can reach its destination on the spreadsheet. The integer and float values collected by the sensors must be turned into strings so they can be concatenated into one long packet of data.  Now as a single piece of information, the string is cast into an array of 8-bit characters so that it can be transmitted and received using the LoRa components built into our micro-controllers.  When the message is received it must also be broken back into the same pieces before it was concatenated and able to be cast back into the float or integer values.  To do this we add a comma as a delimiter placed in between data points during concatenation, and once it is received we use use strtok() to divide up our character array at the location of the commas to separate the packet back into different pieces of data.

The diagram below illustrates each process that takes place in the transmitter, starting with data collection right after the RTC alarm wakes it up.


Screen Shot 2017-08-24 at 4.57.31 PM.pngScreen Shot 2017-08-24 at 4.57.31 PM.png

– Marissa Kwon, URSA and NSF Grant Summer Student Researcher

Data Logging Using The Ethernet Featherwing.

The Birth of The OPEnS HUB

Abstract

For the past several weeks the primary focus of myself and the other undergraduate researchers at the OPEnS Lab has been to get a working, deployable prototype of an Evaporometer (link here) sensor for use for a partner research group. This project required numerous data transmission protocols and untimely it is our hope to add remote data-logging capabilities using the Ethernet Feathering.  


Our Ethernet Featherwing Shield integrated with the Adafruit  FEATHER 32u4 RFM95   LoRa   Radio  board. Our Ethernet Featherwing Shield integrated with the Adafruit  FEATHER 32u4 RFM95   LoRa   Radio  board. 

Our Ethernet Featherwing Shield integrated with the Adafruit FEATHER 32u4 RFM95 LoRa Radio board. 

Objective

The goal of this project is to establish a means of remotely data logging sensor data to a google sheet via the Ethernet Featherwing shield and the third party cloud based API, PushingBox. For more on how to set up the google sheet and PushingBox service please see a previous project I did using the ESP8266 WIFI chip found here

Materials and Methods

The key components required for this project  were 1) the Ethernet FeatherWing Shield , 2) The Adafruit FEATHER 32u4 RFM95 LoRa Radio – 915 MHz (or Feather board of preference), 3) an authorized Ethernet port with access to the internet, 4) Ethernet cable, 5) Solder, Header pins, and basic electronic skills, 6) and of course a computer with the Arduino Integrated Development Environment (Latest Version downloadable here). 


Bare Ethernet Featherwing ShieldBare Ethernet Featherwing Shield

Bare Ethernet Featherwing Shield


More About the Featherwing

The Ethernet FeatherWing plugs into any Feather (all in one microcontroller made by Adafruit, more info here)  and adds hard-wired networking. To make it as cross-platform compatible as possible, the board is set up using SPI, plus one extra configurable pin. This Ethernet option allows for a strong reliable connection to the internet and can allow for fast, real-time updates via any wired access point. 

Results/Discussion

Preliminary testing of the Ethernet Featherwing showed promising results, however more testing and code modification will be needed in order to log data to google sheets using Domain Name Servers. However, below is some sample code used to determine if a connection has been made to the internet using Adafruit servers. 

  1. /*
  2. Web client
  3.  
  4. This sketch connects to a website (http://www.adafruit.com)
  5. using an Arduino Wiznet Ethernet shield/FeatherWing.
  6.  
  7. created 18 Dec 2009
  8. by David A. Mellis
  9. modified 7/14/2017
  10. by Tom DeBell, For use in the OPEnS Lab
  11.  
  12. */
  13.  
  14. #include <SPI.h>
  15. #include <Ethernet2.h>
  16.  
  17. // Enter a MAC address for your controller below.
  18. // Newer Ethernet shields have a MAC address printed on a sticker on the shield
  19. byte mac[] = { 0x(), 0x(), 0x(), 0x(), 0x(), 0x() };
  20. // if you don’t want to use DNS (and reduce your sketch size)
  21. // use the numeric IP instead of the name for the server:
  22. //IPAddress server(74,125,232,128); // numeric IP for Google (no DNS)
  23. #define URLHOST “www.adafruit.com” // name address for Adafruit (using DNS)
  24. #define URLPATH “/testwifi/index.html” // url to grab
  25.  
  26. // Set the static IP address to use if the DHCP fails to assign
  27. IPAddress ip(192, 168, 0, 177);
  28.  
  29. // Initialize the Ethernet client library
  30. // with the IP address and port of the server
  31. // that you want to connect to (port 80 is default for HTTP):
  32. EthernetClient client;
  33.  
  34. unsigned long lastConnectionTime = 0; // last time you connected to the server, in milliseconds
  35. const unsigned long postingInterval = 10L * 1000L; // delay between updates, in milliseconds
  36. // the “L” is needed to use long type numbers
  37.  
  38. //#define WIZ_RESET 9
  39.  
  40. #if defined(ESP8266)
  41. // default for ESPressif
  42. #define WIZ_CS 15
  43. #elif defined(ESP32)
  44. #define WIZ_CS 33
  45. #elif defined(ARDUINO_STM32_FEATHER)
  46. // default for WICED
  47. #define WIZ_CS PB4
  48. #elif defined(TEENSYDUINO)
  49. #define WIZ_CS 10
  50. #elif defined(ARDUINO_FEATHER52)
  51. #define WIZ_CS 11
  52. #else // default for 328p, 32u4 and m0
  53. #define WIZ_CS 10
  54. #endif
  55.  
  56.  
  57. void setup() {
  58. #if defined(WIZ_RESET)
  59. pinMode(WIZ_RESET, OUTPUT);
  60. digitalWrite(WIZ_RESET, HIGH);
  61. delay(100);
  62. digitalWrite(WIZ_RESET, LOW);
  63. delay(100);
  64. digitalWrite(WIZ_RESET, HIGH);
  65. #endif
  66.  
  67. #if !defined(ESP8266)
  68. while (!Serial); // wait for serial port to connect.
  69. #endif
  70.  
  71. // Open serial communications and wait for port to open:
  72. Serial.begin(115200);
  73. delay(1000);
  74. Serial.println(“\nHello! I am the Ethernet FeatherWing”);
  75.  
  76. Ethernet.init(WIZ_CS);
  77.  
  78. // give the ethernet module time to boot up:
  79. delay(1000);
  80.  
  81. // start the Ethernet connection:
  82. if (Ethernet.begin(mac) == 0) {
  83. Serial.println(“Failed to configure Ethernet using DHCP”);
  84. // no point in carrying on, so do nothing forevermore:
  85. // try to congifure using IP address instead of DHCP:
  86. Ethernet.begin(mac, ip);
  87. }
  88.  
  89. // print the Ethernet board/shield’s IP address:
  90. Serial.print(“My IP address: “);
  91. Serial.println(Ethernet.localIP());
  92. }
  93.  
  94. void loop() {
  95. // if there’s incoming data from the net connection.
  96. // send it out the serial port. This is for debugging
  97. // purposes only:
  98. if (client.available()) {
  99. char c = client.read();
  100. Serial.write(c);
  101. }
  102.  
  103. // if ten seconds have passed since your last connection,
  104. // then connect again and send data:
  105. if (millis() – lastConnectionTime > postingInterval) {
  106. httpRequest();
  107. }
  108.  
  109. }
  110.  
  111. // this method makes a HTTP connection to the server:
  112. void httpRequest() {
  113. // close any connection before send a new request.
  114. // This will free the socket on the WiFi shield
  115. client.stop();
  116.  
  117. // if there’s a successful connection:
  118. if (client.connect(URLHOST, 80)) {
  119. Serial.println(“connecting…”);
  120. // send the HTTP PUT request:
  121. client.println(“GET ” URLPATH ” HTTP/1.1″);
  122. client.println(“Host: ” URLHOST);
  123. client.println(“User-Agent: arduino-ethernet”);
  124. client.println(“Connection: close”);
  125. client.println();
  126.  
  127. // note the time that the connection was made:
  128. lastConnectionTime = millis();
  129. }
  130. else {
  131. // if you couldn’t make a connection:
  132. Serial.println(“connection failed”);
  133. }
  134. }

Below is a screenshot of what the Serial Monitor should print out fallowing a successful test.


Successful Internet Connection Test!Successful Internet Connection Test!

Successful Internet Connection Test!

Future of Project

More updates will be posted here once a connection to Google Sheets has been made. 


– Tom DeBell, Beginning/Continuing Researcher Support Program Researcher

Working with the “Internet” for the Internet of Agriculture

Abstract

WiFi Data Logging

For the last few weeks I have been working on using an Arduino Uno and a couple different ESP8266 WiFi modules for the purpose of  logging sensor data in real time to a Google sheet and develop a network Gateway for all of our sensor devices.


The  ESP8266  WiFi Module. The IOA's internet!&nbsp;The  ESP8266  WiFi Module. The IOA's internet!&nbsp;

The ESP8266 WiFi Module. The IOA’s internet! 


Hazzah!  Breakout board variation of the ESP8266 Chip which eliminates the need for wire wraps, external voltage regulation,&nbsp;&nbsp;and has expanded communication capabilities.&nbsp;Hazzah!  Breakout board variation of the ESP8266 Chip which eliminates the need for wire wraps, external voltage regulation,&nbsp;&nbsp;and has expanded communication capabilities.&nbsp;

Hazzah! Breakout board variation of the ESP8266 Chip which eliminates the need for wire wraps, external voltage regulation,  and has expanded communication capabilities. 

The ESP8266 WiFi Module is a self contained SOC with integrated TCP/IP protocol stack that can give any microcontroller access to a WiFi network. The ESP8266 is capable of either hosting an application or offloading all Wi-Fi networking functions from another application processor. This function is most important for this particular project and will be used as gateway to log data straight to the internet.

Methods

Working around Secure Connections

Google Forms requires a secured connection (SSL) but the Arduino (Or autonomous huzzah board) doesn’t have enough power/memory to create SSL connections. We will use a third party Application program interface, PushingBox to work around this. 

PushingBox API is really simple in concept and in practice.  To launch a “scenario” of notifications you can send an HTTP request . The only argument you should attach is the DeviceID (details on how to find this found below in a link) . This is the unique key that identify the scenario you want to launch. The DeviceID can be found on the Scenario Page.You can also put more arguments to define customs notifications text using your own variables which is what we will do to allow sensor data to be uploaded to a google sheet.

This allows PushingBox to confirm the secure connection needed for google to begin passing on data uploaded from the Arduino. All this in real time. A more indepth explanation of this process can be found in a Hackster.io tutorial found here

Setting up the Google sheet

Another important aspect of this project was to prepare the google spreadsheet for the data it is about to receive. This is done in a google G-script (similar to java) and the instructions on how to do this can be found here.  This step is a bit technical and requires some patience while working through.

Data, Links , Projects, and References

Wiring and other example projects the OPEnS lab has worked on  can be found here.


Original ESP8266 setup running through an Ardiuno Microcontroller.&nbsp;&nbsp;Original ESP8266 setup running through an Ardiuno Microcontroller.&nbsp;&nbsp;

Original ESP8266 setup running through an Ardiuno Microcontroller.  

***Important note***

If you are using the older ESP8266 chip it is important to have an external voltage regulator. (This problem was resolved in the Hazzah board which contains an internal voltage regulator)

On Arduino Uno, / Mega the 3.3V regulated output is able to supply 150 mA max. The ESP8266 draws up to 500 mA and could damage the Arduino.
Add a 3.3V Voltage regulator such as LM1117-3.3 to power the ESP.

A helpful diagram to reference can be found here. 


Hazzah Board being flashed using a FTDI cable&nbsp;Hazzah Board being flashed using a FTDI cable&nbsp;

Hazzah Board being flashed using a FTDI cable 


Note: On the Huzzah Breakout Board, the module must be put into bootloader mode described below before you can upload a sketch from the Arduino integrated development environment (IDE). 

  1. Hold down the GPIO0 button, the red LED will be lit
  2. While holding down GPIO0, click the RESET button
  3. Release RESET, then release GPIO0
  4. When you release the RESET button, the red LED will be lit dimly, this means its ready to bootloader

Then in the upload the sketch found here with the appropriate libraries found here.

Specifics on how the pinout and wiring differs for the Huzzah breakout board can be found on the adafruit site here

Conclusions and Results

After much frustration and hours of tweaking code for the ESP modules and G-Script,  I was successfully able to hardline pseudo data from the microcontroller, through the ESP module to Google sheets via the PushingBox API. This ability really opens up an expanded capability for our sensors that are in developed and will prove to be an integral part of the OPEnS lab remote sensing. 


Pseudo data from the Arduino was successfully pushed the the Gateway generated by The PushingBox API to Google SheetsPseudo data from the Arduino was successfully pushed the the Gateway generated by The PushingBox API to Google Sheets

Pseudo data from the Arduino was successfully pushed the the Gateway generated by The PushingBox API to Google Sheets

Extension of Work

The next step in this project is going to be integrating this data logging interface with data transmitted from the LaRo Radio module. This project will continue in the coming weeks in collaboration with Marissa Kwon.


Work on integrating the LoRa radio receiver and the Huzzah ESP8266.&nbsp;Work on integrating the LoRa radio receiver and the Huzzah ESP8266.&nbsp;

Work on integrating the LoRa radio receiver and the Huzzah ESP8266. 

– Tom DeBell, Beginning Researcher Support Program Researcher
 

Nordic RF shields for Adafruit ProTrinket

By: Chet Udell

Abstract:

This post provides an update on the near-range (up to 100m) RF branch of the Internet of Agriculture Project. New PCB design makes an improvement on a general-purpose, opensource, plug-n-play wireless sensor kit.

Objective:

The previous version of the RF IoT sensor kit had some minor layout flaws, and failed to accommodate a ‘handshake’ button for auto synchronizing an RF sensor node with its base station, a power button, and some other small details. A new version adds these features and reduces the overall device volume by one-third.

Methods and Materials:

Eagle CAD was used to modify a previous version of the PCB. A whole new layout was explored that reduced overall device volume substantially and new features added including: power button, handshake button, removing 12VDC power adapter on base receiver (for now), placing LiPo Backpack on the underside of the transmitter, and creating a “stackable” offset for the ProTrinket, should anyone wish to make further shields to extend this devices capacity.

Results:

See below! PCBs are in the fab house now. . .


WASN_HonorsBrd.pngWASN_HonorsBrd.png


Moving on to Smaller and Better Things

Converting from the Arduino Uno to the Adafruit Pro Trinket

As this project continues to develope, it is time to begin looking to add a more practical means of implementing these systems into the environment in a small and user-friendly package. The problem? The Arduino Uno is an excellent prototyping microcontroller, its easy to work with, has several built in functions with many pins ready to be used, however, this ease of use and functionality comes at the cost of a bulky, power hungry microcontroller that likely can do much more then you need it to. The solution? The Adafruit (3 Volt) Pro Trinket.


The Adafruit Pro trinket is a tiny microcontroller that packs a punch! 


The New Adafruit Pro Trinket (3V) Micro controller being used for this projectThe New Adafruit Pro Trinket (3V) Micro controller being used for this project

The New Adafruit Pro Trinket (3V) Micro controller being used for this project

Remapping Pin-outs

One of the biggest challenges with swapping the Pro Trinket for the Uno  is the difference in board configurations and pin allocations. The blog post “Getting Started with the nRF08001 Bluetooth LE chip” lays out how the pins and wiring of the nRF08001 is set up for the Arduino uno. In this post we will be exploring how to do it for the Pro Trinket. Below is a diagram of the Pro Trinkets Pin outs as well as breakdown of the pin allocation.


Pin Schematic of the Adafruit Pro TrinketPin Schematic of the Adafruit Pro Trinket

Pin Schematic of the Adafruit Pro Trinket

  • RX – also known as Digital #0, this is the hardware serial input pin. This is used when programming with an FTDI cable but is available when using the native USB to program
  • TX – also known as Digital #1, this is the hardware serial output pin. This is used when programming with an FTDI cable but is available when using the native USB to program
  • Digital 3 – Also known as external interrupt #1. This pin can also be used as a PWM output pin using analogWrite() (This is the most significant difference between the Uno and the Pro-Trinket and requires manual changes to sketches in order to work)
  • Digital 4 – Nothing particularly special about this GPIO pin
  • Digital 5 – this pin can also be used as a PWM output pin using analogWrite()
  • Digital 6 – this pin can also be used as a PWM output pin using analogWrite()
  • Digital 8 – Nothing particularly special about this GPIO pin
  • Digital 9 – this pin can also be used as a PWM output pin using analogWrite() It’s also good for driving servos because its a high-speed PWM output
  • Digital 10 – this pin can also be used as a PWM output pin using analogWrite() It’s also good for driving servos because its a high-speed PWM output
  • Digital 11 – Also known as the SPI MOSI pin. this pin can also be used as a PWM output pin using analogWrite()
  • Digital 12 – Also known as the SPI MISO pin
  • Digital 13 – Also known as the SPI CLOCK pin. This is also connected to the red #13 LED!
  • Analog 0 – also known as Digital 14, this pin can be a digital I/O pin or an analog input pin
  • Analog 1 – also known as Digital 15, this pin can be a digital I/O pin or an analog input pin
  • Analog 2 – also known as Digital 16, this pin can be a digital I/O pin or an analog input pin
  • Analog 3 – also known as Digital 17, this pin can be a digital I/O pin or an analog input pin
  • Analog 4 – also known as Digital 18, this pin can be a digital I/O pin or an analog input pin. It’s also the I2C SDA pin
  • Analog 5 – also known as Digital 19, this pin can be a digital I/O pin or an analog input pin. It’s also the I2C SCL pin

Conclusions about the switch

The only changes you may have to consider when adapting Arduino sketches are:

  • Pins #2 and #7 are not available *
  • The onboard 3.3V or 5V regulator can provide 150mA output, not 800mA out, this is due to power saving functionality designed into the Pro Trinket, which is ideal for this project
  • You cannot plug shields directly into the Pro Trinket
  • There is no Serial-to-USB chip onboard. This is to keep the Pro Trinket small and inexpensive, you can use any FTDI cable to connect to the FTDI port for a Serial connection
  • The 3V Pro Trinket runs at 12MHz not 16MHz so its a bit slower, but with the advantage of significantly less power draw, extending battery life significantly
  • The bootloader on the Pro Trinket use 4KB of FLASH so the maximum sketch size is 28,672 bytes, more than enough space for almost all applications. The bootloader does not affect RAM usage.
  • And most importantly that all sketches that use pin 2 as the interrupt must be switched to pin 3. 

Writing a script to bring it all together

This week I have also begin sketching the new data transmission protocol that will be used across the Internet of Ag project. After getting communication between the Pro Trinket and BLE module set up and the demo functioning it was time to start a new script from the ground up. This week I was able to begin drafting out the basic logic, and looking over example codes of the protocol and will contiune working on a sketch next week. 

– Tom DeBell, Beginning Researcher Support Program researcher