Author: Marissa Kwon
Abstract:
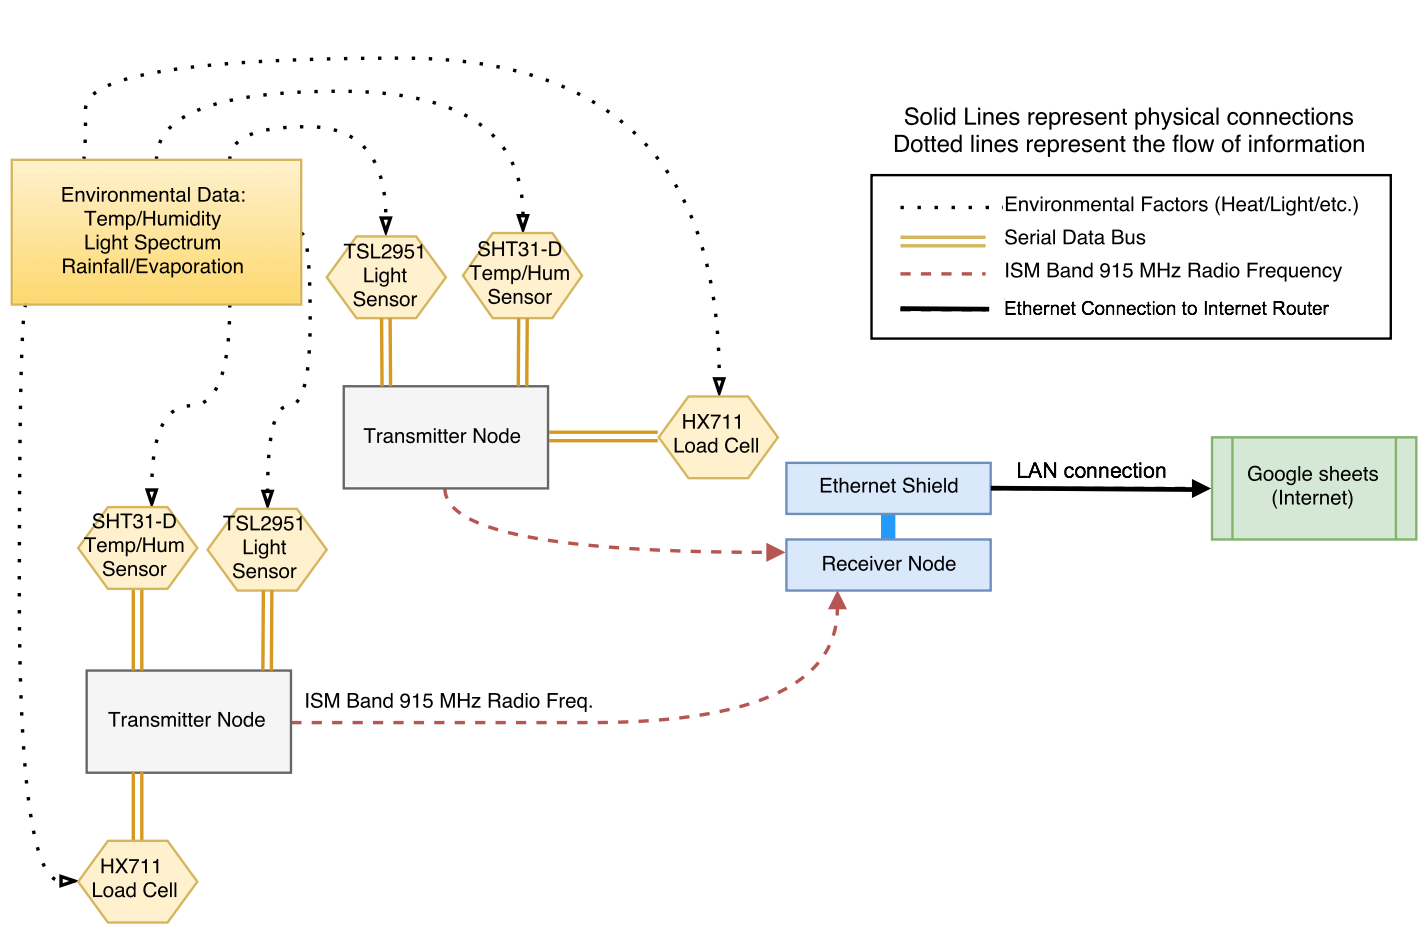
So far we have used this series of blogposts to discuss a lot of the technical details about how certain processes are happening within the Evaporometer Transmitter and Receiver. A series of diagrams has been made to help visualize how everything comes together. First will be a diagram showing how all the sensors are connected to the Feather 32u4 and battery, followed by two flowcharts illustrating how abstract environmental conditions are transformed into the data logged in our spreadsheet.
Evaporometer Transmitter Connections:


Pictured above is a very simple assembly diagram for the Evaporometer Transmitter. Notice that many of the devices have the same yellow and blue colored lines – these are the serial clock and data lines respectively and they are all hooked up to the same pins on the Feather. The red and black lines represent power and ground, and all devices must be connected to these nodes in order to receive power. In real life, the power and ground rails exist along the far edges of a protoboard or breadboard so that all the device wires do not need to be crammed into one small area.
Flowcharts Following the Progression of Evaporometer Data:
Sensors turn information collected from the environment into quantifiable values such as integer and float values that eventually get passed on to the receiver and logged onto a spreadsheet where we can see them online. The diagram below shows how data moves from one component to the next through the Evaporometer Transmitter. Each labeled point on the flowchart indicates where the data must undergo at least one change before being able to proceed to the next.


Although it may seem like a fairly simple process, the sensor data must undergo several transformations before it can reach its destination on the spreadsheet. The integer and float values collected by the sensors must be turned into strings so they can be concatenated into one long packet of data. Now as a single piece of information, the string is cast into an array of 8-bit characters so that it can be transmitted and received using the LoRa components built into our micro-controllers. When the message is received it must also be broken back into the same pieces before it was concatenated and able to be cast back into the float or integer values. To do this we add a comma as a delimiter placed in between data points during concatenation, and once it is received we use use strtok() to divide up our character array at the location of the commas to separate the packet back into different pieces of data.
The diagram below illustrates each process that takes place in the transmitter, starting with data collection right after the RTC alarm wakes it up.


– Marissa Kwon, URSA and NSF Grant Summer Student Researcher
