Update on the Evaporometer

Author: James Yang

Abstract: An update on where the Evaporometer is and addressing the issues as well as what the future plans are for the project.

Temperature Compensation Issues:

There are a few things that we are in the process of implementing within the project. To start, temperature data collected last summer had readings that spiked from 26 degrees to 700+ degrees resulting in huge inaccuracies. The reason is because the previous Op Amp would fluctuate in mass when the temperature changed. To fix this issue, we are replacing the previous OP amp with an INA125P to hopefully reduce temperature compensation problems.

Sustainability:

Another improvement we are hoping for this year is sustainability. We are changing the material of the Evaporometer from ABS to ASA filament in order to weatherproof the encasing, making these devices last longer. Depicted below is the encasing after a 3-6-month period vs. newly printed encasing. By using ASA filament, we can reduce the yellowing of the encasing from overexposure of UV radiation.


3-6 Month Used Evaporometer vs. Newly Printed Evaporometer3-6 Month Used Evaporometer vs. Newly Printed Evaporometer

3-6 Month Used Evaporometer vs. Newly Printed Evaporometer

Future of Evaporometer

Dr. Selker is planning on deploying approximately 50 Evaporometers to Africa around May.

Assembled Evaporometer Type S

Abstract:
I have assembled the new evaporometer. This post will be a quick update of the progress.

Update: 
Here is an image of the assembled Evaporometer Type S: 


IMG_0532.jpgIMG_0532.jpg

I started by assembling the electronics on the inside because that would be the fastest thing to do. This also included the strain gauge and then humidity/temp sensor that goes on the lid of the system.  Then I did the wiring of the light sensors because that would take the longest. The light sensor wiring was the longest because of the intricate soldering on the pins of the sensors, plus passing all the wiring through the cordgrip was very time-consuming. 

In the end, the whole assembly takes about 2-2.5 hours to accomplish. This is not counting the time to print the parts. At the time of this post, we are still working on three other evaporometers:


IMG_0534.jpgIMG_0534.jpg

And we have more on the printer.


IMG_0533.jpgIMG_0533.jpg

In total we are making four evaporometers with the ETA attachment and four without it. 

Evaporometer Type S

Abstract

I have created a new version of the evaporometer where everything is stacked. The main reason for this is to shade the strain gauge from the sun. In this post, I will summarize the design of the evaporometer and show some images of the early iterations of this design.

Design

Electronics Case


Electronics case CADElectronics case CAD

Electronics case CAD

The image above shows the CAD of the casing of the electronics; inside it will also hold a 6000mAh battery. This part will have an attachment, like the previous versions, where it will have a slide mechanism for easy setup. This version also has a cork gasket so that it will have a better seal between this piece and the cap making it weatherproof. 

Electronics Cap


Electronics cap CADElectronics cap CAD

Electronics cap CAD

The image above shows the important elements of the cap. The first, the strain gauge will connect directly to the cap. The second, the little hump that is close to the edge will allow airflow through a slit that will be going right next to the SHT31 sensor, allowing for Humidity/Temp data. And last, the little hole that will allow for the wiring of the strain gauge to go to the microcontroller. 

Water Container

The water container was changed much from the last iteration. This iteration alllows for the strain gauge to be connected from the bottom. 


Water container CADWater container CAD

Water container CAD

The container is actually made from two pieces. The first piece is bolted to the bottom of the container and then that same piece gets bolted on the strain gauge. The image above shows the assembly of the pieces. 

ETA Attachement 


ETA attachement CADETA attachement CAD

ETA attachement CAD

The image above is the attachment that will hold the two TSL2561 sensors. The bottom sensor will have attached using a twist lock mechanism and the top will be on a swivel. 

ASSEMBLY


CAD Assembly CAD Assembly 

CAD Assembly 


CAD Rendering CAD Rendering 

CAD Rendering 

TSL2561 or TSL2591?

Abstract: The TSL2561 and TSL2591 are Ambient Light Sensors (ALS). Both of these sensors are good, but there are some differences between them that would change the implementation of the Albedo sensor. This post intends to explain why we chose the sensor that we did.

Sensors:
Here are links to the two datasheets of the sensors: 
TSL2561
TSL2591

If the links do not work, you can find the sensors on the Adafruit website by searching TSL2561 and TSL2591.

They both have a broadband photodiode, that includes both visible and infrared, and one dedicated infrared photodiode. It is quite obvious that the TSL2591 has a higher count from the ADC per channel and in turn will be more sensitive to light change. For our purposes, we need a sensor that is going up and one that is going down. Having the higher sensitivity of the TSL2591 would be great, but the limitation to this sensor is that the sensor can only be configured to a single address meaning we can only use one. On the other hand, the TSL2561 has more than one address that can be used; this also means that we can include two sensors for the albedo configuration without the need of extra circuitry such as an I2C multiplexer. For this reason,  we will be using the TSL2561. To be able to perform the albedo calculation, it is just necessary to have  2 sensors outputting the same kind of data out. This means that we can go ahead and use the TSL2561 and it should be just fine. 


TSL2561TSL2561

TSL2561

Conclusion:
The TSL2561 is sufficient for our albedo sensor. The major upside is that we can use two sensors; this is because of the multiple addresses that the sensor can be assigned. The only downside is that it is not as sensitive to light as the TSL2591, but this should be not a problem as we only need two reliable sensors outputting the same kind of data to be able to perform the albedo calculation. 

Creating a Gasket Using Cork

Abstract: We have been looking for a way to seal our enclosures so that water can’t get in. In response to this problem, we decided to use cork to try to solve this problem. This post is just a brief description of what the design looks like and the settings used to cut the cork.

Design: 

I used the face of the bottom part of the cap to create the gasket design. This was done very easily using the project command and then extruding face out 1/16 inches.  


Face of where the gasket goes and where the projection was taken from Face of where the gasket goes and where the projection was taken from 

Face of where the gasket goes and where the projection was taken from 


Gasket renderingGasket rendering

Gasket rendering

The design didn’t take much time, but figuring out the laser cutter settings did take time. I was able to determine that the optimal settings to cut the cork were at a speed of 30 mm/s and a power of 15% on our laser cutter. Here are some pictures of the cuts:


IMG_0447.jpgIMG_0447.jpg


IMG_0446.jpgIMG_0446.jpg

I got this material from McMaster-Carr. This other link also gives some characteristics of cork. 

Conclusion: 

This is being put to the test, as we just deployed four sensor suites and they were all equipped with this gasket. We will see if it is able to keep the electronics safe from moisture and running until the battery dies or the term comes to an end.

ETA Attachment

Abstract:  I’ve bee working on the ETA attachment and here is an update on what it looks like and where the design will go next. 

Objective: The ETA is designed to hold the two light sensors and one humidity/temp sensor. The two light sensors will make the albedo measuring system, so one has to be looking up and one straight down. The humidity/temp sensor is going right under the light sensor that is looking straight up. 

Methods: I’ve been using Fusion 360 to do the CAD and I will be 3D printing on the Fusion3 F400.

Results:

Here is the attachment piece from the sensors to the hub of the electronics. This has a slide mechanism that makes it easily detachable. This piece has to be put in first before the cap because the caps actually functions as a lock for this piece, it keeps it from sliding out in case that something bumps it. 

This is a preliminary look at what the ETA will end up looking like. This rendering is still missing the disks that will be holding the two light sensors and the humidity/temp sensor. I had to do some redesign on the base to be able to accommodate the extruding piece of the ETA attachment, but I think that this piece is solid design and I can now move on to design in the bases for the sensors. 

The bases, which will look like little disks, will hold the sensors. The one that will go on the 360 swivel will hold a light sensor on top and the humidity/temp sensor underneath. The other disk will go on the underside of the swivel, it will only hold a light sensor. 


Evaporometer 2.0 First Prototype

Abstract: Here is an update on the progress of the second versions of the Evaporimeter. We have now printed the pieces and mounted the electronics onto the 3D printed pieces. 

Objective: To inform the reader of the features and changes to the Evaporimeter design. 

Methods: I did all the CAD on Fusion360.  Here is the Assembly.

Results:

This is the CAD for the new design. 


This is the first prototype of the second version. We have to yet test the whole system, but we are getting there. There are some minor things to fix first before this design of finalized. 

This version has a barrel jack that will be used for solar power charging; this was intended for an external solar panel attachment. We are planning to integrate the solar panel into the project’s electronics, so we will be8 making a new base cap that has the solar panel in it and the electronics on the underside.

This design also gives the user access to uSD and USB by just sliding a cap off. This will be very nice when you have to get the data from the uSD card or you have to reprogram the microcontroller. 

The solar shield on this design is outdated. I want to make an octagonal version of the shied that will cover all the sides of the strain gauge. This will make it so that the heat is more evenly distributed.

Evaporometer 2.0

Abstract: Here is an update on the new evaporimeter design. This design will include the ETA sensor on it. It has not yet been designed, but the electronics base has the port for it.

Objective: This post is intended to update the reader on the new design for evaporimeter.

Methods:  I did the CAD in Fusion360. Here is the link

Results: The following CAD are the main pieces that make the new evaporimeter design. 

This is the main body that holds the battery and the electronics. The battery sits at the bottom of the case and the electronics sit on top of the battery supported by a 3D printed base.

This piece is the on that holds the electronics in place. The bottom PCB is bolted onto this piece; this one is specifically designed to bolt the Feather RTC and uSD card wing. 

This is the cap that will close the case. This is designed to be modular in height for 3D printing. Our electronics are made so that more capabilities can be added after production; this is done by stacking other shields onto the existing boards. 

This is the assembly of the case without the cover. The aluminum piece extruding from the side is the strain gauge and the black piece is a cordgrip used to pass a cable with four conductors that will be used to communicate with the light and humidity/temperature sensors.

Waterproof Evaporometer

Abstract: It was recently discovered that our transmitter is no longer sending data and that the last reading on the humidity sensor was 100%. I wonder what happened? We are now moving ahead in the design process to create a waterproof system. 

Objective: I intend to describe design considerations and current ideas that have come up to design the new enclosure for the evaporimeter base. 

Materials and Methods: 

This the new concept for the evaporimeter:


Screen Shot 2017-10-04 at 10.33.40 AM.pngScreen Shot 2017-10-04 at 10.33.40 AM.png

The idea of the new base is to have a case that consists of a main body and cap. I think it is a good idea to use a rubber gasket to seal the junction between the two. In terms of materials, I plan to keep on using ABS for the time, but using T-Glase, Bridge, or Nylon is also recommended to keep water from entering into the 3d printed case.

We also need to run some wire into the casing from the sensors on the outside. Using a coupling mechanism would be our best solution. The only problem is that our system is very small and the coupling mechanisms for that scale are very expensive, about $40 per set. Another solution that was brought up was to use rubber sheet and perforate a small hole to run the wire through. This rubber sheet will seal up against the wire and keep moisture out. We are also leaning towards using a cordgrip and using a 4 wire cable. Another solution was to find some type of waterproof ethernet cable.

Results

For now, we will be testing the cordgrip and ethernet options. These seem to be the most inexpensive options. I will also be ordering the rubber gasket to get a good seal for the base case. 

Links

Coupling Mechanism

Example Cordgrip

Rubber Seal

Some Useful Diagrams Illustrating Evaporometer Processes

Author: Marissa Kwon

Abstract: 

So far we have used this series of blogposts to discuss a lot of the technical details about how certain processes are happening within the Evaporometer Transmitter and Receiver.  A series of diagrams has been made to help visualize how everything comes together.  First will be a diagram showing how all the sensors are connected to the Feather 32u4 and battery, followed by two flowcharts illustrating how abstract environmental conditions are transformed into the data logged in our spreadsheet.

Evaporometer Transmitter Connections:


Transmitter_diagram.pngTransmitter_diagram.png

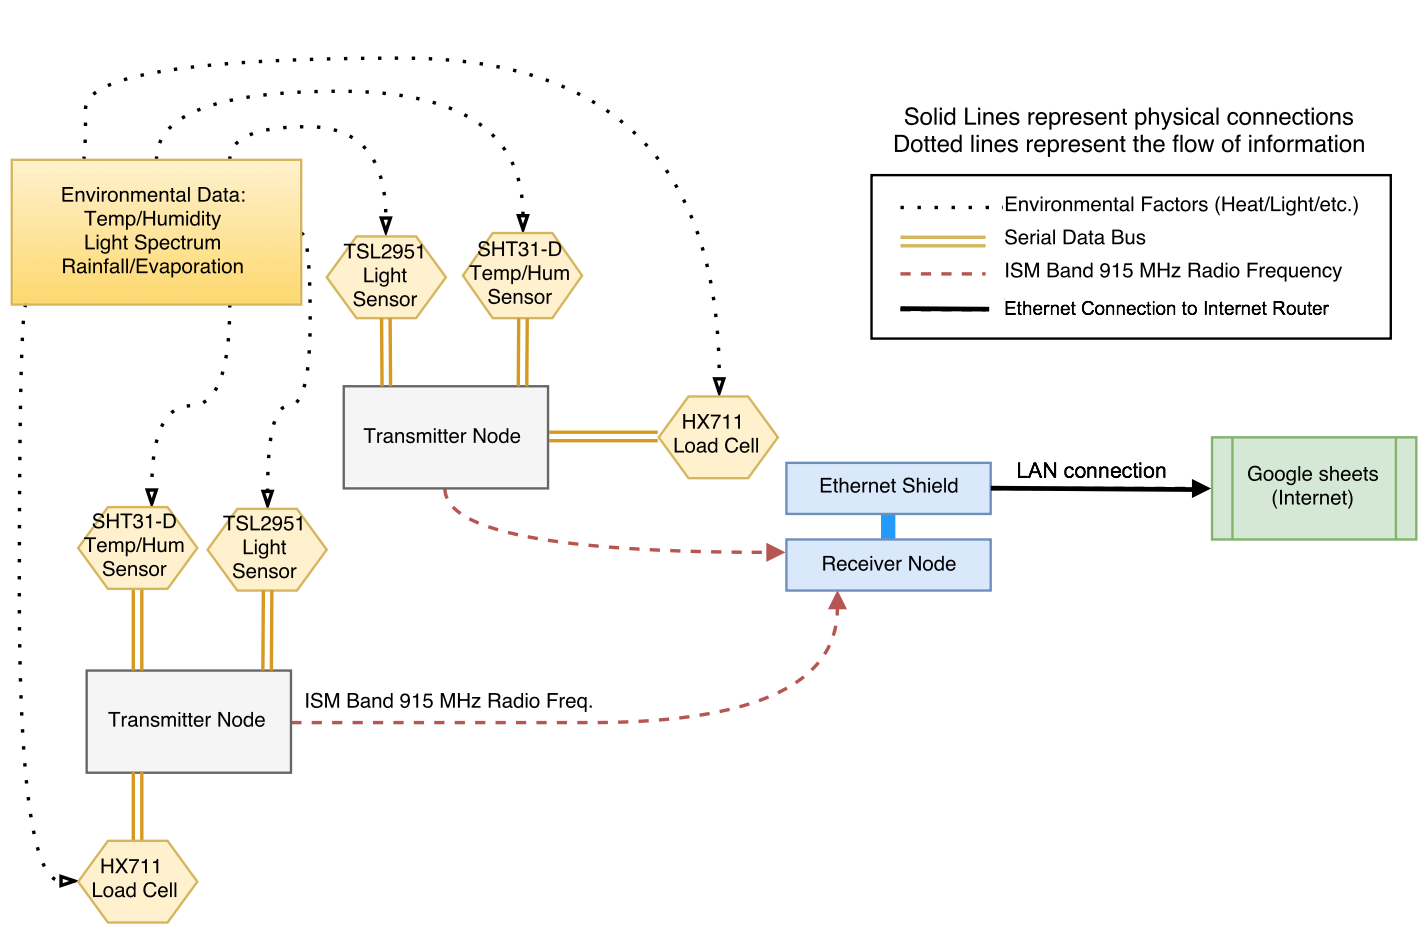
Pictured above is a very simple assembly diagram for the Evaporometer Transmitter.  Notice that many of the devices have the same yellow and blue colored lines – these are the serial clock and data lines respectively and they are all hooked up to the same pins on the Feather.  The red and black lines represent power and ground, and all devices must be connected to these nodes in order to receive power.  In real life, the power and ground rails exist along the far edges of a protoboard or breadboard so that all the device wires do not need to be crammed into one small area.

Flowcharts Following the Progression of Evaporometer Data:

Sensors turn information collected from the environment into quantifiable values such as integer and float values that eventually get passed on to the receiver and logged onto a spreadsheet where we can see them online.  The diagram below shows how data moves from one component to the next through the Evaporometer Transmitter. Each labeled point on the flowchart indicates where the data must undergo at least one change before being able to proceed to the next.


Screen Shot 2017-08-28 at 3.14.36 PM.pngScreen Shot 2017-08-28 at 3.14.36 PM.png

Although it may seem like a fairly simple process, the sensor data must undergo several transformations before it can reach its destination on the spreadsheet. The integer and float values collected by the sensors must be turned into strings so they can be concatenated into one long packet of data.  Now as a single piece of information, the string is cast into an array of 8-bit characters so that it can be transmitted and received using the LoRa components built into our micro-controllers.  When the message is received it must also be broken back into the same pieces before it was concatenated and able to be cast back into the float or integer values.  To do this we add a comma as a delimiter placed in between data points during concatenation, and once it is received we use use strtok() to divide up our character array at the location of the commas to separate the packet back into different pieces of data.

The diagram below illustrates each process that takes place in the transmitter, starting with data collection right after the RTC alarm wakes it up.


Screen Shot 2017-08-24 at 4.57.31 PM.pngScreen Shot 2017-08-24 at 4.57.31 PM.png

– Marissa Kwon, URSA and NSF Grant Summer Student Researcher