Accounting For Signal And Power Line Noise On An Arduino Caused By A Brushed DC Motor

A bug in the water sampler’s electronics has come and gone throughout the iterations of our design: the valves would reset intermittently when the pump motor was operating. First we moved the pump from the same shift register as the valves to its own dedicated MOSFET. We added a small capacitor for mild noise. The problem disappeared until later iterations. Then, we changed the MOSFET to a dedicated H-Bridge motor controller from Adafruit, equipped with its own 22uF and .1uF decoupling capacitors. The problem disappeared until we used a larger pump in a later iteration. So we talked to Jim Wagner about it and he cleared things up for us.

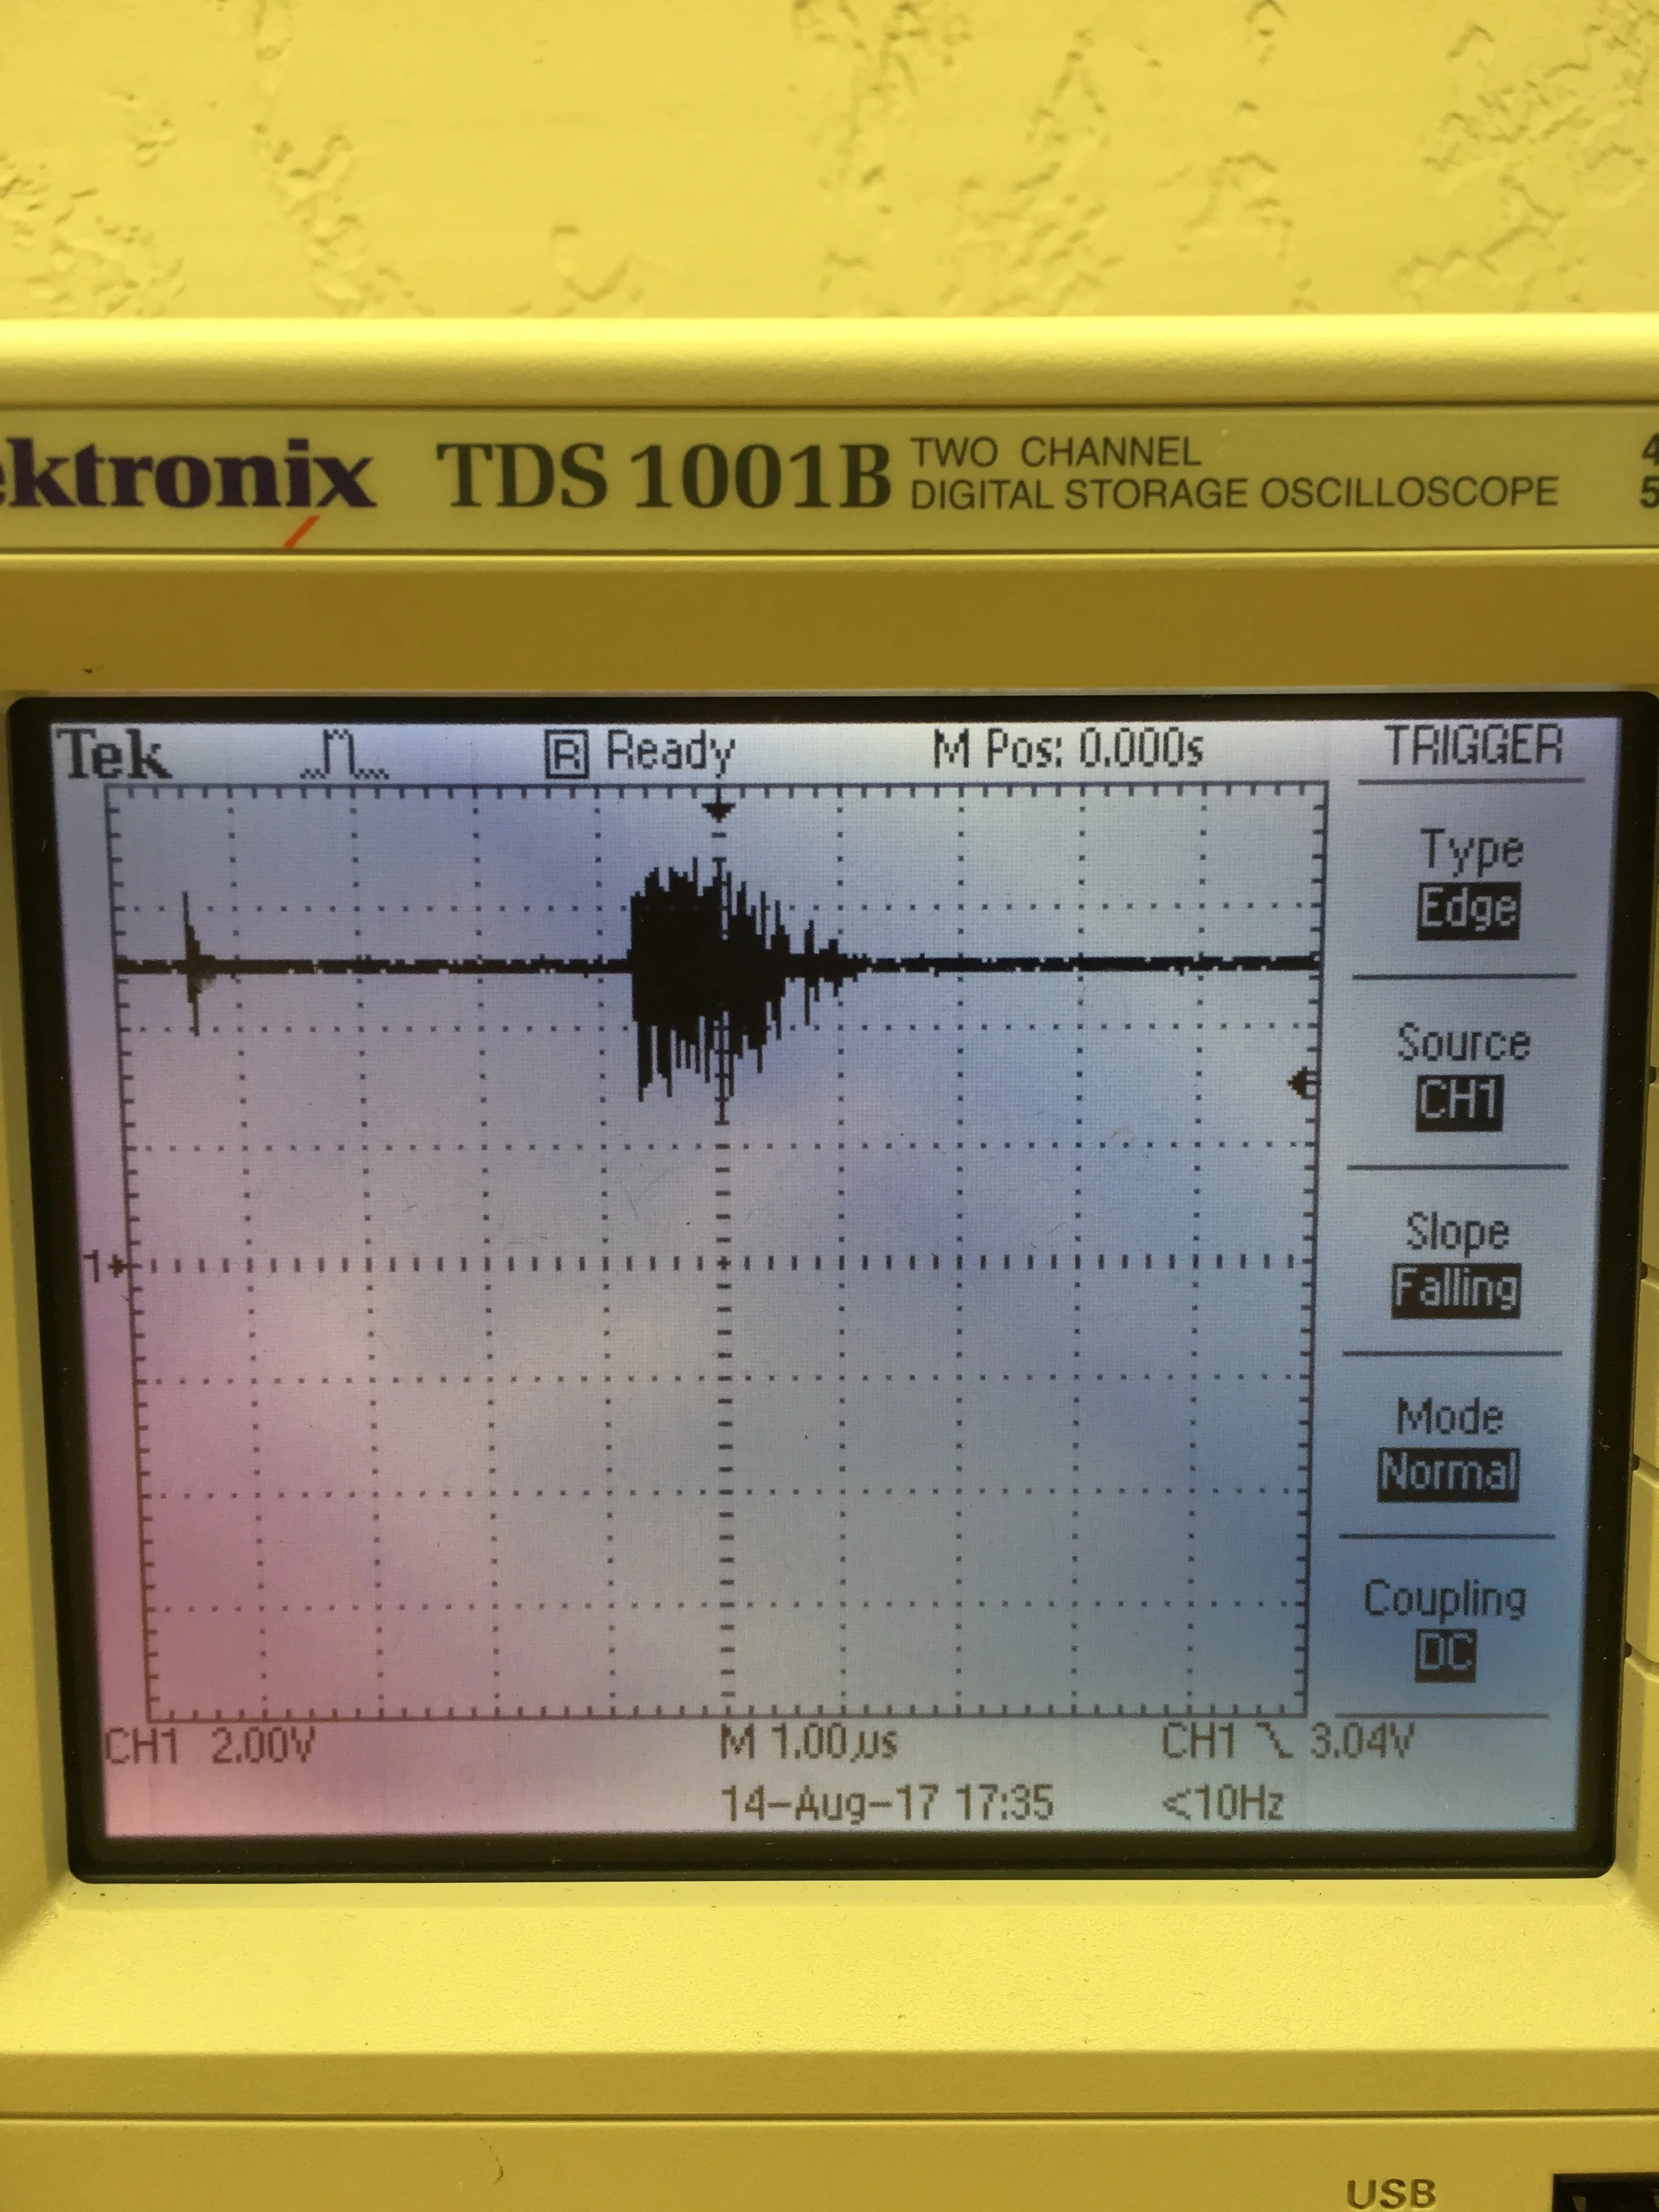
It turns out that brushed DC motors create a lot of noise, which is exactly as we expected but did not know how to fix. The brushes in the motors cause irregular noise in the power lines with pulse widths too small to pick up on a multimeter, but quite easy to see using an oscilloscope. I hooked up the arduino’s 5V pin and ground to a probe and ran the system under the conditions that would cause the valves to reset. The scope was set to trigger on a falling edge lower than 3.04v. Sure enough, the initially-open valve closed and water forced its way through the flush valve after building pressure.


Look a little closer at the oscilloscope:


The 5V rail dropped to nearly 0V for about a microsecond, more than enough time to drop the SCLR line to fall to a low state and reset the shift registers. This explains why the valves were resetting! It wasn’t just this one instance, either; the valve continuously reset as the command “V1 1” to open it was sent, and the oscilloscope was continuously triggering due to a falling edge like the one in the picture as long as the pump was running.


OK. We had already added a 100 uF capacitor between the Arduino’s VIN (12V) and GND pins. I removed that and bumped it up to 1000uF, reconnected the system to the oscilloscope and ran the test again, this time with similar but notably different results.


The valves were still resetting, and the oscilloscope was triggering often, but the voltage never dropped below 2V. A small victory, surely, however the problem remained. I decided to add a 100uF capacitor between the 5V and GND pins in addition to the capacitor that I had already attached between the 12V and GND. A retest resulted in the valves resetting after 8 seconds of stability, but the magnitude of the noise was still the same:


I read here after some quick research that multiple capacitors of different sizes in parallel would buffer different frequencies of noise. So I unplugged everything again and took the board to the soldering station, tacking on a 10nF ceramic capacitor parallel to the 100uF cap between the 5V and GND pins. This time the valves lasted 15 seconds before resetting on a much smoother blip, magnified to 250ns per division below:


The same signal magnified to 10ns per divison below:


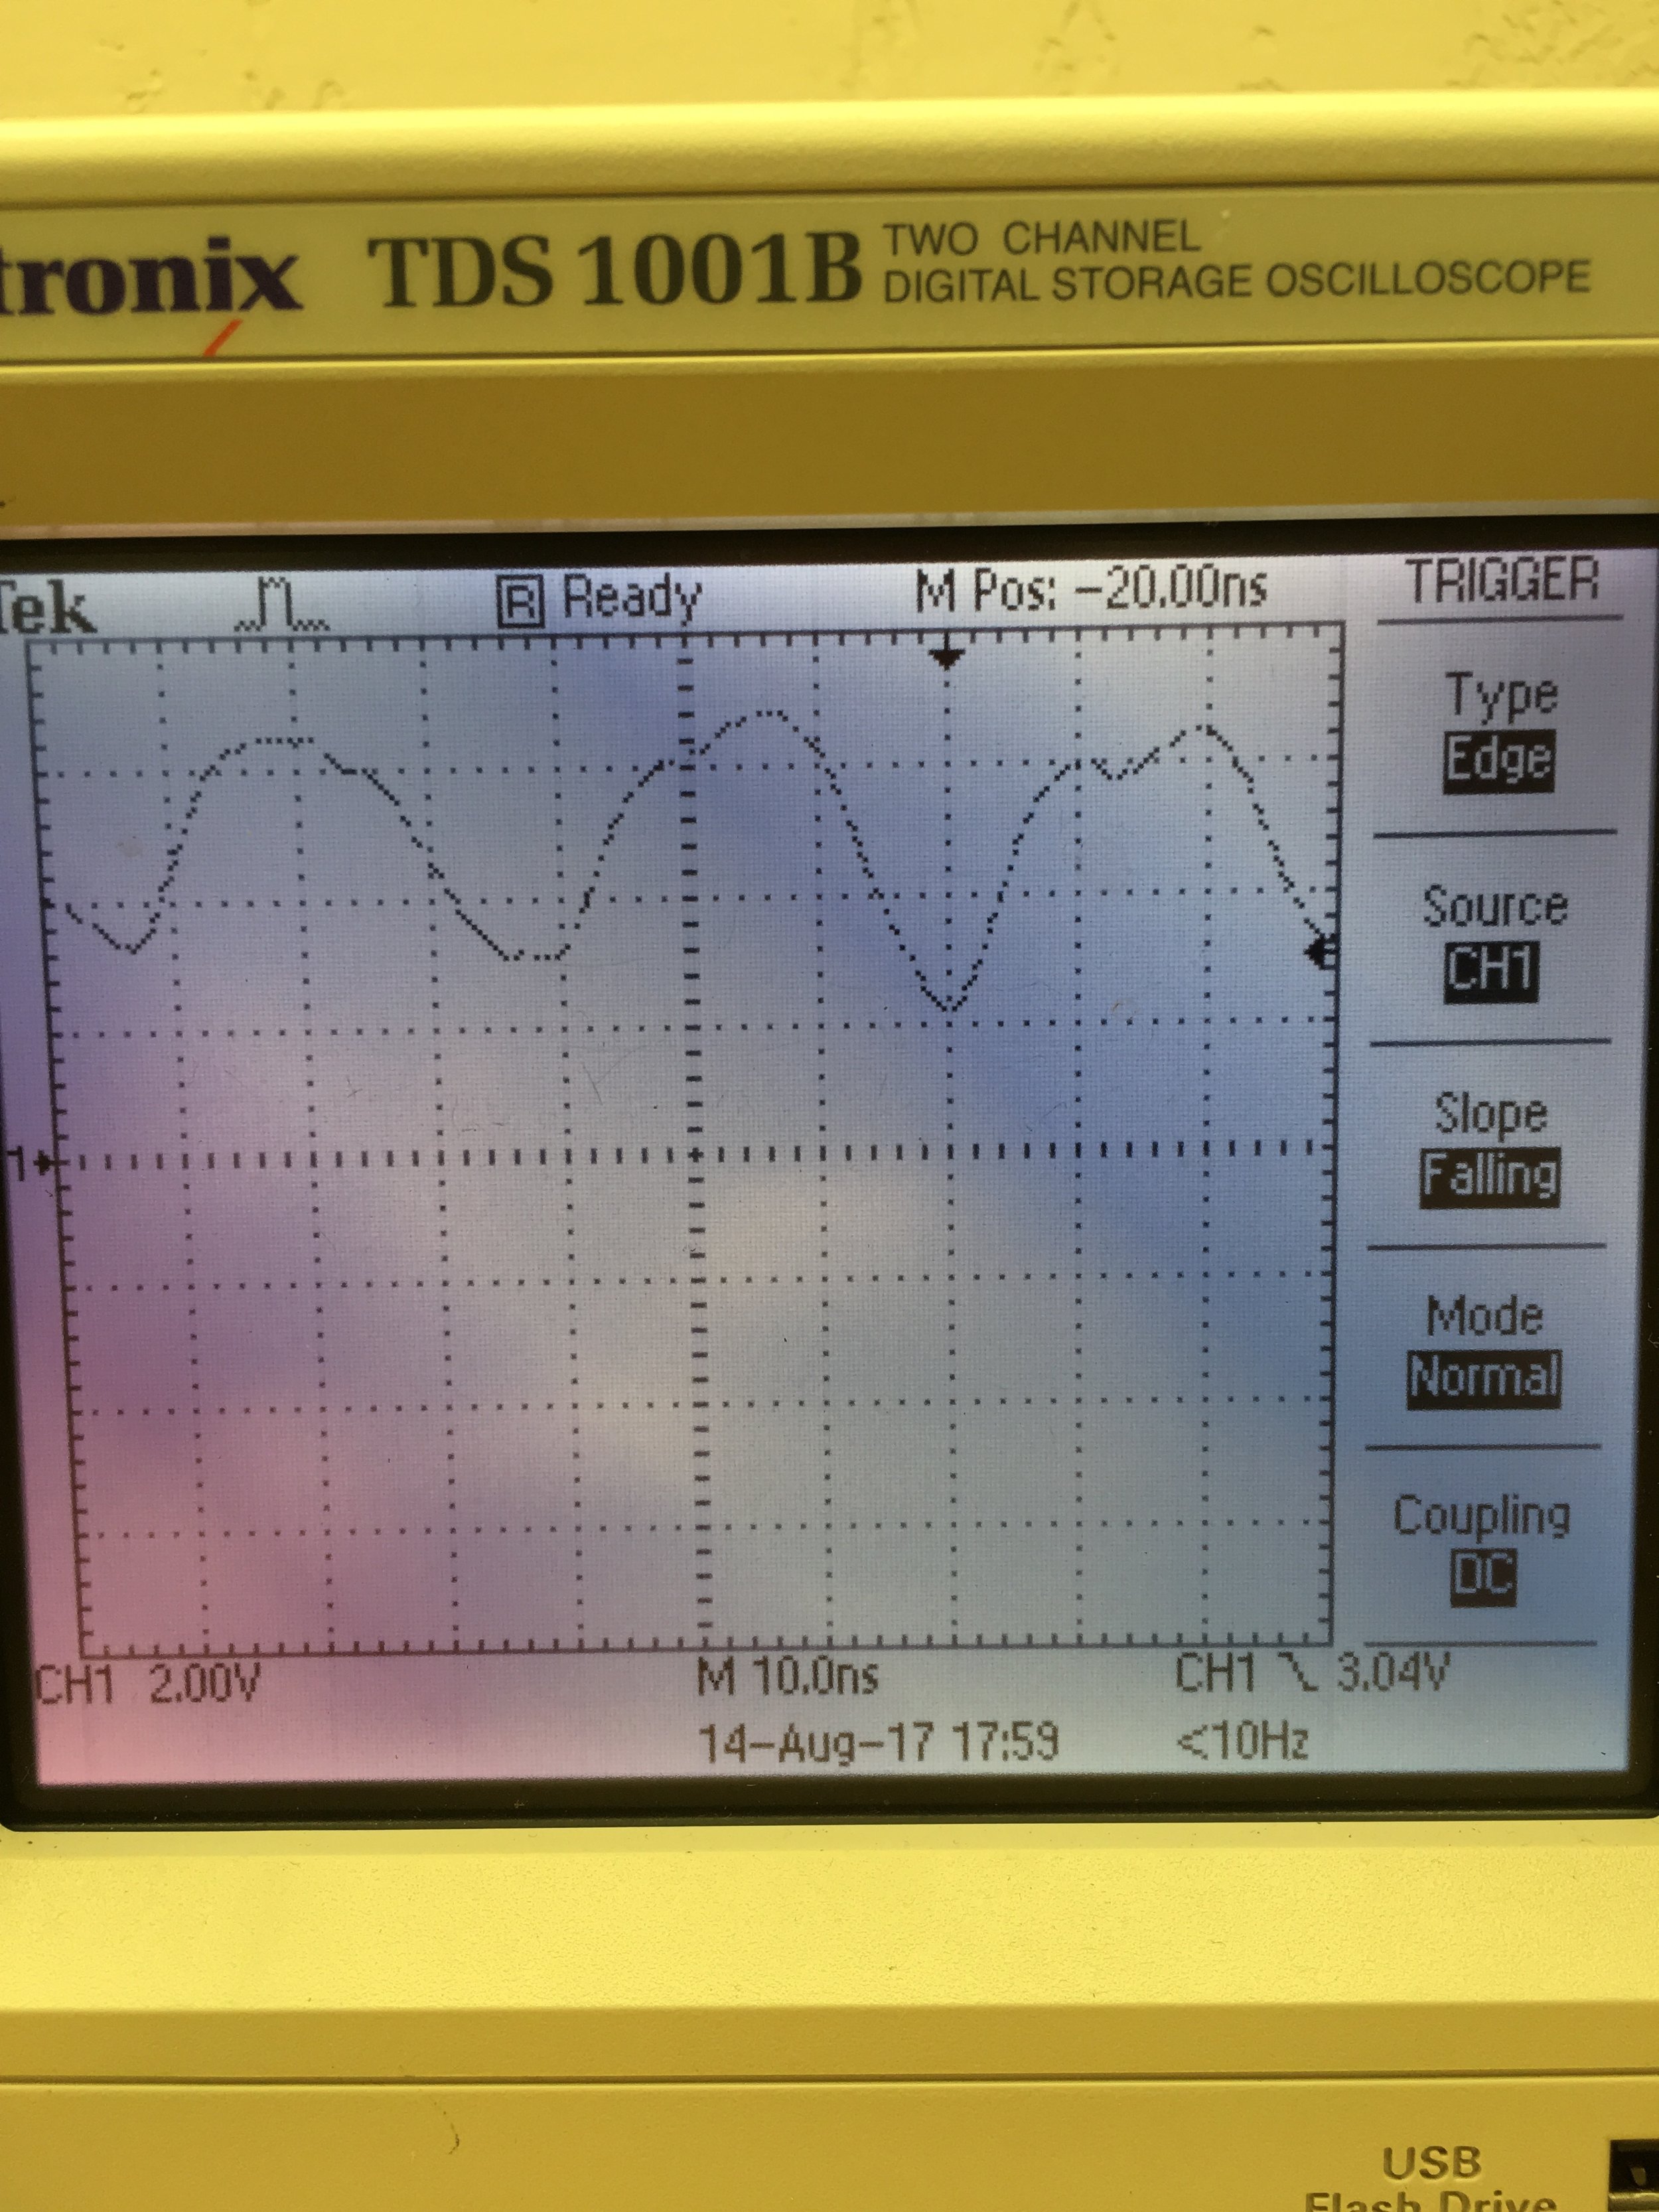
So close! I carefully unplugged everything one more time, soldered on a 1nF capacitor in parallel, then set up the test one final time:


Finally, the valves stayed on! The system ran for a minute straight without so much as a whisper from the probed voltage. This solution can be used in the next iteration of the PCB after more research, calculation, and perhaps discussion with Jim in order to protect against a wider range of noise on more lines more efficiently.

OPEnSampler Update August 9, 2017


OPEnSampler_15rev1OPEnSampler_15rev1

Abstract

Much progress has been made with the OPEnSampler! The frame is lightweight, the entire system fits into the Pelican rolling cooler, and the sample control works as expected. 24 bags fit with room inside the frame, and the system can be set on any face without issues, easing maintenance, testing, transport, and drawing out samples. Some issues persist in this iteration, namely light leaking from the bags and a low flow rate due to the cheap pumps.

Electronics

The electronics of the sampler have evolved. They consist of an Arduino Uno connected to three custom PCBs: two Valve Breakout Boards (VBBs) and one Main Control Board (MCB). The MCB connects directly to the Arduino and includes the shift registers to control the valves, the motor breakout board for the pumps, the real time clock, and receptacles for ribbon cables connecting to the VBBs. The VBBs break out the open-drain outputs on the shift registers to 12 JST terminals each, corresponding to one valve each. Doing this reduced the wire-spaghetti caused by directly soldering wires to each valve. 


openSampler_electronicsopenSampler_electronics

Frame:

Slotted aluminum extrusion can be ordered at specific lengths with a tight tolerance for several dollars per piece, allowing the frame to be assembled in minutes with purchased corner brackets. A lighter but sufficiently strong 15mm aluminum extrusion was used, reducing the weight of the frame to just over 2 kg. The design of the frame allows the OPEnSampler to be tilted in any direction without issue.

Hydraulics:

Water to be sampled is pulled through an open end of 3/16” ID silicone tubing via two $12 peristaltic dosing pumps in parallel. The pumps claim to have a head height of “10m” and a flow rate of up to 150 ml/min, but in practice the numbers are about half those values. Further testing will be carried out, but the pumps will be replaced with a $60 peristaltic pump from a more reputable company supposedly capable of a 350ml flow rate.

Down-line of the pumps water fills the rest of the tubing, leaving the exit end if the flush valve is opened, or is pushed into a sample bag when its respective valve is opened. To draw sampled water out of a bag, its respective valve is opened and the pumps are powered in reverse using the H-bridge motor breakout board bought from Adafruit. 

Current Bugs

There are a couple known bugs in the system and one major design flaw that limits the functionality of the device. The first bug is mechanical: the bags leak when they are upside down. Initially, this was a very significant amount, draining the bags overnight. Teflon tape was wrapped around the elbow connectors that screw into the printed bag caps, and the leaking was reduced to a few mL per hour. Initial tests of new bag caps with changed O-Ring gland dimensions, a 3% smaller diameter through-hole for the elbow fittings, and the replacement of teflon tape with a gorilla-glue and acetone coat show very promising results with no leaking in the first two caps tested. 24 new caps were printed, processed, and are currently drying before testing tomorrow morning.


dryingBagCapsdryingBagCaps

The second bug is intermittent and will be difficult to fix. On occasion, valve 7 becomes permanently powered and will stay open regardless of what serial commands are fed to the Arduino. This is characterized by a lack of actuating sound when the command “V7 1” (valve 7 on) is sent, by bag 7 filling despite sending the commands to fill another bag, and by an actuating sound upon powering on the device. This bug is not consistent and the cause is currently unknown. Battery power was suspected initially, but when probed the battery read a high 12.7 volts. 

The major design flaw is the low flowrate of the pumps, including the new pump selected. The EPA recommends a line velocity of greater than 2 ft/s when sampling for suspended solids such as sediments (link). With 3/16” ID tubing, this equates to a flow rate above 600 mL/min. Low flow pumps were chosen because high-flow peristaltic pumps cost between several hundred and several thousand dollars. A 3D printed pump head with a store-bought DC gear-motor is being investigated, though a <$100, 1000ml/min 12V pump has been found on AliExpress and will be tested out before a DIY pump is developed. 

Conclusion

While a significant portion of this writeup was dedicated to discussing the current issues with the device, the OPEnSampler is working almost exactly as expected. If a solution to the leaking problem is not found soon, the bags can simply be reoriented to sit upright for this current version. The pumps will be sufficient in sampling for analytes that aren’t large-particle suspended sediments.

A Simpler Pump Test: No SD

Introduction

This is a follow-up to the previous post, “A Simple Pump Test”. There were several complications with storing the pump data on an SD so this post will describe a new method that stores data on the Arduino’s own memory.

Background

In the field, the pumps will be run for 2.5 minutes per sample for 24 samples, resulting in one hour of total runtime. As described in the previous post, the pumps used in the sampler are poorly documented and information on their lifespan and behavior under long periods of use is needed. 

The SD breakout board used in the previous test was a 3.3v board and was not compatible with 5v arduino logic without some voltage conversion in between. While it worked some of the time, it resulted in corrupt data after a few points. Rather than using a 5v board or something to step down the signal voltage, the Arduino’s own memory can be used to store a small amount of data.

Arduinos have a small amount of available memory that doesn’t get reset between power cycles, known as EEPROM. A single byte can be stored per register, and an Arduino Uno has 512 available registers.

Setup and Method

A 12v peristaltic dosing pump is wired such that the positive end is connected to a 12v source and the negative end is split between a .85 Ohm resistor and the Arduino’s A0 analog input pin. The Arduino’s GND is connected to GND on the power source and VIN is connected to 12v. The other end of the .85 Ohm resistor is connected to GND.

A jumper wire connects GND to the Arduino’s digital pin 3, which is initialized to INPUT_PULLUP.

When powered on, the Arduino continuously checks that pin 3 is LOW. If it is, the voltage across the .85 ohm resistor is effectively measured via an analog read of pin A0 and the value is stored in a register of EEPROM. The register address is incremented and the loop resets.

If pin 3 is HIGH, data collection is turned off and the Arduino checks for a serial input of “p”. If the user inputs in the serial monitor “p” then it prints all the data from the registers separated by spaces. This data should be copied and pasted into a text file, but can be reprinted as long as pin 3 is HIGH.

Code

// A simple voltage logger that is 

#include <EEPROM.h>

const int sensorPin = A0;
const int startPin = 3;

long sTime = 0; // last sample time
int maxPoints = 240; // maximum number of points to store
int sDelay = 30000; // delay between samples
int addr = 0;

void storeData();

void setup() {
  pinMode(startPin,INPUT_PULLUP); // if grounded, enable recording
  pinMode(sensorPin,INPUT);
  Serial.begin(9600);
  Serial.println(“Initializing…”);

  
  analogRead(sensorPin);
  delay(1000);
  analogRead(sensorPin);
  delay(1000);
  analogRead(sensorPin);
  delay(1000);
  analogRead(sensorPin);
  delay(1000);
  
  Serial.println(“Initialized.”);
}

void loop() {
  
  //If datalogging is enabled, store data in a new address
  if(!digitalRead(startPin)){
    if(millis() – sTime > sDelay){
      Serial.println(“reading data point ” + String(addr));
      storeData();
    }
  }
  else{
    Serial.println(“Enter ‘p’ to print out data”);
    
    while(digitalRead(startPin)){
      int input = 0;
      
      if(Serial.available() > 0){
        input = Serial.read();
      }
      
      if (input == 112){
        for(int i = 0; i < maxPoints && i < EEPROM.length(); i++){
          Serial.print(EEPROM.read(i));
          Serial.print(” “);
        }
        
        Serial.println();
      }
    }
  }
}

/*
 * store the sensorPin voltage and increment the address. If the address has
 * reached the limit of number of the points or hit the last address of
 * the EEPROM, don’t store data and return from the function.
 */
void storeData(){
  if(addr == EEPROM.length() || addr == maxPoints){
    Serial.println(“Max addr reached”);
    sTime = millis();
    return;
  }
  EEPROM.write(addr, analogRead(sensorPin)/4);
  sTime = millis();
  addr++;
}
 

Python Code

# This code will take in data via a text file that was collected using
# the pumptest arduino code. Data points should be separated by spaces.

import matplotlib.pyplot as plt

data = []
splitter = []
voltage = []
current = []
average = []
avg = 0

with open(‘pumplog_2_p1t2.txt’) as f: #file name for test data to be graphed
    reader = f.readlines() #read in the data

for line in reader: #split up the data. Could be conbined with converting to int but is more readable this way.
    splitter.append(line.split())

for point in splitter[0]:
    data.append(int(point) * 4) # turn each point of data into an int. Data values were divided by 4
                                # to fit into EEPROM.

for point in data: # calculate the voltage at each point.
    voltage.append(point * 5 / 1024)

for point in voltage: # calculate the current at each point.
    current.append(point / .85)

for point in current: # calculate the average current.
    avg += point
avg = avg / len(data)

for point in data: # turn average into a plottable list
    average.append(avg)

plt.plot(current)
plt.plot(average)
plt.title(“Pump 1 Test 2”) #rename based on test
plt.xlabel(“time (minutes)”)
plt.ylabel(“current (A)”)
plt.show()


Initial Results

Conclusion

Three tests have been run so far. They were graphed using Python 3 and matplotlib.pyplot. Another test is currently being run on the second pump. The data between the two pumps will be compared using a two-sample T test to check if the two pumps perform the same. The same method will be used for the pumps under condition of pumping water.

The initial three tests might suggest that there is a long term decrease in the pumps’ current draw. Future tests should be conducted for a full day and a linear regression analysis should be performed. More importantly, such inconsistency in the current draw suggests the flow rate though these pumps is not constant. A test should be conducted to observe the trend and variance in the mass flow rate of water through the pump via a logging scale. A better conclusion can be made once the first round of testing is finished and statistically analyzed.


A Simple Pump Test

Introduction

Peristaltic 12V dosing pumps are cheap and provide a large enough volumetric flow rate for our needs. Unfortunately there is not much information available on the type we are using. This post will discuss the method we are using to test the reliability and consistency of these pumps over a period of two hours. It is the first of several tests we will be conducting on different components of our water sampler.


Setup and Method

A pump is held in a clamp and powered from a 12v source. A .85 ohm, 1.4 watt rated resistor connects the pump to ground. The voltage across the .85 ohm resistor is measured over time using an arduino and this data is stored in an SD card. 

The arduino reads the voltage on an analog pin and stores that, along with the time since starting in milliseconds, in the SD card. Initially there is a delay of one second in between data points and after sixty points the delay increases to one minute. This data will be transferred to a computer where it will be used to show the current through the pump over time.


Code:

// A simple voltage logger that is heavily
// based on the SD Datalogger example sketch.

#include <SPI.h>
#include <SD.h>

const int chipSelect = 4;
const int sensorPin = 0;

int n = 0;

void setup() {
  Serial.begin(9600);
  while(!Serial){
    ;
  }

  Serial.print(“Initializing SD card…”);

  if(!SD.begin(chipSelect)){
    Serial.println(“Card failed, or not present.”);
    return;
  }
  Serial.println(“card initialized.”);

}

void loop() {
    String dataString = makeDataString();
    File dataFile = SD.open(“pumpLog.txt”, FILE_WRITE);
    if(dataFile){
      dataFile.print(dataString);
      dataFile.close();
      Serial.println(dataString);
    }
    else{
      Serial.println(“error opening pumpLog.txt”);
    }

    if(n<60){ 
      delay(1000);
      n++;
    }
    else delay(60000);
    
}

String makeDataString(){
  return String(analogRead(sensorPin)) + “, ” + String(millis()) + “; “;
}
 

Conclusion

Once the pump has run for two hours, the power will be turned off and the data from the SD card will be transferred to a computer. Using Ohm’s Law the voltage across the resistor will show the current through the system. The data will show what kind of trend, if any, the current draw has through the pump. It will also show if the current draw varies with a resolution of one minute.

This test will be repeated for two other pumps. Then it will be repeated with water flowing through the pump tube.

New Design: Water Sampler 4040

Abstract

I finished the new design of the 24-bottle water sampler which will be fabricated within the next week before the electronics PCB gets here. The new design is made entirely out of 4040 (a 40 mm x 40 mm profile) extruded aluminum, common store-bought joints, and 3D printed components.


water sampler 40404 renderwater sampler 40404 render

Objective

This redesign solves several issues with the original foam enclosure:

1. The 4040 frame does not require a laser cutter to manufacture

2. The frame is rigid

3. Mounting objects rigidly to the frame is very easy

Materials and Methods

This design uses 2 primary materials at the moment: 4040 extruded aluminum, and 3D printed ABS plastic. All of the printed parts could be replaced with machined mounts and brackets in the absence of a 3D printer. 4040 was chosen for the frame material because of its ease of use and because we have tons of it here at the lab, but future designs will most likely use slimmer extrusions like 2020 to save cost and weight.

Explanation of the Design

Four long extrusions make up the outer corners of the frame. They are 600mm long, roughly corresponding to the 24 inch length of the original design. The short outer-frame pieces are all 210 mm long to provide enough space for the bags to hang. A 600mm length piece of 4040 runs across the top and provides channels to mount the valves, pumps, and electronics. Two 520mm lengths of 4040 across the sides, offset from the top by a few centimeters, provide the channels for the bag caps which the sample bags hang from.

The orange brackets are 3D printed and connect the central channel perpendicularly to to the frame. Other brackets are store-bought and aren’t included in the design. All mounting is done using t-nuts and/or t-bolts that slide in to the 4040 channel to limit the amount of machining required to assemble the sampler. A thin sheet of PETG plastic will cover the top of the assembly and protect the device from rain but could easily be replaced with a large trash bag or tarp.

New Water Sampler Electronics Board

After lots of struggling with the current perf board electronics, we decided getting a PCB made was the way to go. The electronics have changed quite a bit since the last version so I started this one from scratch.


Changes include many more connections to the arduino, headers to connect the H-bridge and RTC breakouts, and removing the MOSFETs. The PCB includes a proper ground plane, our logo, and holes for mounting!


The primary benefit of moving to a PCB is the ability to use a rectangular connector on the board and insulation-displacement-connector for the ribbon cable, which means that we will be able to snap the 50-wire cable on and off the board. The quantity of connections made for a messy perf board and caused a lot of headaches while troubleshooting malfunctions. Despite the current setup working, it wouldn’t be reliable in the field.


WaterSamplerBoard_v1WaterSamplerBoard_v1

There are a few changes I need to make to the design, such as optimizing the sizes of the VCC traces, but it should be sent out to be manufactured soon!

Reversing The Motor Direction To Drain A Sample

I’ve attached a video of the nearly finished water sampler’s ability to drain a sample without disconnecting the bag from the system. The current system is not proven to be air-tight and should not be expected to be so, but this will help to reduce error and eliminate the need to disassemble the tubing. Instead, the user can specify which bag to sample and run the pumps in reverse through serial commands through a computer console.

A Successful Test

After about a week of waiting, the Adafruit DRV8871 H-bridge motor driver breakouts were delivered. They will replace the MOSFET circuit driving the pumps, which were allowing all kinds of noise and voltage spikes and caused the TPIC shift registers to reset every instance the pumps were switched on. Additionally, the previous electronics setup was mysteriously allowing the valves to leak water through to the sample bags when switched off. With the pumps being driven by the H-bridge, this problem has completely disappeared. The original cause was most likely related to the valves “soft resetting”, where each valve was neither completely off nor completely on after the pump was powered.

We just received an email today letting us know that the rest of the valves have finally shipped, which will allow us to completely assemble our 24 bag sampler! While we wait for that, I’ll be working on translating the electronics to a PCB and getting that printed. I’ll also be reviewing the design and adding more functionality to the code.

I recorded of a video of the system in action, included below, which is the first recorded successful test of our water sampler!

Checkvalves… An update!

The rain catchment check valve was essentially shelved mid summer to move on to projects that showed more promise after poor performance of the design. Recently a researcher requested I send a couple check valves to her to set up in Kenya later in March, and so I decided to spend some time seeing if I could redesign the checkvalve in a more purposeful manner rather than trial and error, this time with more knowledge and resources (the Fusion3 F400 3D printer is so fast!). The purpose of the rain catchment check valve is to allow water through flow, while limiting the size of (ideally sealing) the drain to significantly reduce evaporation of collected water samples. The water flows from the TAHMO station to the checkvalve and drains into a collection bag.

This design would be based on a similar function as the last one: water flows into a chamber and raises a buoy, opening a drain that allows the water in the chamber to flow down and into the collection bag. I decided to incorporate an O-ring to assist in blocking the drain when little to no water is left in the chamber. While the original design allowed the buoy to be printed inside the chamber during the same print, using an o-ring meant the chamber and buoy should be printed as separate parts. This actually turned out to work better, anyways. In order to seal the top of the chamber a third part, the cap, would need to be made. I designed it to be twisted on the outside of the chamber’s top, pressing a large O-ring against the top edge of the chamber with enough force to form a watertight seal. 

To connect to the TAHMO station, the side opening slides over the TAHMO’s spout and a long ziptie is looped around the TAHMO station and the valve’s outer wall, pressing the two together. This means the water enters the chamber at a low velocity and angle, which is significant because the momentum of the water is directed nearly horizontally and initially at the top of the buoy. This means the force on the buoy from the flowrate of the water acts to tilt it off of its seal rather than add force to the seal of the O-ring.

One of the largest issues in the original design was the buoy’s lack of a correcting method after being tilted. There were two ways I could fix this: place the center of mass of the buoy as low as possible, and to find a way to limit its movement to the vertical axis. While I kept the first option in mind, such a small mass (<3g) can easily be overcome by small pressures such as a water droplet or a defect in the print. The fins on the side of the buoy act to prevent more than a couple degrees tilting.

The main problems to overcome are friction and catching on the sides of the chamber walls. Some dimensions require adjusting to properly fit onto the TAHMO station. Overall, this design works significantly better than the previous version.