
Introduction
This is a follow-up to the previous post, “A Simple Pump Test”. There were several complications with storing the pump data on an SD so this post will describe a new method that stores data on the Arduino’s own memory.
Background
In the field, the pumps will be run for 2.5 minutes per sample for 24 samples, resulting in one hour of total runtime. As described in the previous post, the pumps used in the sampler are poorly documented and information on their lifespan and behavior under long periods of use is needed.
The SD breakout board used in the previous test was a 3.3v board and was not compatible with 5v arduino logic without some voltage conversion in between. While it worked some of the time, it resulted in corrupt data after a few points. Rather than using a 5v board or something to step down the signal voltage, the Arduino’s own memory can be used to store a small amount of data.
Arduinos have a small amount of available memory that doesn’t get reset between power cycles, known as EEPROM. A single byte can be stored per register, and an Arduino Uno has 512 available registers.
Setup and Method
A 12v peristaltic dosing pump is wired such that the positive end is connected to a 12v source and the negative end is split between a .85 Ohm resistor and the Arduino’s A0 analog input pin. The Arduino’s GND is connected to GND on the power source and VIN is connected to 12v. The other end of the .85 Ohm resistor is connected to GND.
A jumper wire connects GND to the Arduino’s digital pin 3, which is initialized to INPUT_PULLUP.
When powered on, the Arduino continuously checks that pin 3 is LOW. If it is, the voltage across the .85 ohm resistor is effectively measured via an analog read of pin A0 and the value is stored in a register of EEPROM. The register address is incremented and the loop resets.
If pin 3 is HIGH, data collection is turned off and the Arduino checks for a serial input of “p”. If the user inputs in the serial monitor “p” then it prints all the data from the registers separated by spaces. This data should be copied and pasted into a text file, but can be reprinted as long as pin 3 is HIGH.
Code
// A simple voltage logger that is
#include <EEPROM.h>
const int sensorPin = A0;
const int startPin = 3;
long sTime = 0; // last sample time
int maxPoints = 240; // maximum number of points to store
int sDelay = 30000; // delay between samples
int addr = 0;
void storeData();
void setup() {
pinMode(startPin,INPUT_PULLUP); // if grounded, enable recording
pinMode(sensorPin,INPUT);
Serial.begin(9600);
Serial.println(“Initializing…”);
analogRead(sensorPin);
delay(1000);
analogRead(sensorPin);
delay(1000);
analogRead(sensorPin);
delay(1000);
analogRead(sensorPin);
delay(1000);
Serial.println(“Initialized.”);
}
void loop() {
//If datalogging is enabled, store data in a new address
if(!digitalRead(startPin)){
if(millis() – sTime > sDelay){
Serial.println(“reading data point ” + String(addr));
storeData();
}
}
else{
Serial.println(“Enter ‘p’ to print out data”);
while(digitalRead(startPin)){
int input = 0;
if(Serial.available() > 0){
input = Serial.read();
}
if (input == 112){
for(int i = 0; i < maxPoints && i < EEPROM.length(); i++){
Serial.print(EEPROM.read(i));
Serial.print(” “);
}
Serial.println();
}
}
}
}
/*
* store the sensorPin voltage and increment the address. If the address has
* reached the limit of number of the points or hit the last address of
* the EEPROM, don’t store data and return from the function.
*/
void storeData(){
if(addr == EEPROM.length() || addr == maxPoints){
Serial.println(“Max addr reached”);
sTime = millis();
return;
}
EEPROM.write(addr, analogRead(sensorPin)/4);
sTime = millis();
addr++;
}
Python Code
# This code will take in data via a text file that was collected using
# the pumptest arduino code. Data points should be separated by spaces.
import matplotlib.pyplot as plt
data = []
splitter = []
voltage = []
current = []
average = []
avg = 0
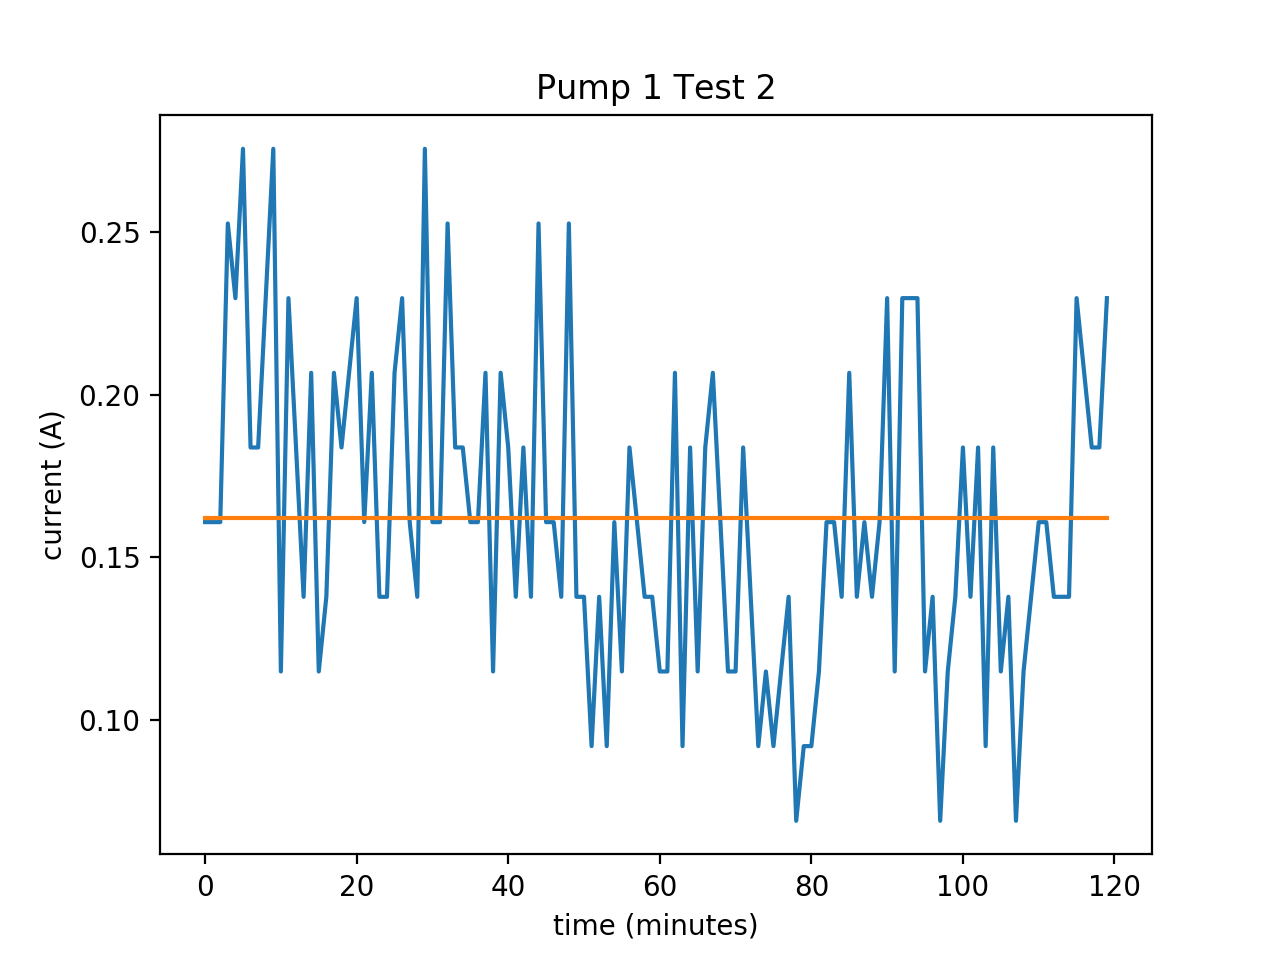
with open(‘pumplog_2_p1t2.txt’) as f: #file name for test data to be graphed
reader = f.readlines() #read in the data
for line in reader: #split up the data. Could be conbined with converting to int but is more readable this way.
splitter.append(line.split())
for point in splitter[0]:
data.append(int(point) * 4) # turn each point of data into an int. Data values were divided by 4
# to fit into EEPROM.
for point in data: # calculate the voltage at each point.
voltage.append(point * 5 / 1024)
for point in voltage: # calculate the current at each point.
current.append(point / .85)
for point in current: # calculate the average current.
avg += point
avg = avg / len(data)
for point in data: # turn average into a plottable list
average.append(avg)
plt.plot(current)
plt.plot(average)
plt.title(“Pump 1 Test 2”) #rename based on test
plt.xlabel(“time (minutes)”)
plt.ylabel(“current (A)”)
plt.show()
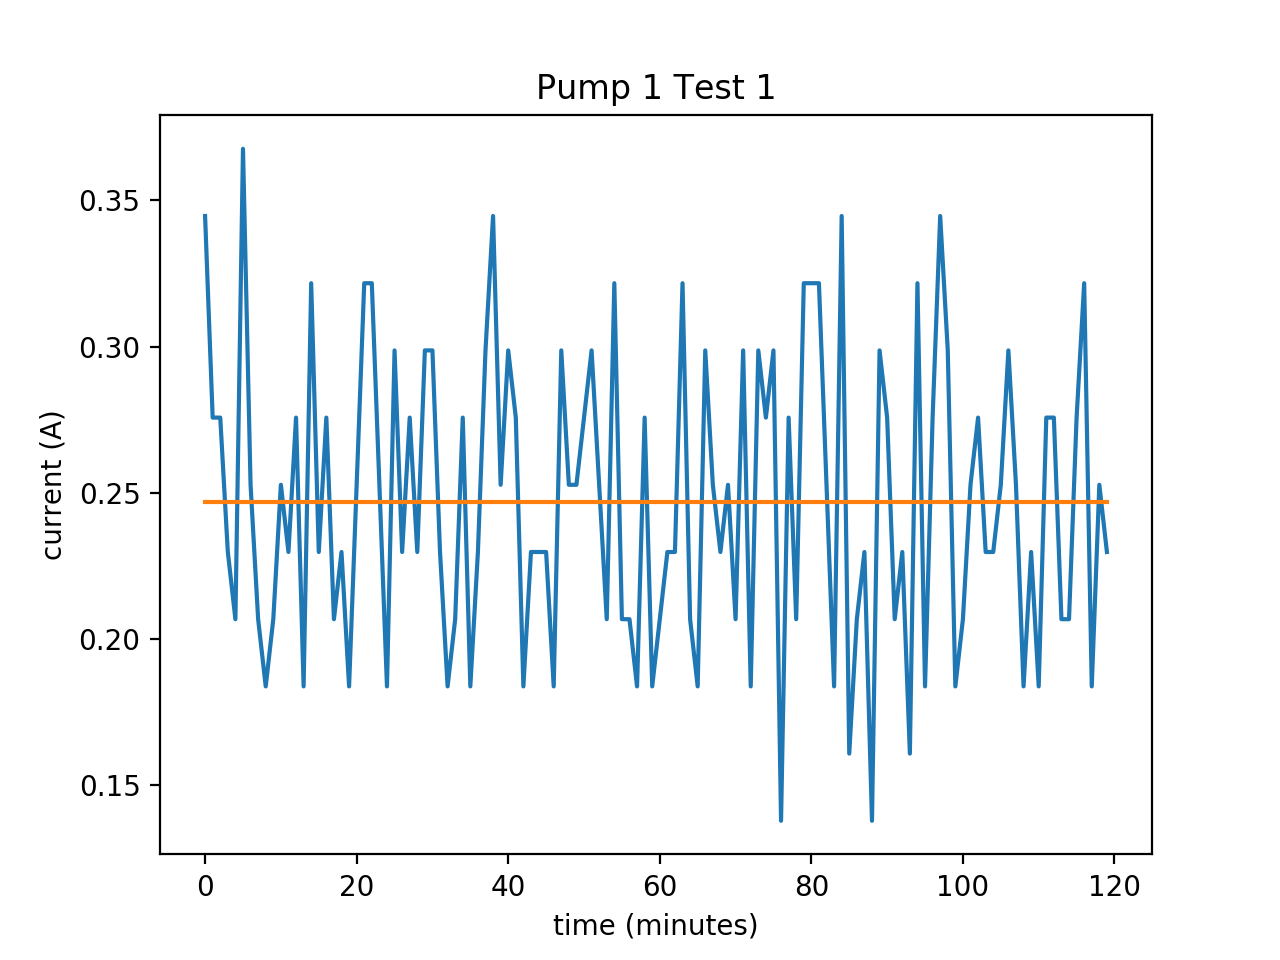
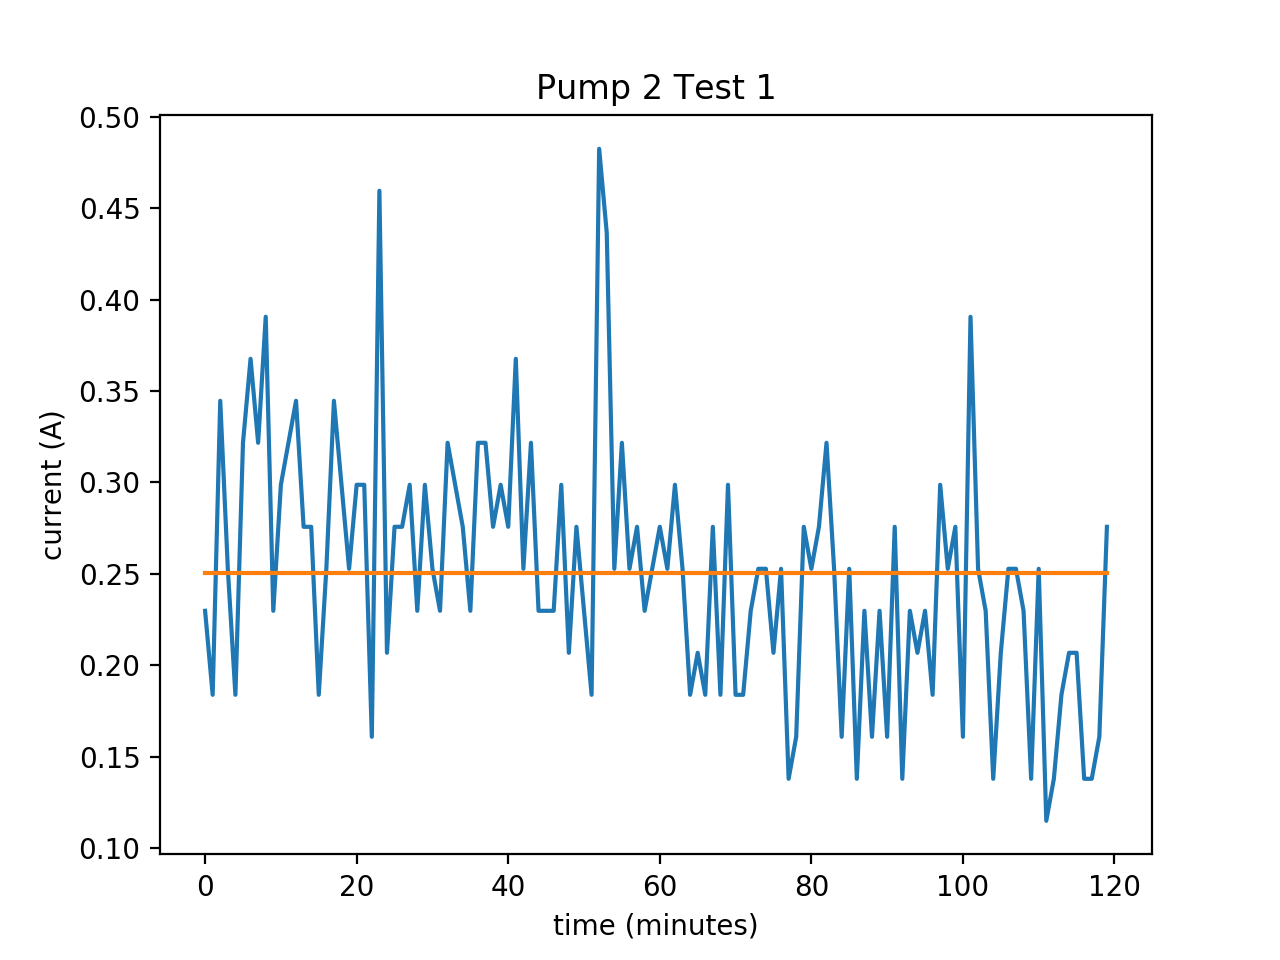
Initial Results
Conclusion
Three tests have been run so far. They were graphed using Python 3 and matplotlib.pyplot. Another test is currently being run on the second pump. The data between the two pumps will be compared using a two-sample T test to check if the two pumps perform the same. The same method will be used for the pumps under condition of pumping water.
The initial three tests might suggest that there is a long term decrease in the pumps’ current draw. Future tests should be conducted for a full day and a linear regression analysis should be performed. More importantly, such inconsistency in the current draw suggests the flow rate though these pumps is not constant. A test should be conducted to observe the trend and variance in the mass flow rate of water through the pump via a logging scale. A better conclusion can be made once the first round of testing is finished and statistically analyzed.