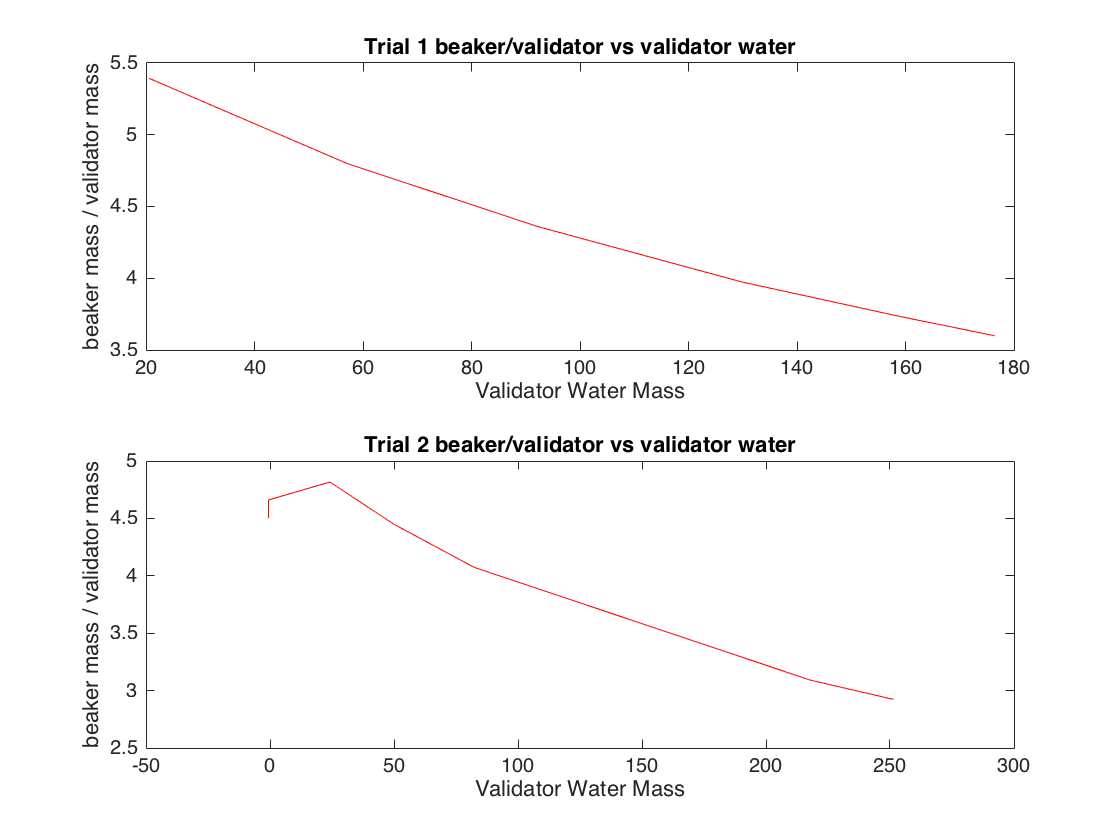
After another day of data, I created another set of graphs that displayed the relationship between the ratio of beaker mass to validator mass and validator’s water mass (calculated by subtracting the dry weight of the validator from each data point), per Selker’s request. What this graph shows is that the validator’s water evaporates at a faster rate relative to the validator’s total mass than the water in the beaker. Below is the set of graphs for trial 1 and trial 2.