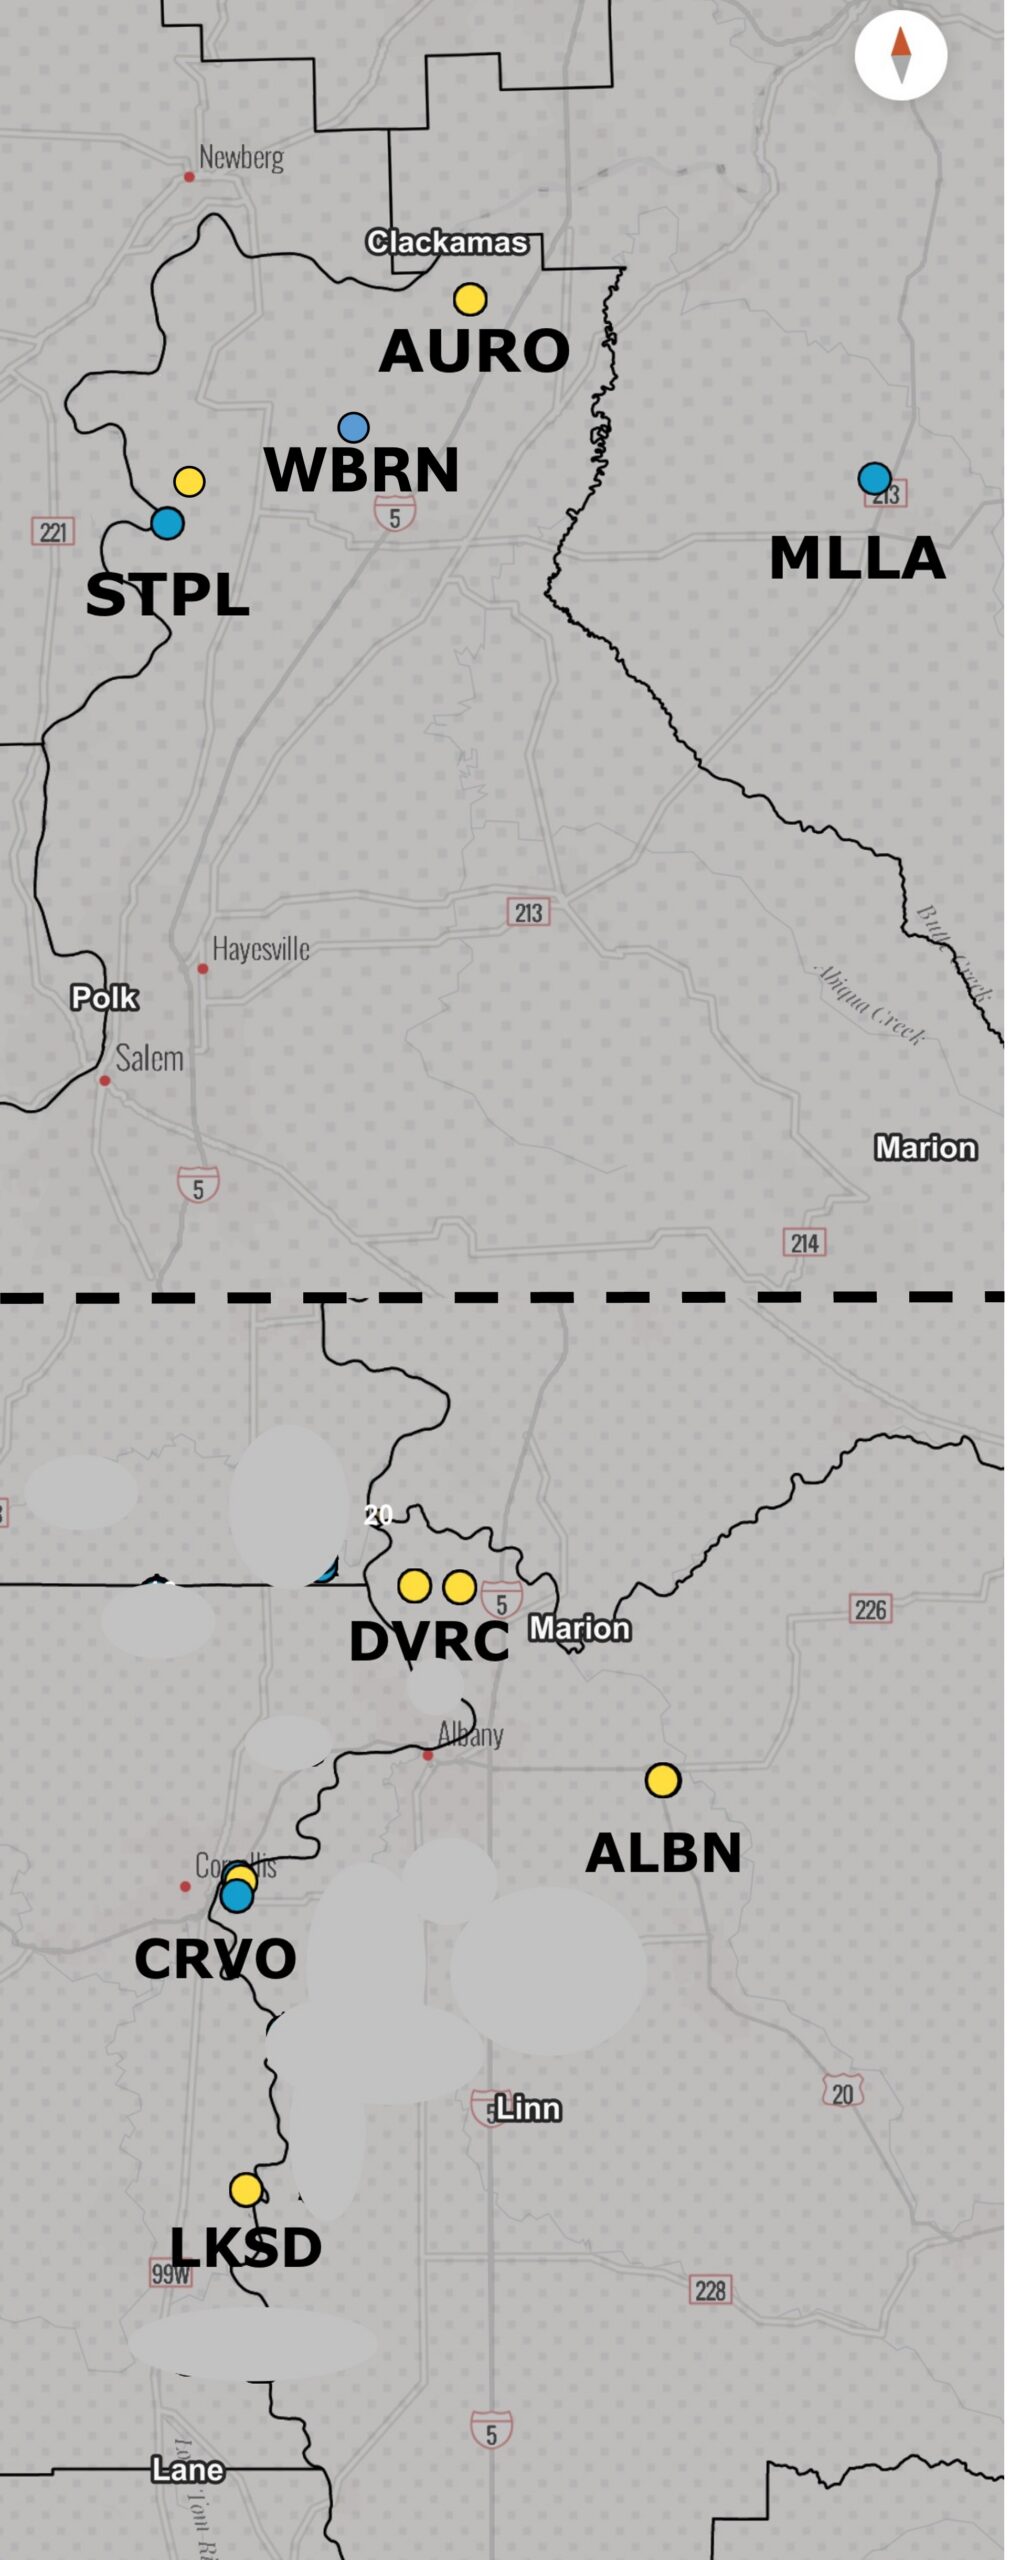
- The data table shows trap counts of adult insects from vegetable fields and a research farm within the Willamette Valley, OR. through July 9th, 2026. See the site code map for approximate locations.
- Spotted cucumber beetles are increasing – cabbage looper counts vary by location – view the full report (.pdf below) for details.
- Our trap counts feed into a collaborative, multi-crop system called the Oregon Pest Monitoring Network. Their ‘pest forecast tool‘ provides interactive maps and tables to estimate impact based on pest phenology and existing degree day models.
Author Archives: greenje
Data Report – June 30th
2026 Site codes

Data Report – June 12th
- The table below shows trap counts from vegetable fields and a research farm within the Willamette Valley, OR. through June 11th, 2026.
- ** Black cutworm and corn earworm counts are both above normal – view full report (.pdf below) for details.
- Additional monitoring sites are being added – please contact me if you have brassica fields.
jessica.green[at]oregonstate[dot]edu
Data Report – August 14th
- Page 1 of the report below (see .pdf file) shows trap counts from monitored fields through August 6th. A map of the field sites is available.
- Page 2 of the report includes:
- a written summary of the data and
- a graph of cucumber beetle/southern corn rootworm (Diabrotica u. undecimpunctata) activity 2025 vs. 1999-2015.
Data Report – July 31st
- The table below shows trap counts from vegetable fields and a research farm within the Willamette Valley, OR. through July 23rd.
- A map of the field sites describes location codes.
Data Report – July 22nd
- The table below shows trap counts from vegetable fields and a research farm within the Willamette Valley, OR. through July 15th.
- A map of the field sites describes location codes.
- Most pests continue to be detected dramatically less than they usually are for this time of year. Since May, there have been almost no black cutworm, cabbage looper, corn earworm, or diamondback moths in the traps.
- Diabrotica undecimpunctata (also known as spotted cucumber beetle) activity is increasing. However, it is still within normal levels of 2-5 per day at monitored sites.
- Additionally, we are partnering with a national project to monitor Diabrotica virgifera beetle, the western corn rootworm. More information about that effort can be found on the Oregon IPM Center’s website.
Data Report – June 23rd
- Pheromone traps are placed at commercial vegetable fields as well as at the OSU Vegetable Research Farm in Corvallis.
- A map of field sites and their associated codes is included in the .pdf below.
- ***So far, all monitored species are well-below their normal activity levels.***
- Trap counts are available real-time on the Oregon Pest Monitoring Network (OPMN). This system includes a data dashboard with an interactive map of monitored locations. Users can select filters to refine results by crop or pest, and access predictive forecasts for ~12 pest species. Check it out at: https://beav.es/OPMN
Data Report – July 22nd
- Per-site and regional averages remain much lower than normal.
- Remember to continue regular scouting for flea beetles and aphids.
- Cabbage white butterfly counts are done visually (not via pheromone traps). On a sunny day, scan the landscape for adults; they have a distinctive, erratic flight pattern. If many are seen, return in 5-7 days to check for rocket-shaped, singular eggs or small larvae on the underside of leaves.
- We are noticing increased activity of western corn rootworm (Diabrotica virgifera) beetles in corn fields. Related to 12-spot, adults have black ‘smear’ stripes on the elytra, rather than spots. Our student, Kyleah, is monitoring rootworm beetles as part of a larger, national network. Read her summary to learn more about what we’ve seen so far.
View the DATA TABLE below:
Data Report – July 10th
- Overall, a very slow start! Below normal looper levels and almost no black cutworms detected since May.
- True armyworm counts are increasing, both at Hyslop and throughout the valley (monitored near cereal, grass, and forage fields).
- The hatch of winter cutworm at Hyslop is alarming, but aligned with what we know so far about their lifecycle. Females require about 4 weeks to mature eggs, which means larvae could be present by early to mid-August.
- Given the recent heat wave, flea beetles will likely be present on brassicas. Scout vigilantly and often.
View the DATA TABLE below: