Nordic RF shields for Adafruit ProTrinket

By: Chet Udell

Abstract:

This post provides an update on the near-range (up to 100m) RF branch of the Internet of Agriculture Project. New PCB design makes an improvement on a general-purpose, opensource, plug-n-play wireless sensor kit.

Objective:

The previous version of the RF IoT sensor kit had some minor layout flaws, and failed to accommodate a ‘handshake’ button for auto synchronizing an RF sensor node with its base station, a power button, and some other small details. A new version adds these features and reduces the overall device volume by one-third.

Methods and Materials:

Eagle CAD was used to modify a previous version of the PCB. A whole new layout was explored that reduced overall device volume substantially and new features added including: power button, handshake button, removing 12VDC power adapter on base receiver (for now), placing LiPo Backpack on the underside of the transmitter, and creating a “stackable” offset for the ProTrinket, should anyone wish to make further shields to extend this devices capacity.

Results:

See below! PCBs are in the fab house now. . .


WASN_HonorsBrd.pngWASN_HonorsBrd.png


Toward Comparing RFID Moisture Performance with Industry Standards: Decagon

Author: Chet Udell


Abstract:

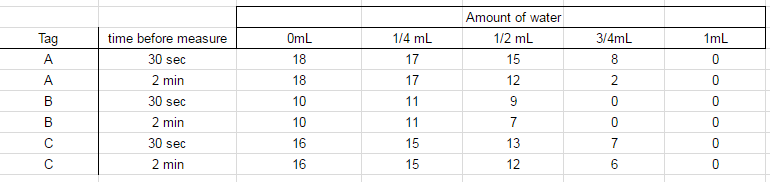
Our previous experiments have shown the RFID moisture sensor tags are in-fact reading gradual changes in soil moisture content. The next step is to compare the performance, consistency, and resolution of these tags to industry standard equipment to see how it measures up using Decagon Devices soil moisture sensors. In this post, Chet gets a 5TM Soil Moisture and Temperature Sensor chatting directly with an Arduino to deploy in experiments, and eventually integrate into the battery of available Internet of Ag sensors.

Objective:

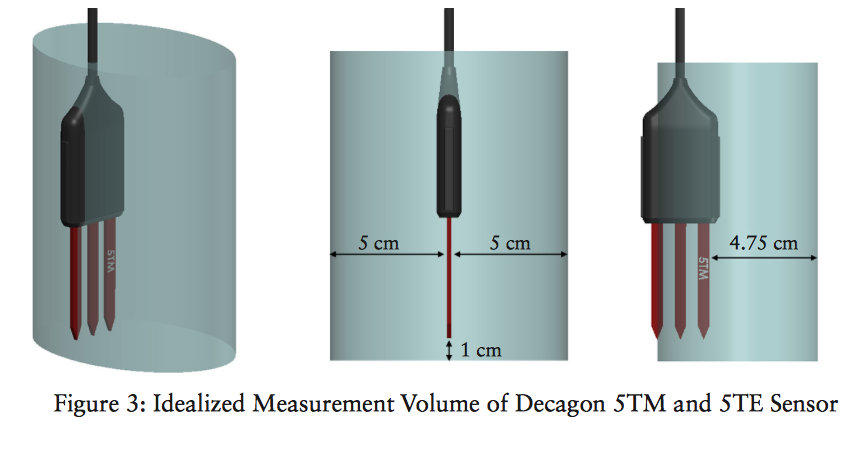
In order to compare the performance, consistency, and resolution of the RFID moisture tags, we hope to conduct some comparative experiments between these and Decagon’s popular soil moisture sensors, namely the 5TM (soil moisture + temp). Decagon’s readers can be pricey and we want to use these sensors in very specific ways, so the objective here is to get the sensors talking directly with an Arduino. The following method can be used to read any Decagon soil moisture sensor over the SDI-12 serial protocol. For more info on SDI-12, visit here. Why the 5TM? The 5TM determines volumetric water content (VWC) by measuring the dielectric constant of the soil (or other media) using capacitance/frequency domain technology. Signal filtering minimizes salinity and textural effects, making the 5TM accurate in most soils and soilless media. Factory calibrations are included for mineral soils, potting soils, rockwool, and perlite. – from http://www.decagon.com/en/soils/volumetric-water-content-sensors/5tm-vwc-temp/

Materials and Methods

What you’ll need:

  1. Download the above library, unzip. Rename the file “SDISerial” and place in the folder: <Arduinno root folder> / libraries
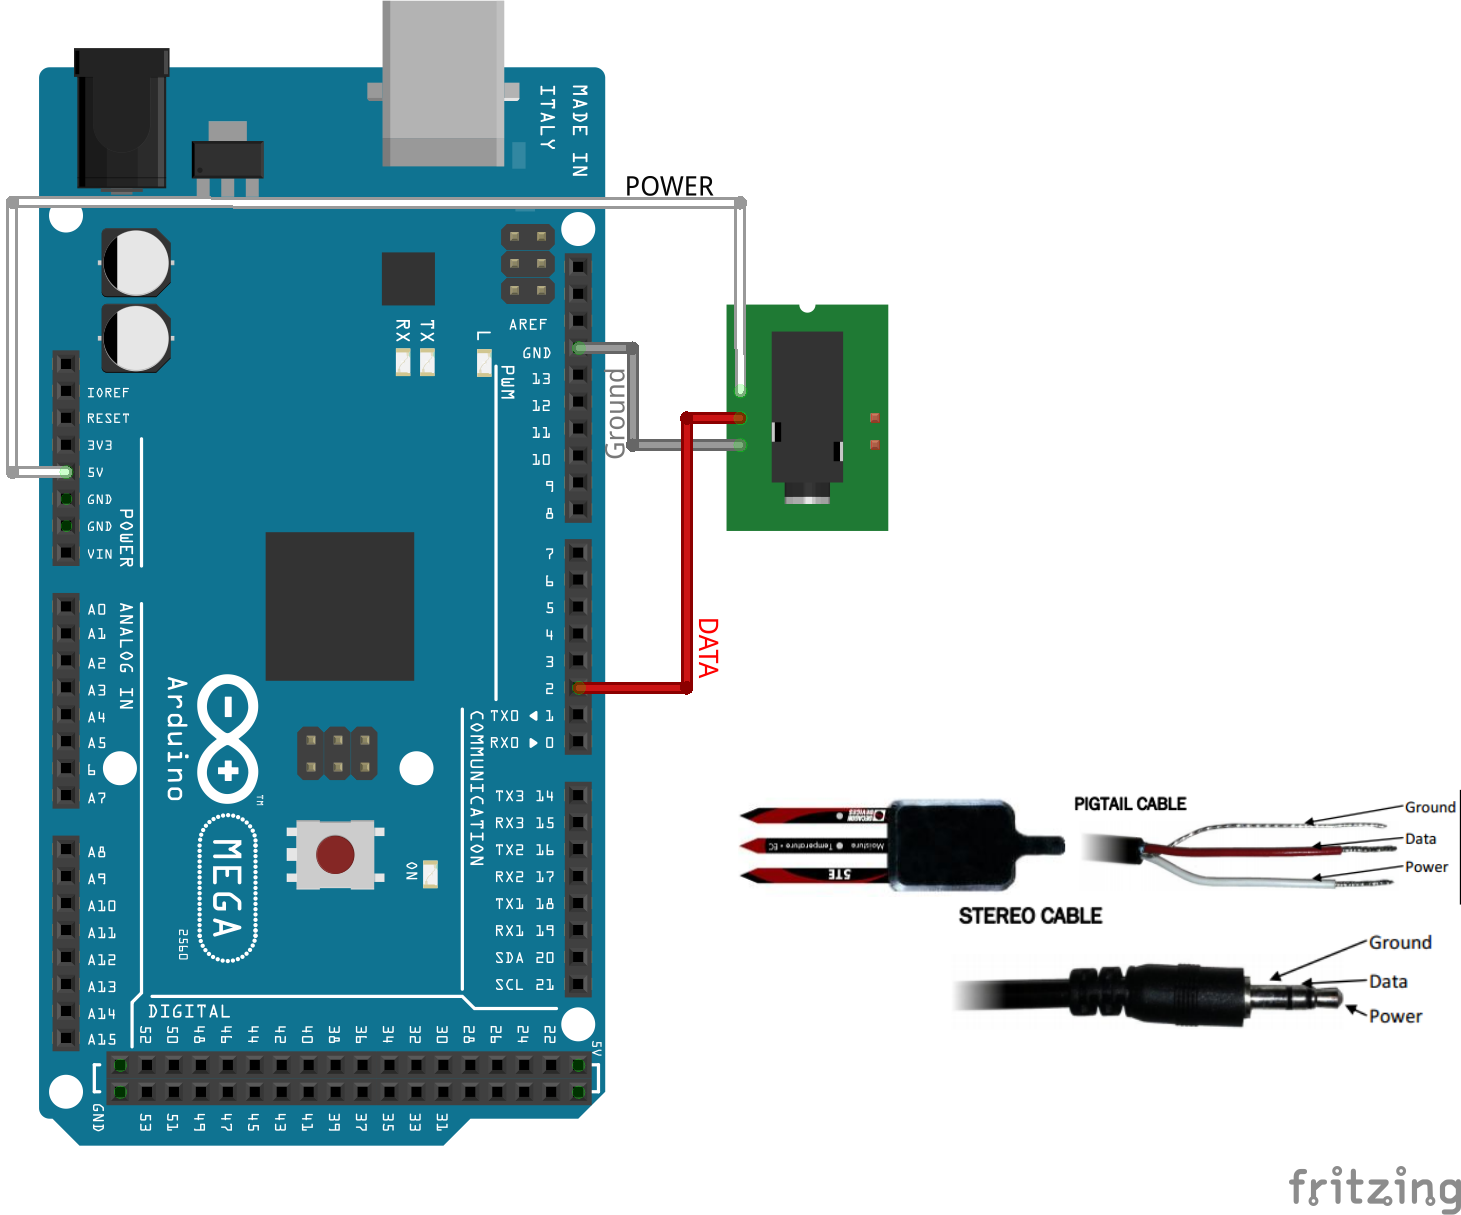
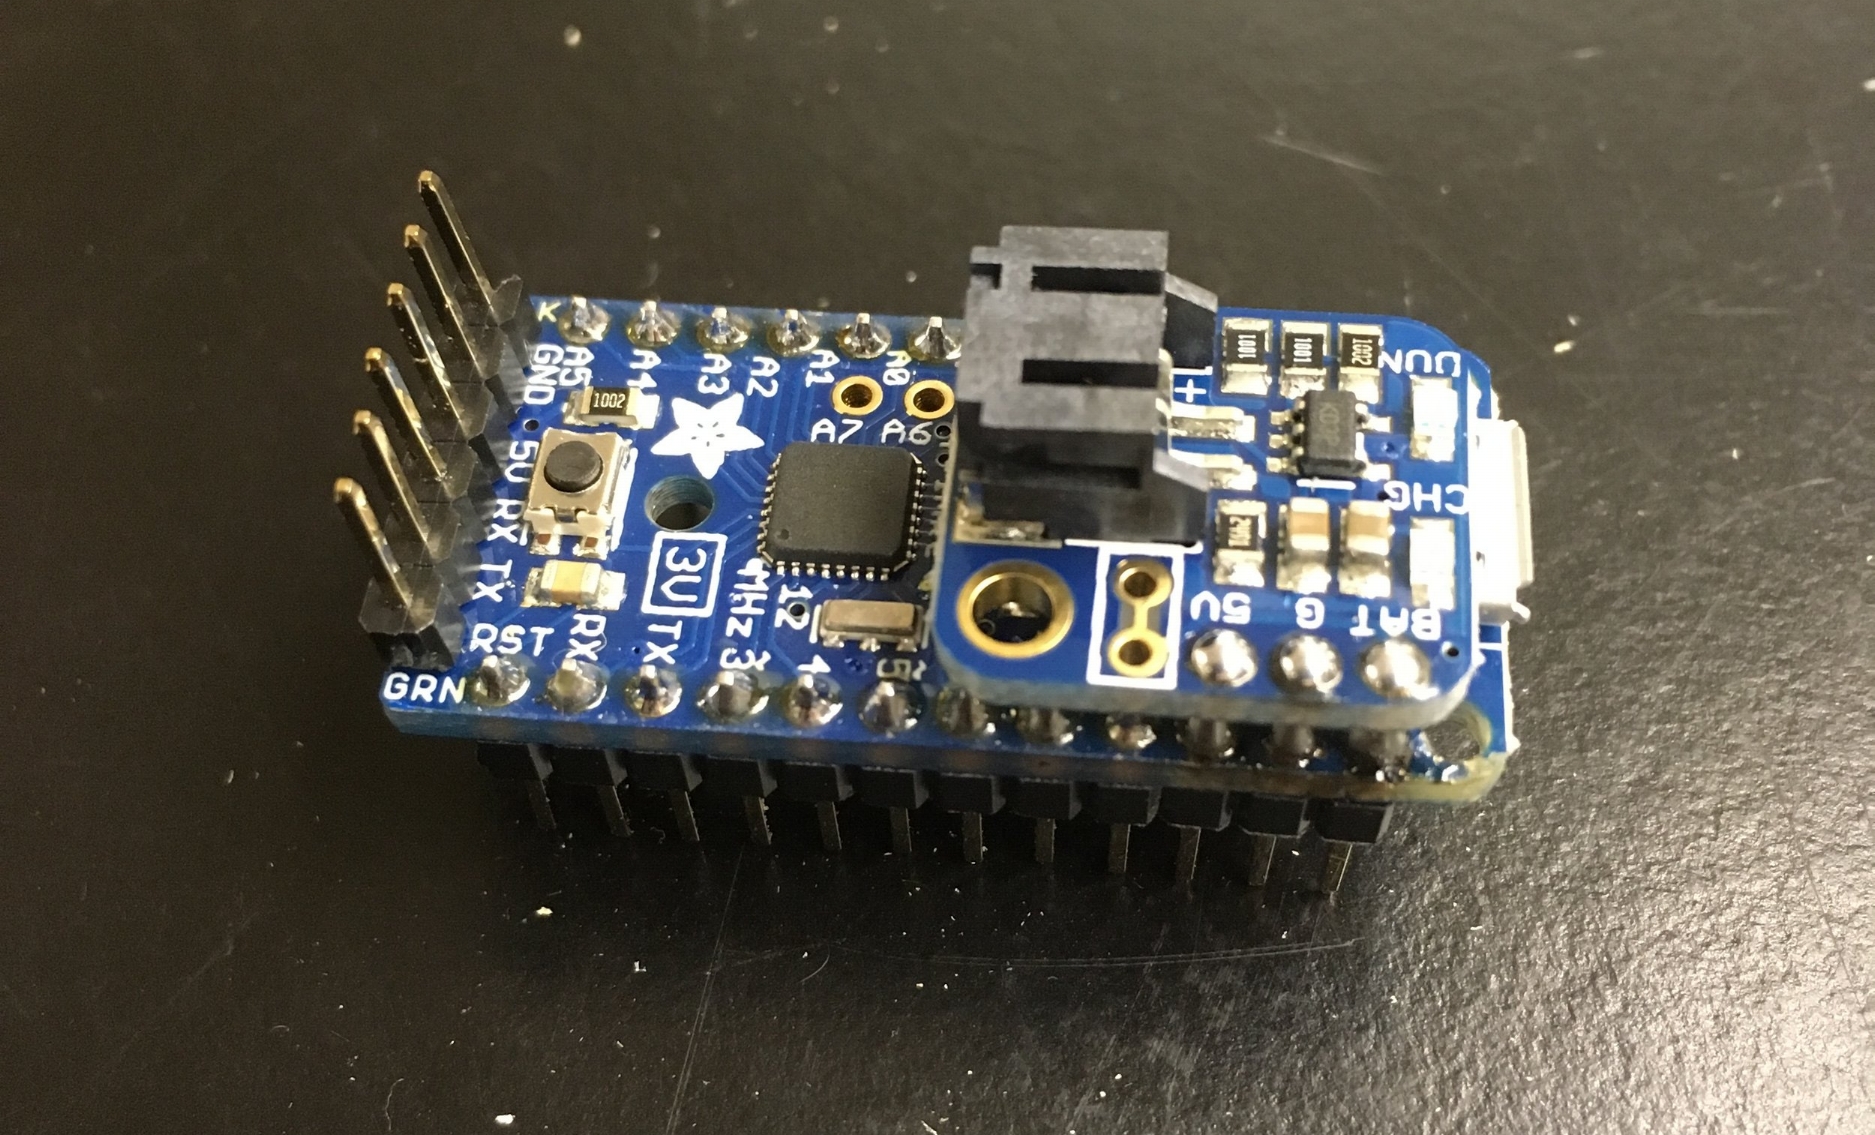
  2. Following the instructions on the library GitHub page (image included here), clip the 1/8 inch jack off of the Decagon sensor (ouch), strip off the leads to reveal a white, red, and “shield” wires. Solder each wire to a 0.1in pitch male header to use in a breadboard.
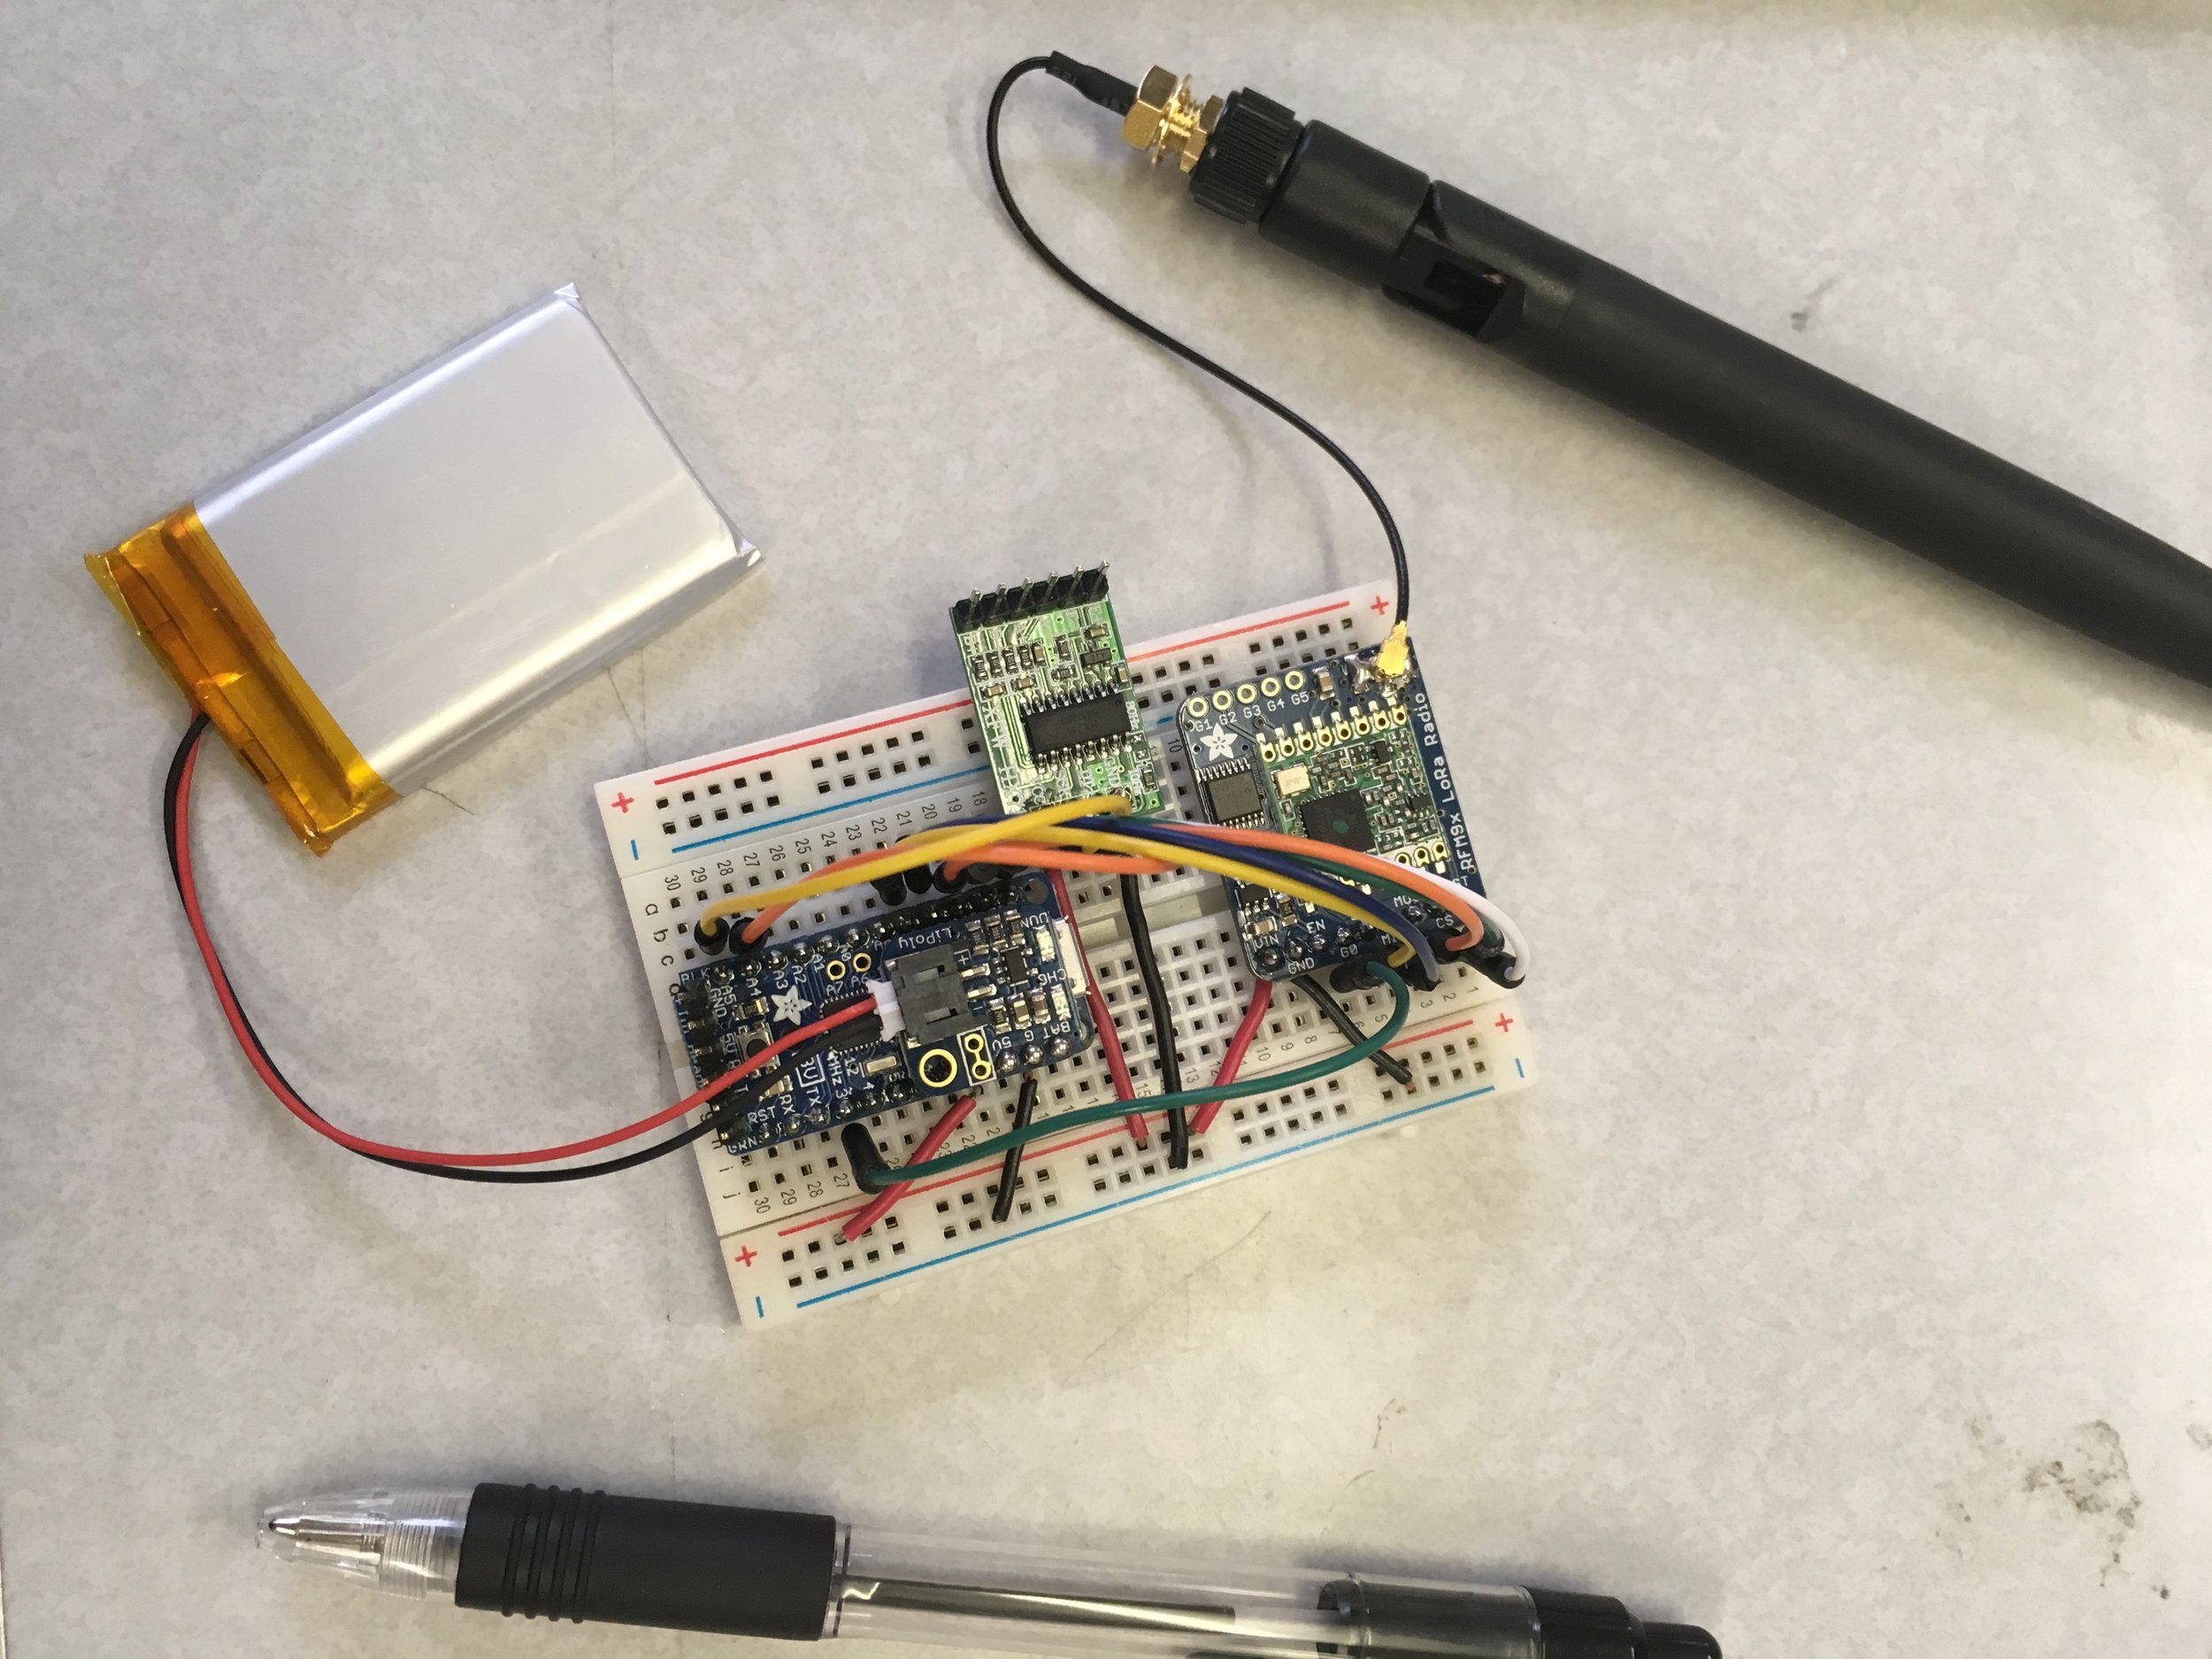
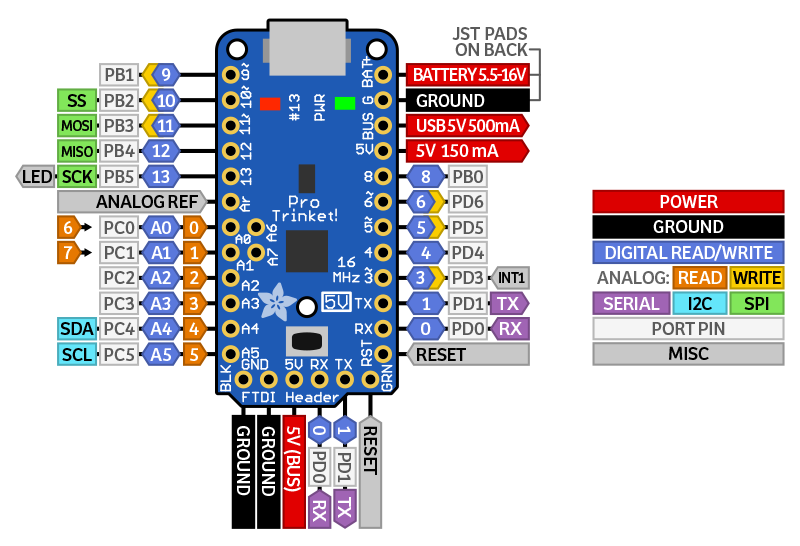
  3. Connect your arduino up to a breadboard and the 5TM lines White => 5V, Red => DATA_PIN, Shield => GND
  4. DATA_PIN MUST be connected to a pin with a hardware interrupt (for Uno, P2 or P3).
  5. Use the below code and you’ll get soil moisture and temp readings (in Celsius).
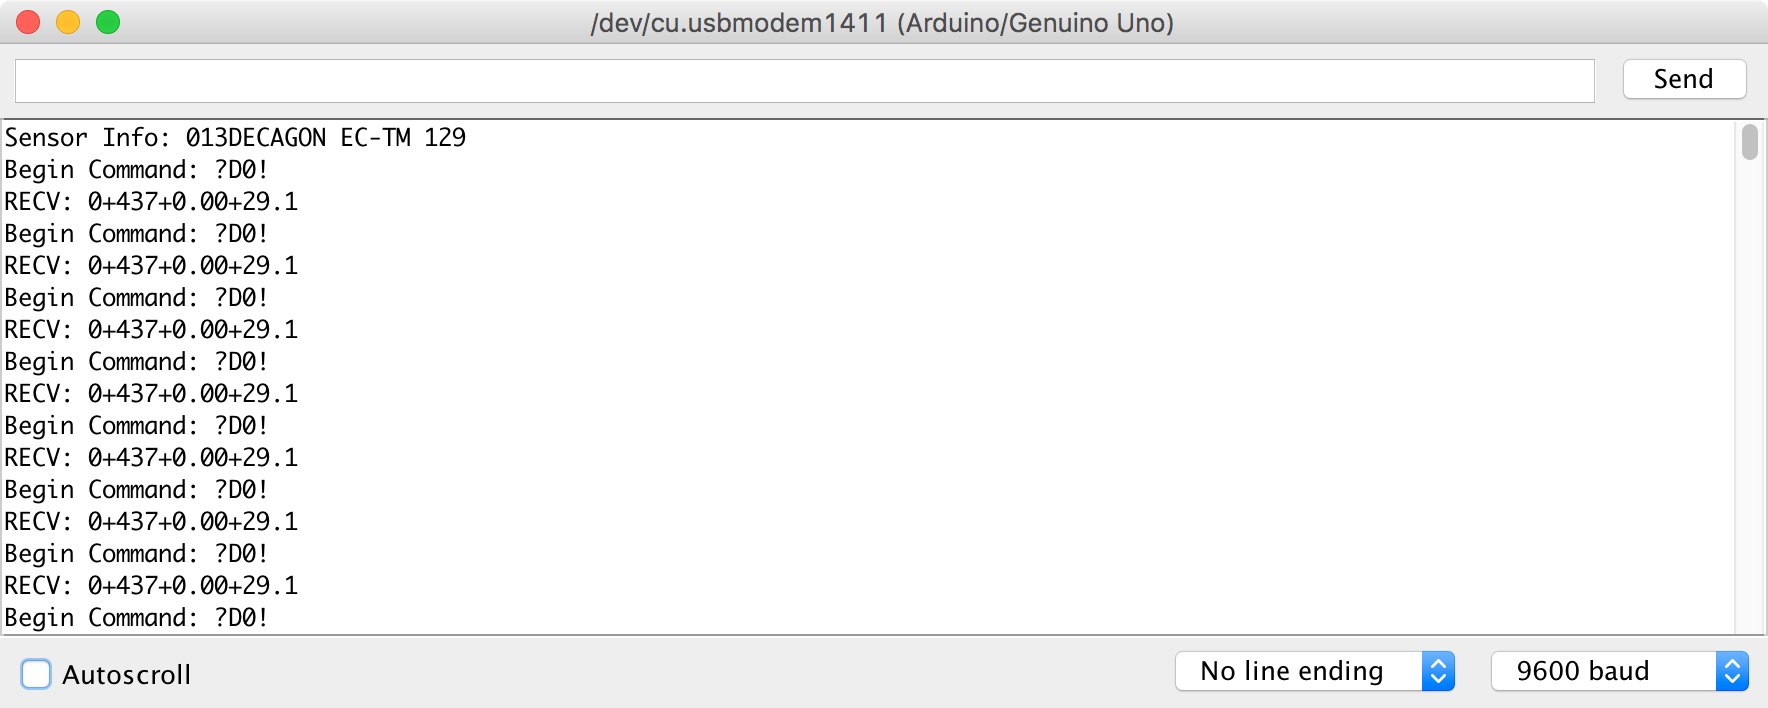
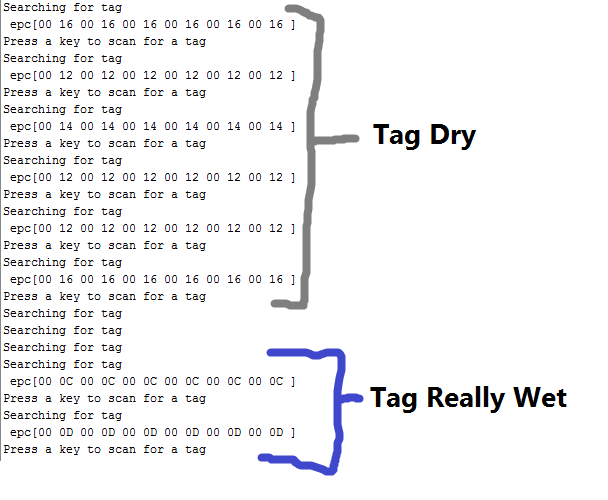
  6. Your output will look like the below screen print

Results

As you’ll see from the below code and printout, the SDISerial library enables the arduino to send commands to the 5TM to procure data. Now, we can employ these sensors in almost any Arduino application! This is done by creating an instance of SDISerial connection(DATA_PIN); and then starting the serial connection using connection.begin();

You can then use the function connection.sdi_query() to send various commands to the 5TM. This function uses 2 parameters: (command, timeout-duration)

connection.sdi_query(“?M!”,1000); This sends a message to query the first device on the bus – which in use seems to refresh the values of the sensor readings, but does not return the sensor reading itself. Instead, it returns a message that tells you the maximum wait before the measurement is ready. timeout set for one second.

connection.sdi_query(“?I!”,1000); will get sensor info and timeout if no response in 1 second

connection.sdi_query(“?D0!”,1000); will query the 5TM for sensor data


Hookup on a Mega, similar to the Uno


Resulting output
/*
Tested on UNO R3.
Sketch was built with Arduino 1.6.12
Dependency: Joran Beasley SDISerial Library
Accessed May 26, 2017 here:
https://github.com/joranbeasley/SDISerial

download and rename folder "SDISerial" and place in  "<ARDUINO_ROOT>/libraries"

Tested with the with the 5TM Soil Moisture and Temp Sensor:
http://www.decagon.com/en/soils/volumetric-water-content-sensors/5tm-vwc-temp/

Hook-up:
the WHITE wire goed to 5V. however you could also connect it to a pin and drive power only when you wanted it
the RED wire is the DATA_PIN. - you must hook it up to a pin that can process interrupts (see link below)  
the remaining "shield" wire must be connected to ground
*/

#include <SDISerial.h>
#include <string.h>
#define DATA_PIN 2
SDISerial connection(DATA_PIN);
char output_buffer[125]; // just for uart prints
char tmp_buffer[4];
char* resp; // Pointer to response char

//initialize variables
void setup(){
      connection.begin();
      Serial.begin(9600);//so we can print to standard uart
      //small delay to let the sensor do its startup stuff
      delay(3000);//3 seconds should be more than enough
      char* sensor_info = connection.sdi_query("?I!",1000); // get sensor info
      //print to uart
      sprintf(output_buffer,"Sensor Info: %s",sensor_info?sensor_info:"No Response");
      Serial.println(output_buffer);
}

//main loop
void loop(){

   //print to uart
    Serial.println("Begin Command: ?M!");   
    //send measurement query (M) to the first device on our bus
    resp = connection.sdi_query("?M!",1000);//1 second timeout
    //this really just returns a message that tells you the maximum wait before the measurement is ready
    
    sprintf(output_buffer,"RECV: %s",resp?resp:"No Response Recieved!!");
    Serial.println(output_buffer);
    delay(1000);//sleep for 1 seconds before the next command
    
    //print to uart
    Serial.println("Begin Command: ?D0!");
    resp = connection.sdi_query("?D0!",1000);//1 second timeout
    
    sprintf(output_buffer,"RECV: %s",resp?resp:"No Response Recieved!!");
    Serial.println(output_buffer);
    delay(3000);//sleep for 10 seconds before the next read
  
}

Moisture Reader Update 3

Author: Brett Stoddard

Hi everyone, it’s been a while since the last update with the moisture sensor and a lot of progress has been made in that time. Progress has been made with confirming moisture readings and on the code side of things.

After a few more rounds of testing I have confirmed that the tags, for sure, can be used to measure a range of moisture levels. The test involved dropping different volumes of water onto the edge of a tag’s tail. The tail would soak some of that water up and onto the moisture sensitive part of the tag. The tails were about an inch long and increments of 25mL of water was dripped onto them using a precision eyedropper. The data (TABLE 1) showed a definite positive correlation which is good news. I also did a few trials on really wet and really dry soil and the tags were able to tell the difference between a desert and a swamp, although a more accurate of testing tags in soil was needed–which is where the next development comes into play.


TABLE 1. Table of tag measurements given a certian amount of water on the edge of the tail of a tag and a certian amount of time for the water to work its way up the tag.


Since the last post, I have gotten the RFID reader shield and the GPS logger shield to work together. I have added a polished example code bit onto the GitHub library. Available here, it records the average value of the RFID tag after 100 measurements then records measurement from a YL-69+YL-38 moisture sensor. The plan with this reader is to eventually use it to calibrate the values that we’re currently receiving off of the RFID tags (0 for wet, 20 for dry). This will involve setting the YL probe and RFID tag onto the same soil sample and letting it sit there for a few days and take measurements periodically as the soil drys. After we get this data we will be able to tell how well the RFID tags will work for measuring soil moisture.

I have also gone through and updated a little bit of the other example codes to make them work better.

Cheers, Brett Stoddard

We’re Getting Closer! Adding More Functionality to the Final Produce

Author: Marissa Kwon

Abstract:

We’re releasing details about our project after ten weeks of development including support for portable limply batteries, project code/resources, and why some additional functionality is necessary before deployment.


IMG_1984.JPGIMG_1984.JPG

Why It’s Best to Wait:

After much discussion about integrating more functionality into our the Lora/Super Validator, we have decided to postpone field tests for now in favor of adding a few more weather and climate sensors to the Super Validator, measuring power consumption, and saving power by adding in an external clock to enable the micro controller to go into sleep mode until the clock’s alarm periodically wakes it.

What’s Next:

I have a working temperature and humidity sensor set up to write out data measured to an SD card, and our next goal is to be able to set up the LoRa radiopacket array to also send these values to from a remote location.  Granted that these field devices also won’t have unlimited or even large supplies of power readily available, I don’t want our Lora to be wasting power by constantly sending information and waiting for a reply.  Since climate and weather change gradually the user would only need readings about once or twice an hour.  The micro controller is capable of saving power by entering a sleep mode, however it also need and external device to interrupt its sleep so that it can do its job.  That’s when a real time clock will come in handy by sending an alarm to the Protrinket at a certain time every hour to wake it up; after all transmission code is done, the Protrinket can go back to sleep.

Currently our device is powered by a 3.7V, 1000mAh Lithium Polymer battery. Once all the components are working together, I will need to measure the current draw of each component to estimate the final battery life.

Links to Resources:

Here are links to our most recent LoRa Super Validator transmitter and receiver code.

Also here are links the Adafruit site for the new components: SD card reader, Real time clock, and temp/humidity sensor.

And finally here’s more information about the LiPo battery.

MSDS sheet for the LiPo battery

– Marissa Kwon URSA Undergraduate Student Researcher

A First Look at Field Deployment

Author: Marissa Kwon

Abstract:

As progress on the LoRa radios leads to integration into the Evaporometer Project, we take a closer look at some of the aspects of data transmission and providing portable power.

Sending and Printing Float Data:

The LoRa radios use packetized sending of 8 bit integers (corresponding to ACSII values) to relay integer and float data by first taking the integer value, changing each decimal value into the corresponding character (ASCII) value using iota(), and adding this info to the radio packet to be sent.  On the receiving end, the data from the packet array is copied into a separate array, for our purposes its an array of 7 elements/bytes, and uses iota() to change it back into the correct integer value.

For float values to be sent, you need select a decimal value the suits your precision needs.  For the Evaporometer we only decimal values to the ten thousandths place, and since our load cell will be taking measurements < 1000 grams I will need a maximum of 7 digits to store my data. The only difference I needed to make to send floats was to multiply the load cell’s measurement by 10,000 before setting it to the packet, and dividing by 10,000 in the receiver end.  In order to print a float value, I also needed to include the precision value when using Serial.print() like so:

Serial.println(my_array,4);

Attaching the Battery Backpack:

For our field test, it will necessary to rewire the LoRa chip, load cell, and pro trinket onto a smaller breadboard that can fit onto the housing designed for the Evaporometer.  The Pro trinket is now powered off a portable LiPo battery.  The micro-usb connector on the Pro trinket powers the device as well, and plugging the device into a wall outlet through the usb also recharges the LiPo battery.  To improve signal strength the soldered in wire antenna was replaced with uff connector so that a larger antenna could be attached to the LoRa chip. The change in RSSI signal strength measured in the serial monitor reflected the changes I made to the antenna as well as the changes to the operating frequency (after we ramped up our new frequency to 915mHz).


Li-Po battery backpack connected to the ground, 5V, and bus pins on the Pro trinketLi-Po battery backpack connected to the ground, 5V, and bus pins on the Pro trinket

Li-Po battery backpack connected to the ground, 5V, and bus pins on the Pro trinket


transmitter ready for housing;&nbsp;fitted with LiPo battery and uFL antenna (with pen to scale size)transmitter ready for housing;&nbsp;fitted with LiPo battery and uFL antenna (with pen to scale size)

transmitter ready for housing; fitted with LiPo battery and uFL antenna (with pen to scale size)

 Marissa Kwon  URSA Program Undergraduate Student Researcher

Drone build completed

Author: Jonah Siekmann

It’s been a while since we updated this blog on the drone build progress, but today the last part came in and the drone is officially flying! We still have to mount the RFID/GPS stack, so it’s not autonomous, but it’s flying very smoothly.

For the drone, we used:

CC3D Flight Controller

750kv 28-30 motors

30A SimonK ESCs

11″ propellors

5000mAh 4s 25c battery

Flysky T6 transmitter/receiver

S500 frame

Here is a short video showing part of its maiden flight:

Also, you may recall in the last drone update, we documented an issue where the Arduino Uno microcontroller would shut off mid-flight – this was because of a faulty UBEC that wasn’t supplying a steady 5v, forcing the Arduino’s internal regulator to work overtime and thus overheating. Replacing the UBEC solved the issue. 

Now, we just have to program the autonomous navigation portion of the drone and mount the Arduino/RFID/GPS stack. 

Moving on to Smaller and Better Things

Converting from the Arduino Uno to the Adafruit Pro Trinket

As this project continues to develope, it is time to begin looking to add a more practical means of implementing these systems into the environment in a small and user-friendly package. The problem? The Arduino Uno is an excellent prototyping microcontroller, its easy to work with, has several built in functions with many pins ready to be used, however, this ease of use and functionality comes at the cost of a bulky, power hungry microcontroller that likely can do much more then you need it to. The solution? The Adafruit (3 Volt) Pro Trinket.


The Adafruit Pro trinket is a tiny microcontroller that packs a punch! 


The New Adafruit Pro Trinket (3V) Micro controller being used for this projectThe New Adafruit Pro Trinket (3V) Micro controller being used for this project

The New Adafruit Pro Trinket (3V) Micro controller being used for this project

Remapping Pin-outs

One of the biggest challenges with swapping the Pro Trinket for the Uno  is the difference in board configurations and pin allocations. The blog post “Getting Started with the nRF08001 Bluetooth LE chip” lays out how the pins and wiring of the nRF08001 is set up for the Arduino uno. In this post we will be exploring how to do it for the Pro Trinket. Below is a diagram of the Pro Trinkets Pin outs as well as breakdown of the pin allocation.


Pin Schematic of the Adafruit Pro TrinketPin Schematic of the Adafruit Pro Trinket

Pin Schematic of the Adafruit Pro Trinket

  • RX – also known as Digital #0, this is the hardware serial input pin. This is used when programming with an FTDI cable but is available when using the native USB to program
  • TX – also known as Digital #1, this is the hardware serial output pin. This is used when programming with an FTDI cable but is available when using the native USB to program
  • Digital 3 – Also known as external interrupt #1. This pin can also be used as a PWM output pin using analogWrite() (This is the most significant difference between the Uno and the Pro-Trinket and requires manual changes to sketches in order to work)
  • Digital 4 – Nothing particularly special about this GPIO pin
  • Digital 5 – this pin can also be used as a PWM output pin using analogWrite()
  • Digital 6 – this pin can also be used as a PWM output pin using analogWrite()
  • Digital 8 – Nothing particularly special about this GPIO pin
  • Digital 9 – this pin can also be used as a PWM output pin using analogWrite() It’s also good for driving servos because its a high-speed PWM output
  • Digital 10 – this pin can also be used as a PWM output pin using analogWrite() It’s also good for driving servos because its a high-speed PWM output
  • Digital 11 – Also known as the SPI MOSI pin. this pin can also be used as a PWM output pin using analogWrite()
  • Digital 12 – Also known as the SPI MISO pin
  • Digital 13 – Also known as the SPI CLOCK pin. This is also connected to the red #13 LED!
  • Analog 0 – also known as Digital 14, this pin can be a digital I/O pin or an analog input pin
  • Analog 1 – also known as Digital 15, this pin can be a digital I/O pin or an analog input pin
  • Analog 2 – also known as Digital 16, this pin can be a digital I/O pin or an analog input pin
  • Analog 3 – also known as Digital 17, this pin can be a digital I/O pin or an analog input pin
  • Analog 4 – also known as Digital 18, this pin can be a digital I/O pin or an analog input pin. It’s also the I2C SDA pin
  • Analog 5 – also known as Digital 19, this pin can be a digital I/O pin or an analog input pin. It’s also the I2C SCL pin

Conclusions about the switch

The only changes you may have to consider when adapting Arduino sketches are:

  • Pins #2 and #7 are not available *
  • The onboard 3.3V or 5V regulator can provide 150mA output, not 800mA out, this is due to power saving functionality designed into the Pro Trinket, which is ideal for this project
  • You cannot plug shields directly into the Pro Trinket
  • There is no Serial-to-USB chip onboard. This is to keep the Pro Trinket small and inexpensive, you can use any FTDI cable to connect to the FTDI port for a Serial connection
  • The 3V Pro Trinket runs at 12MHz not 16MHz so its a bit slower, but with the advantage of significantly less power draw, extending battery life significantly
  • The bootloader on the Pro Trinket use 4KB of FLASH so the maximum sketch size is 28,672 bytes, more than enough space for almost all applications. The bootloader does not affect RAM usage.
  • And most importantly that all sketches that use pin 2 as the interrupt must be switched to pin 3. 

Writing a script to bring it all together

This week I have also begin sketching the new data transmission protocol that will be used across the Internet of Ag project. After getting communication between the Pro Trinket and BLE module set up and the demo functioning it was time to start a new script from the ground up. This week I was able to begin drafting out the basic logic, and looking over example codes of the protocol and will contiune working on a sketch next week. 

– Tom DeBell, Beginning Researcher Support Program researcher

RFID Sensor Update 2

Author: Brett Stoddard

Hi everyone, this week has been an exciting one for the world of OPEnS RFID moisture sensing. Since the update, we have found ways to make the sensors even more reliable and sensitive. Two updates have allowed for this development.

The first major modification came when “tails” were added to the RFID tag. These tails are made out of a paperlike material that’s designed to suck up and hold and moisture it comes into contact with. The more moisture it touches, the more water it sucks up thanks to capillary action. Tails can be positioned on the sensor to hold the liquid in the most moisture sensitive area of the tag to maximize the accuracy of readings. Sure enough, as soon as we started gathering data with the tails attached the reliability of our measurements improved by a lot. An image from one of Smart Trac’s technical documents showcases the tail below. All future testing will be done using these tags.


Image of a tail attached to an RFID tag


The second change was implemented on the software side of things. Before this week the sensor value was only read once and then outputted. The new code took 100 readings and then outputted the mean value. By using this method, more reliable and accurate readings were made. These new readings improved consistency across all of the tags for sensing extremely wet, extremely dry, and moist tail conditions. In the future, we will examine the exact distribution of the readings to determine the minimum number of readings that are needed to get a value with 80-90% certainty. The example code can be seen in this folder of the RFID library. This code is not yet optimized.

What’s Up with the LoRa Devices

Abstract:

This post describes all progress up to this point and the integration of LoRa communication into the currently in progress Evaporometer project.

Our Progress:

In the past few weeks, I’ve been working with another student named Manuel to apply the LoRa devices to a rain catchment device designed to measure evaporation.  Below is a picture of the strain gauge rain catchment system he built for the project.  The LoRa device can be placed on the platform where a load cell can be hooked up to our LoRa system to measure and transmit data to our LoRa receiver and to an offsite server.  


Since the LoRa device will need to transfer data as precisely as our load cell can measure, the code will need to be adjusted to accommodate integer and float values with adjustable decimal precision.  I have made the proper updates to the code and will post more details on that in the future.

What’s Next:

We are moving quickly towards field testing these LoRa devices with the Evaporometer but there are a few changes that still need to be made.  The LoRa transmitters, which will be out in the field, will need a weatherproof housing and a portable power source.  Also our current transmission frequency is not suitable for a lot of ongoing communication, so our LoRa breakouts will also need to be replaced new ones that can transmit at a higher 915 mHz frequency.   

Marissa Kwon Undergraduate Student Researcher

RFID Sensor Update

Author: Brett Stoddard

Hello all, it’s been a while since the last sensor status but from now on I’ll be working to increase my posting frequency.

Since the last update, many things have been happening on the sensor end. First, the OPEnS lab bought a new RFID module to interface with the Arduino UNO and have semi-officially scrapped the LinkSprite LSID-0702 reader. From here on out, we will be using the SparkFun Simultaneous RFID Reader – M6E Nano shield. I was really excited to get working with this reader because it’s documentation is a lot more readable and through than the other modules I’ve worked with.

That documentation included a SparkFun proprietary library especially made for use with the Arduino UNO. I forked this library on GitHub and have been adding to it a few functions specifically geared towards reading the moisture information from Smart Trac RFID tags. For the most part, these functions seem to work! The original SparkFun library is available by clicking here. The OPEnS lab version of it that I have and will be adding to can be found by clicking here.

The rest of this blog post will be dedicated to the results of tests run to prove that the retrieved values are dependent on the actual moisture of the chips. “Wet” tags were held under a stream of moving water in the sink for five to ten seconds. “Dry” tags are either tags that were never wet or ones that were set out to dry for a few days. 

FIGURE 1. Raw, unprepared data from the serial port of the Arduino UNO when example code from the library is run.

This data was gathered by modifying a read EPC byte command to read a different registry. What that means is that the data is unparced and looks gross. The important thing from this data is that the sensor code was reading a different number when it was wetted. When dry the tag had a value of either 12 or 14 HEX (18 or 20 decimal). Then when that same tag was run under the sink it read a value of 0C or 0C HEX (12 or 13 decimal). Being able to tell the difference between really wet and completely dry is a large step forward for this project and this data, if consistent, will allow us to do just that. However, as always, more testing will be needed to make this process robust enough for use in the field.