OPEnSampler October 17 Update

Abstract:

Much has happened with the samplers in the past two weeks! There are two categories of updates: those relevant to the Zurich Sampler and those relevant to the new versions of samplers. In short, the frames have been assembled for the new samplers and the PCBs are being soldered up; the new pumps arrived; the final pieces of the Zurich Sampler are coming together and it will be ready to ship very soon.

Updates:

New Sampler Updates:

Frame:

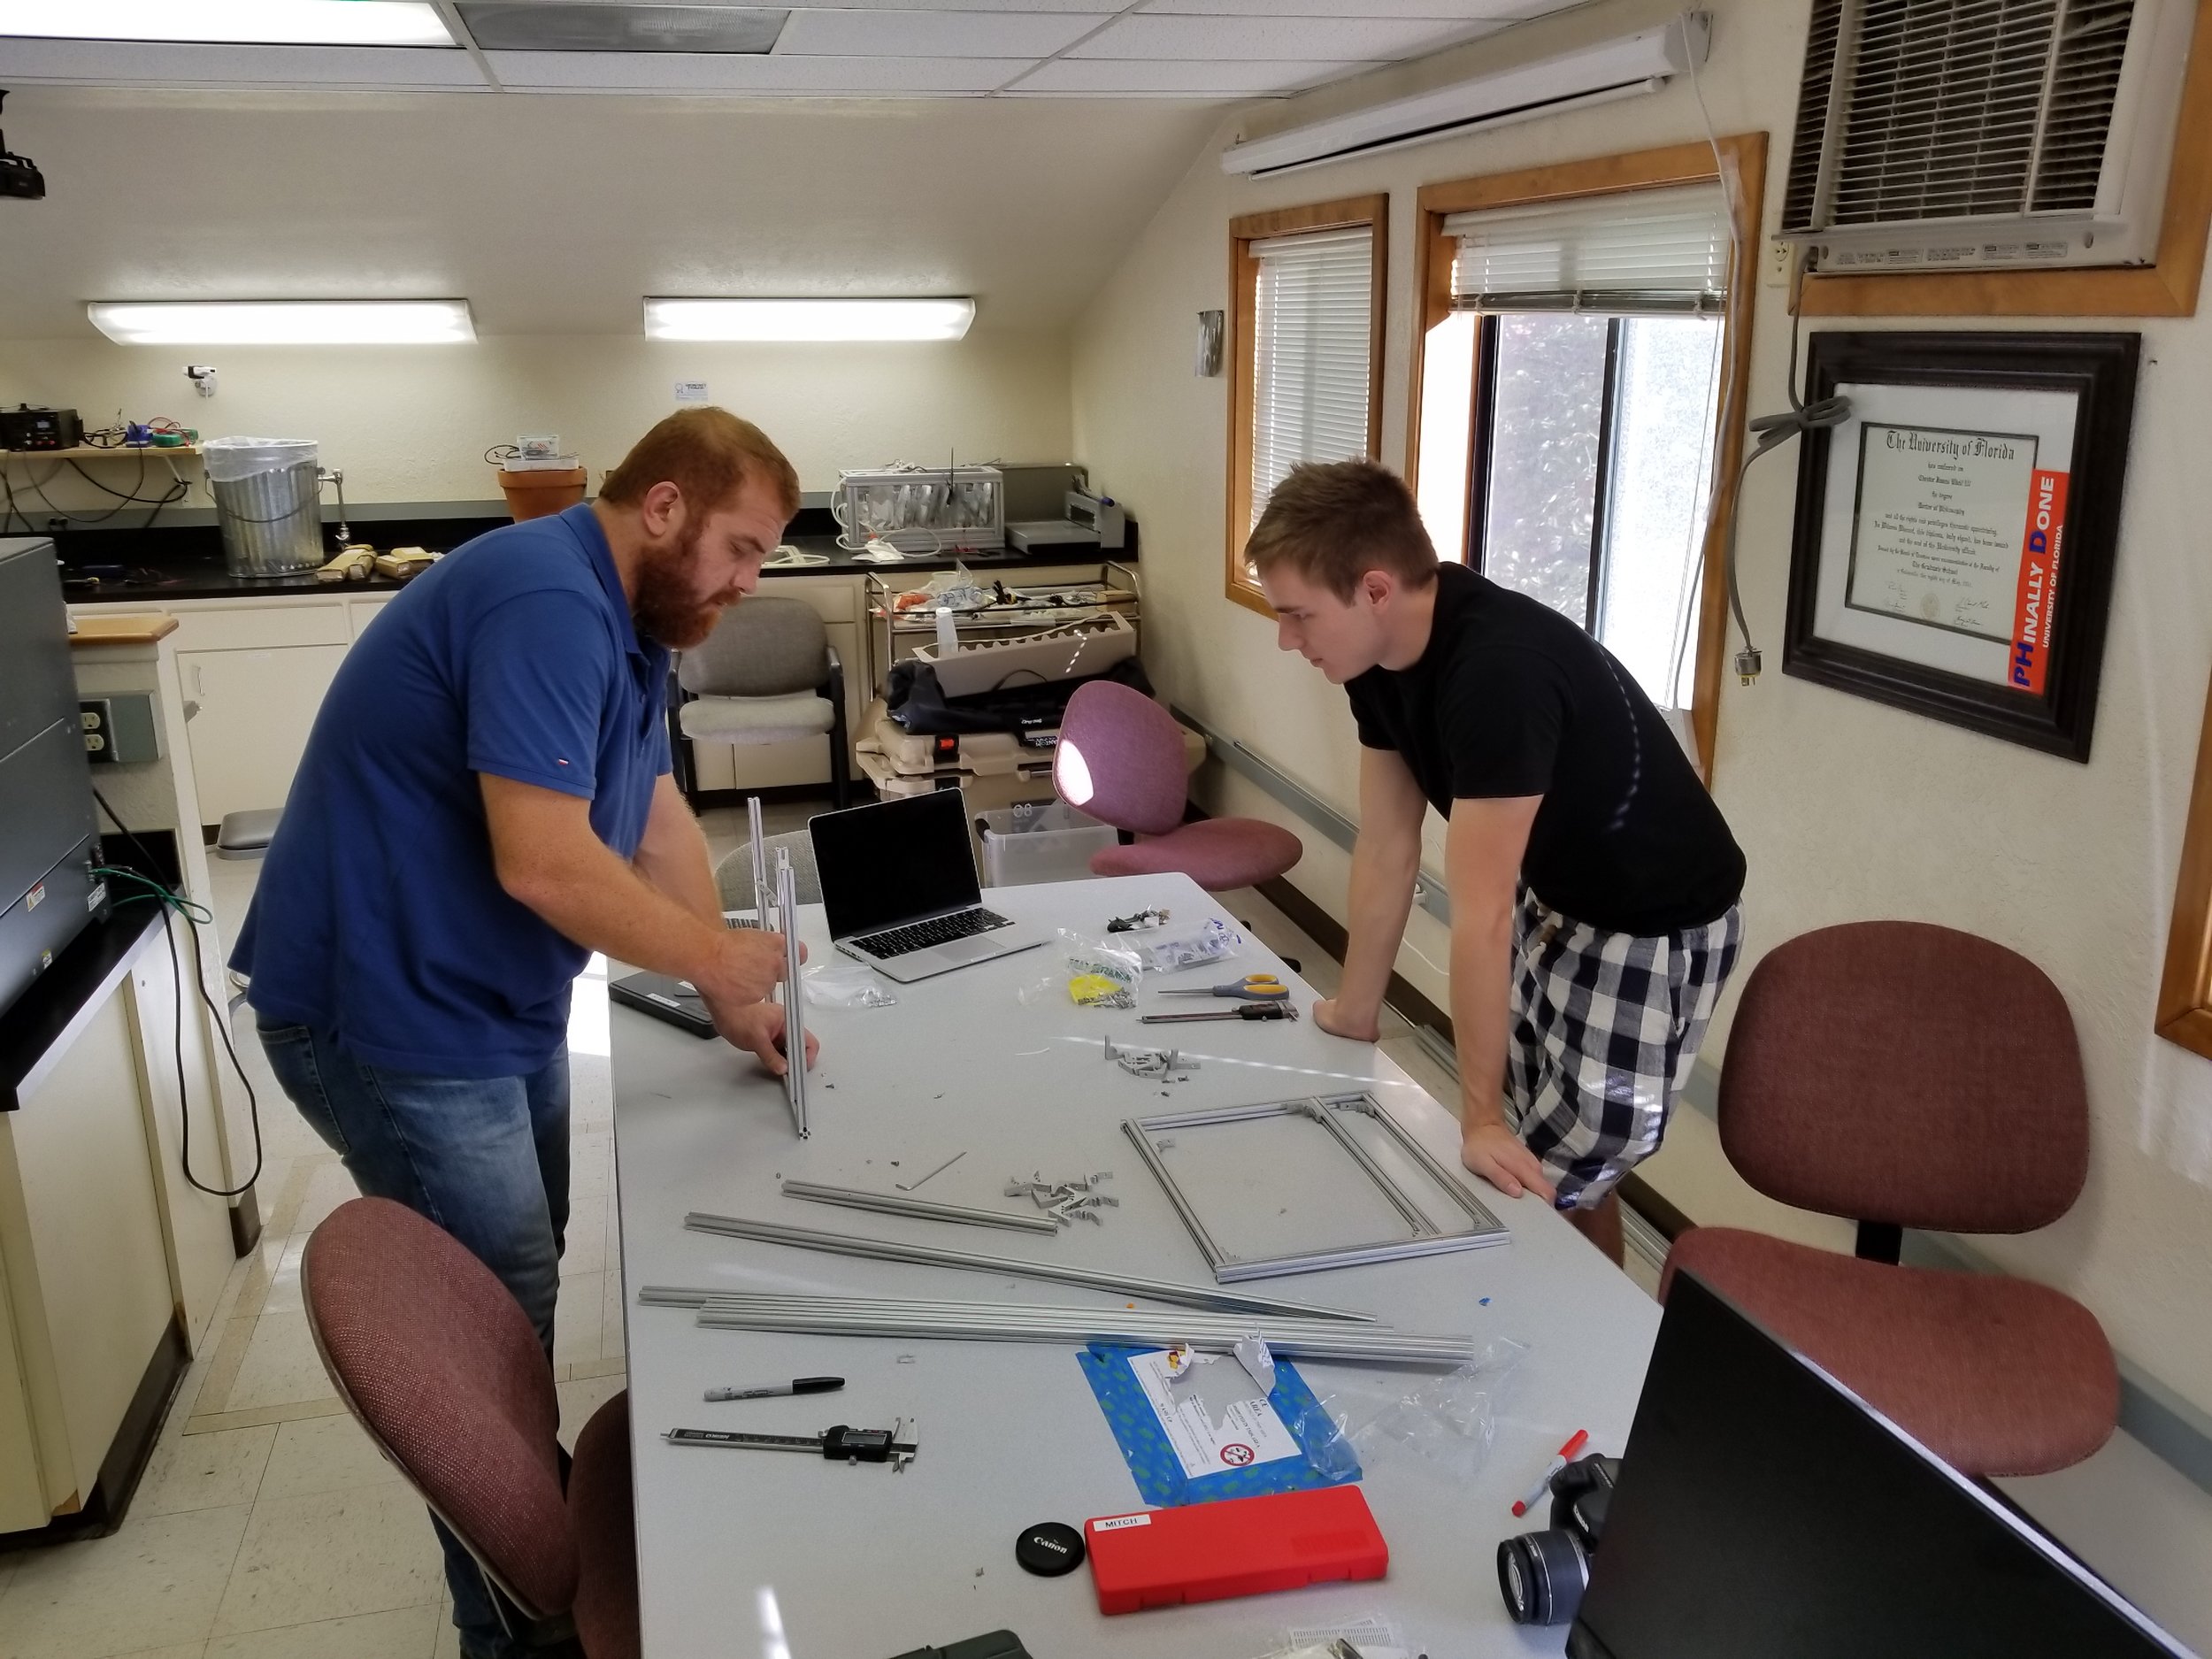
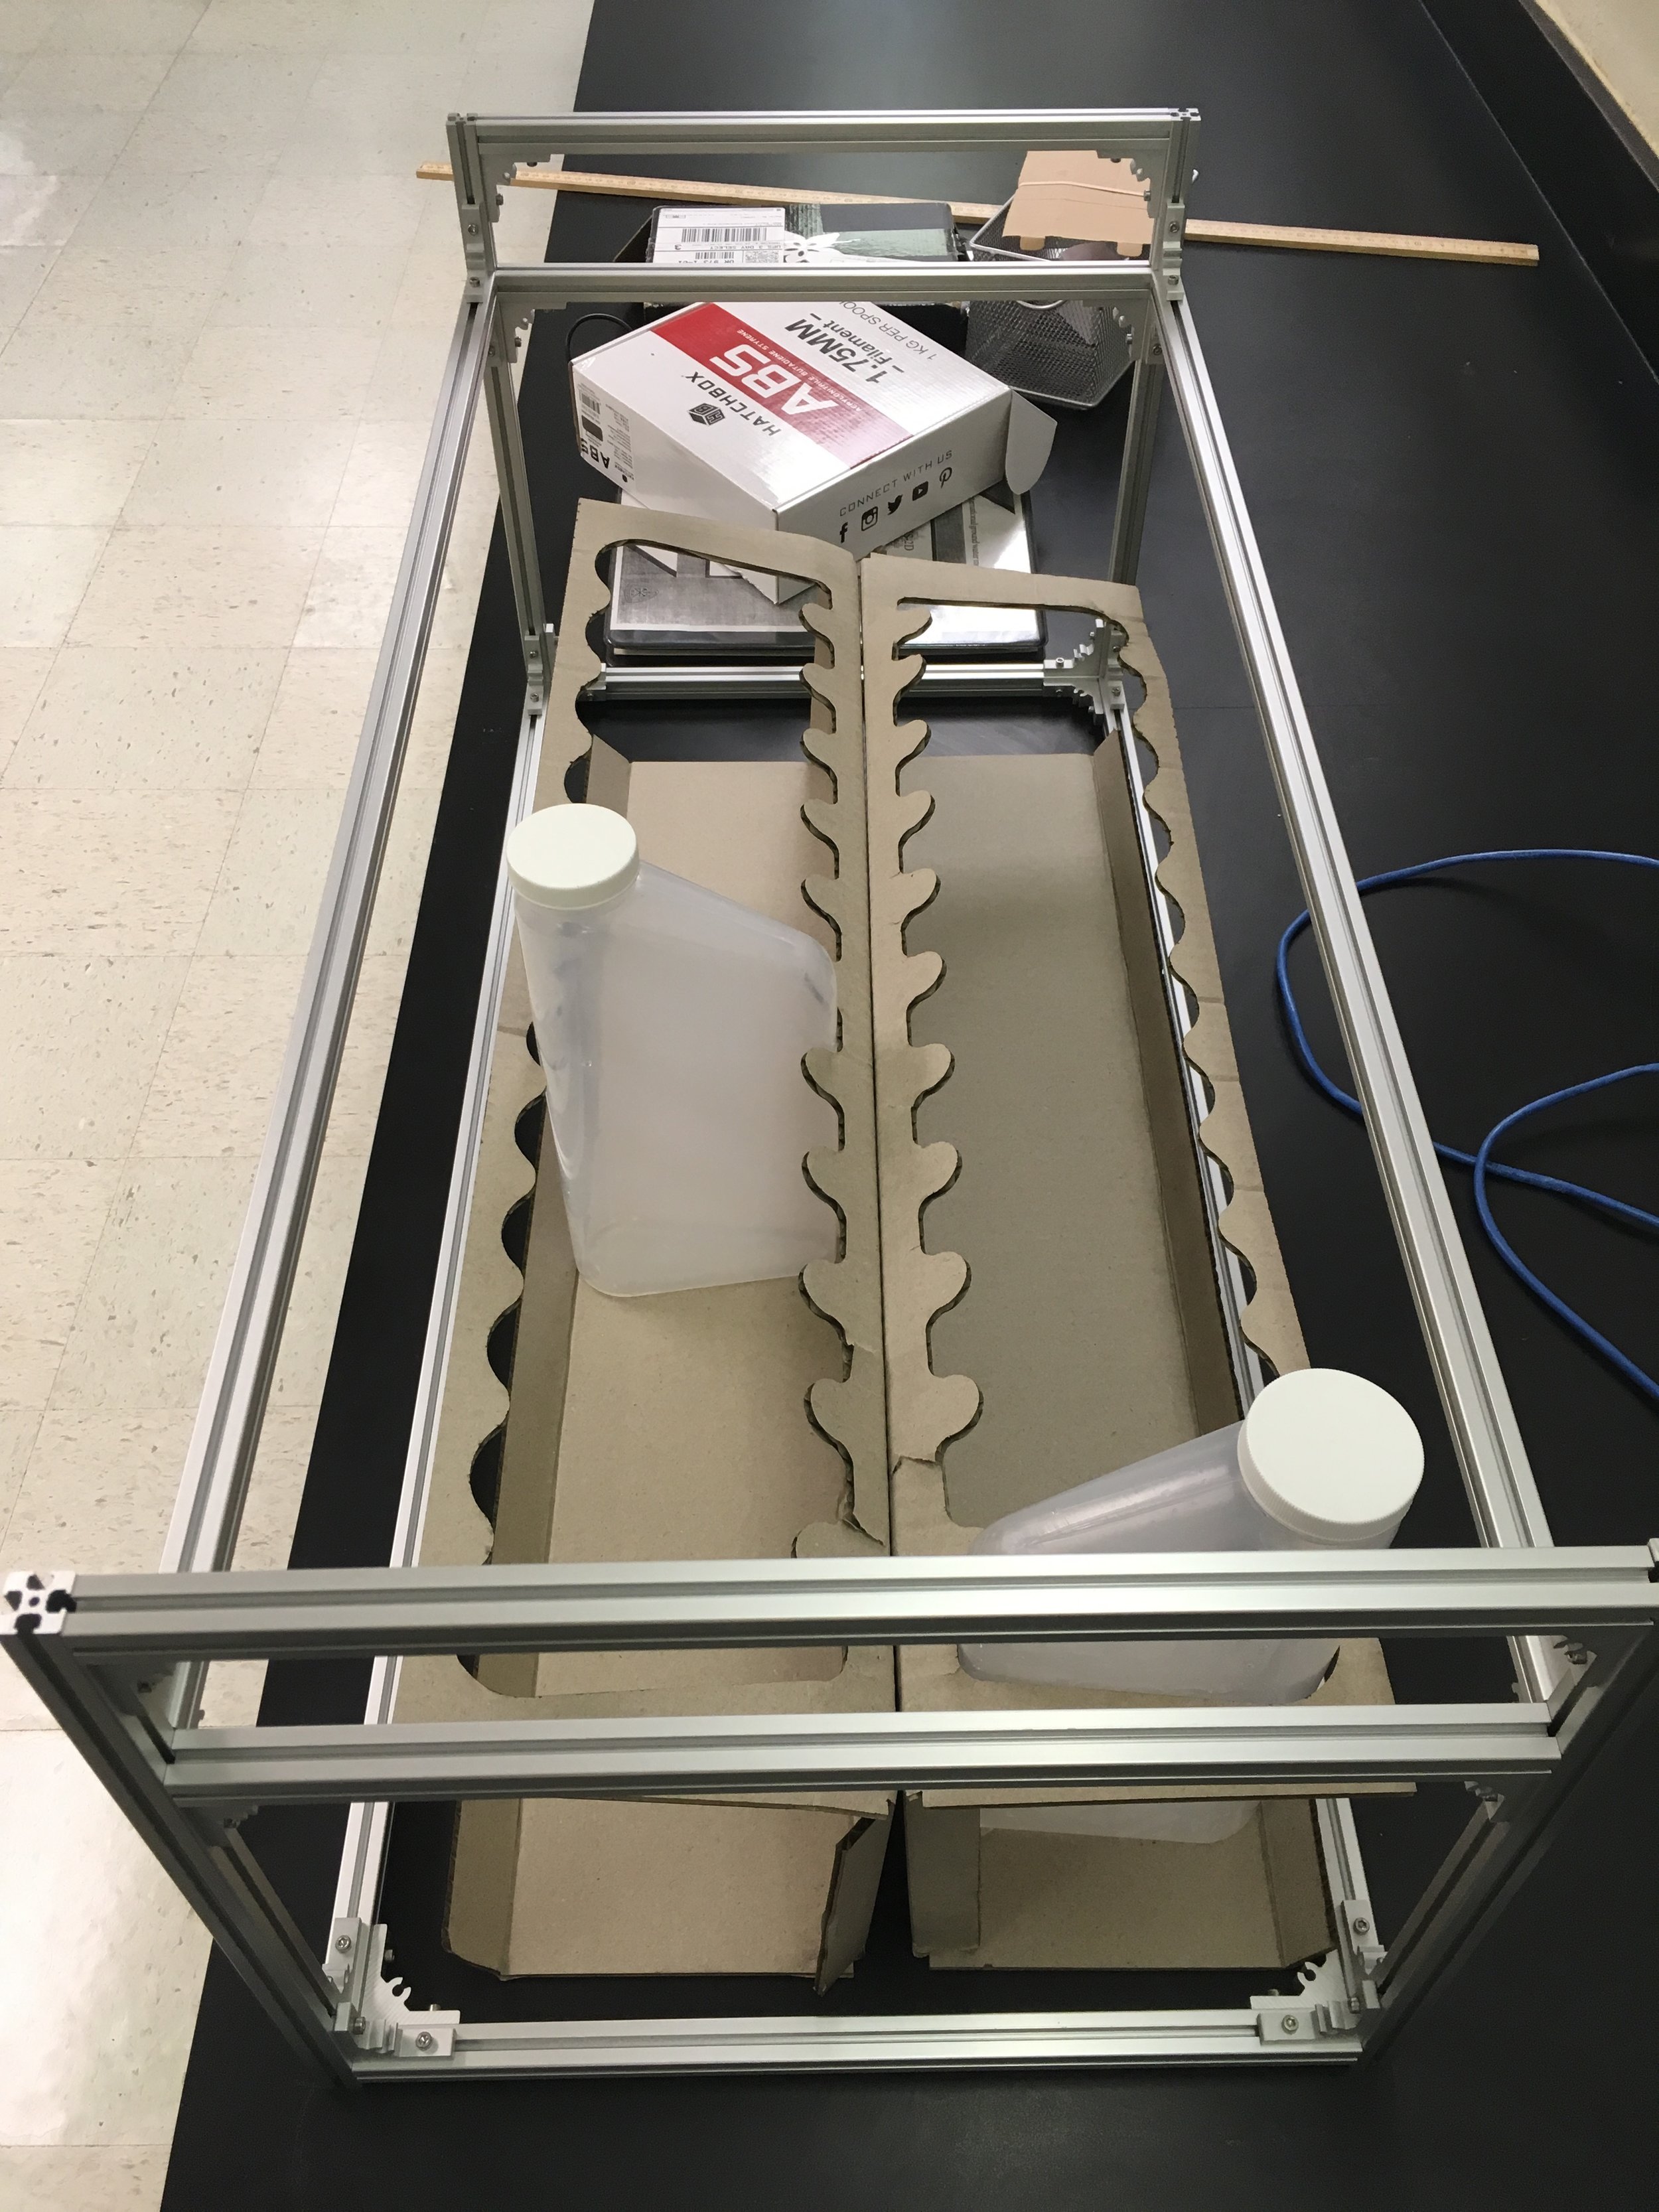
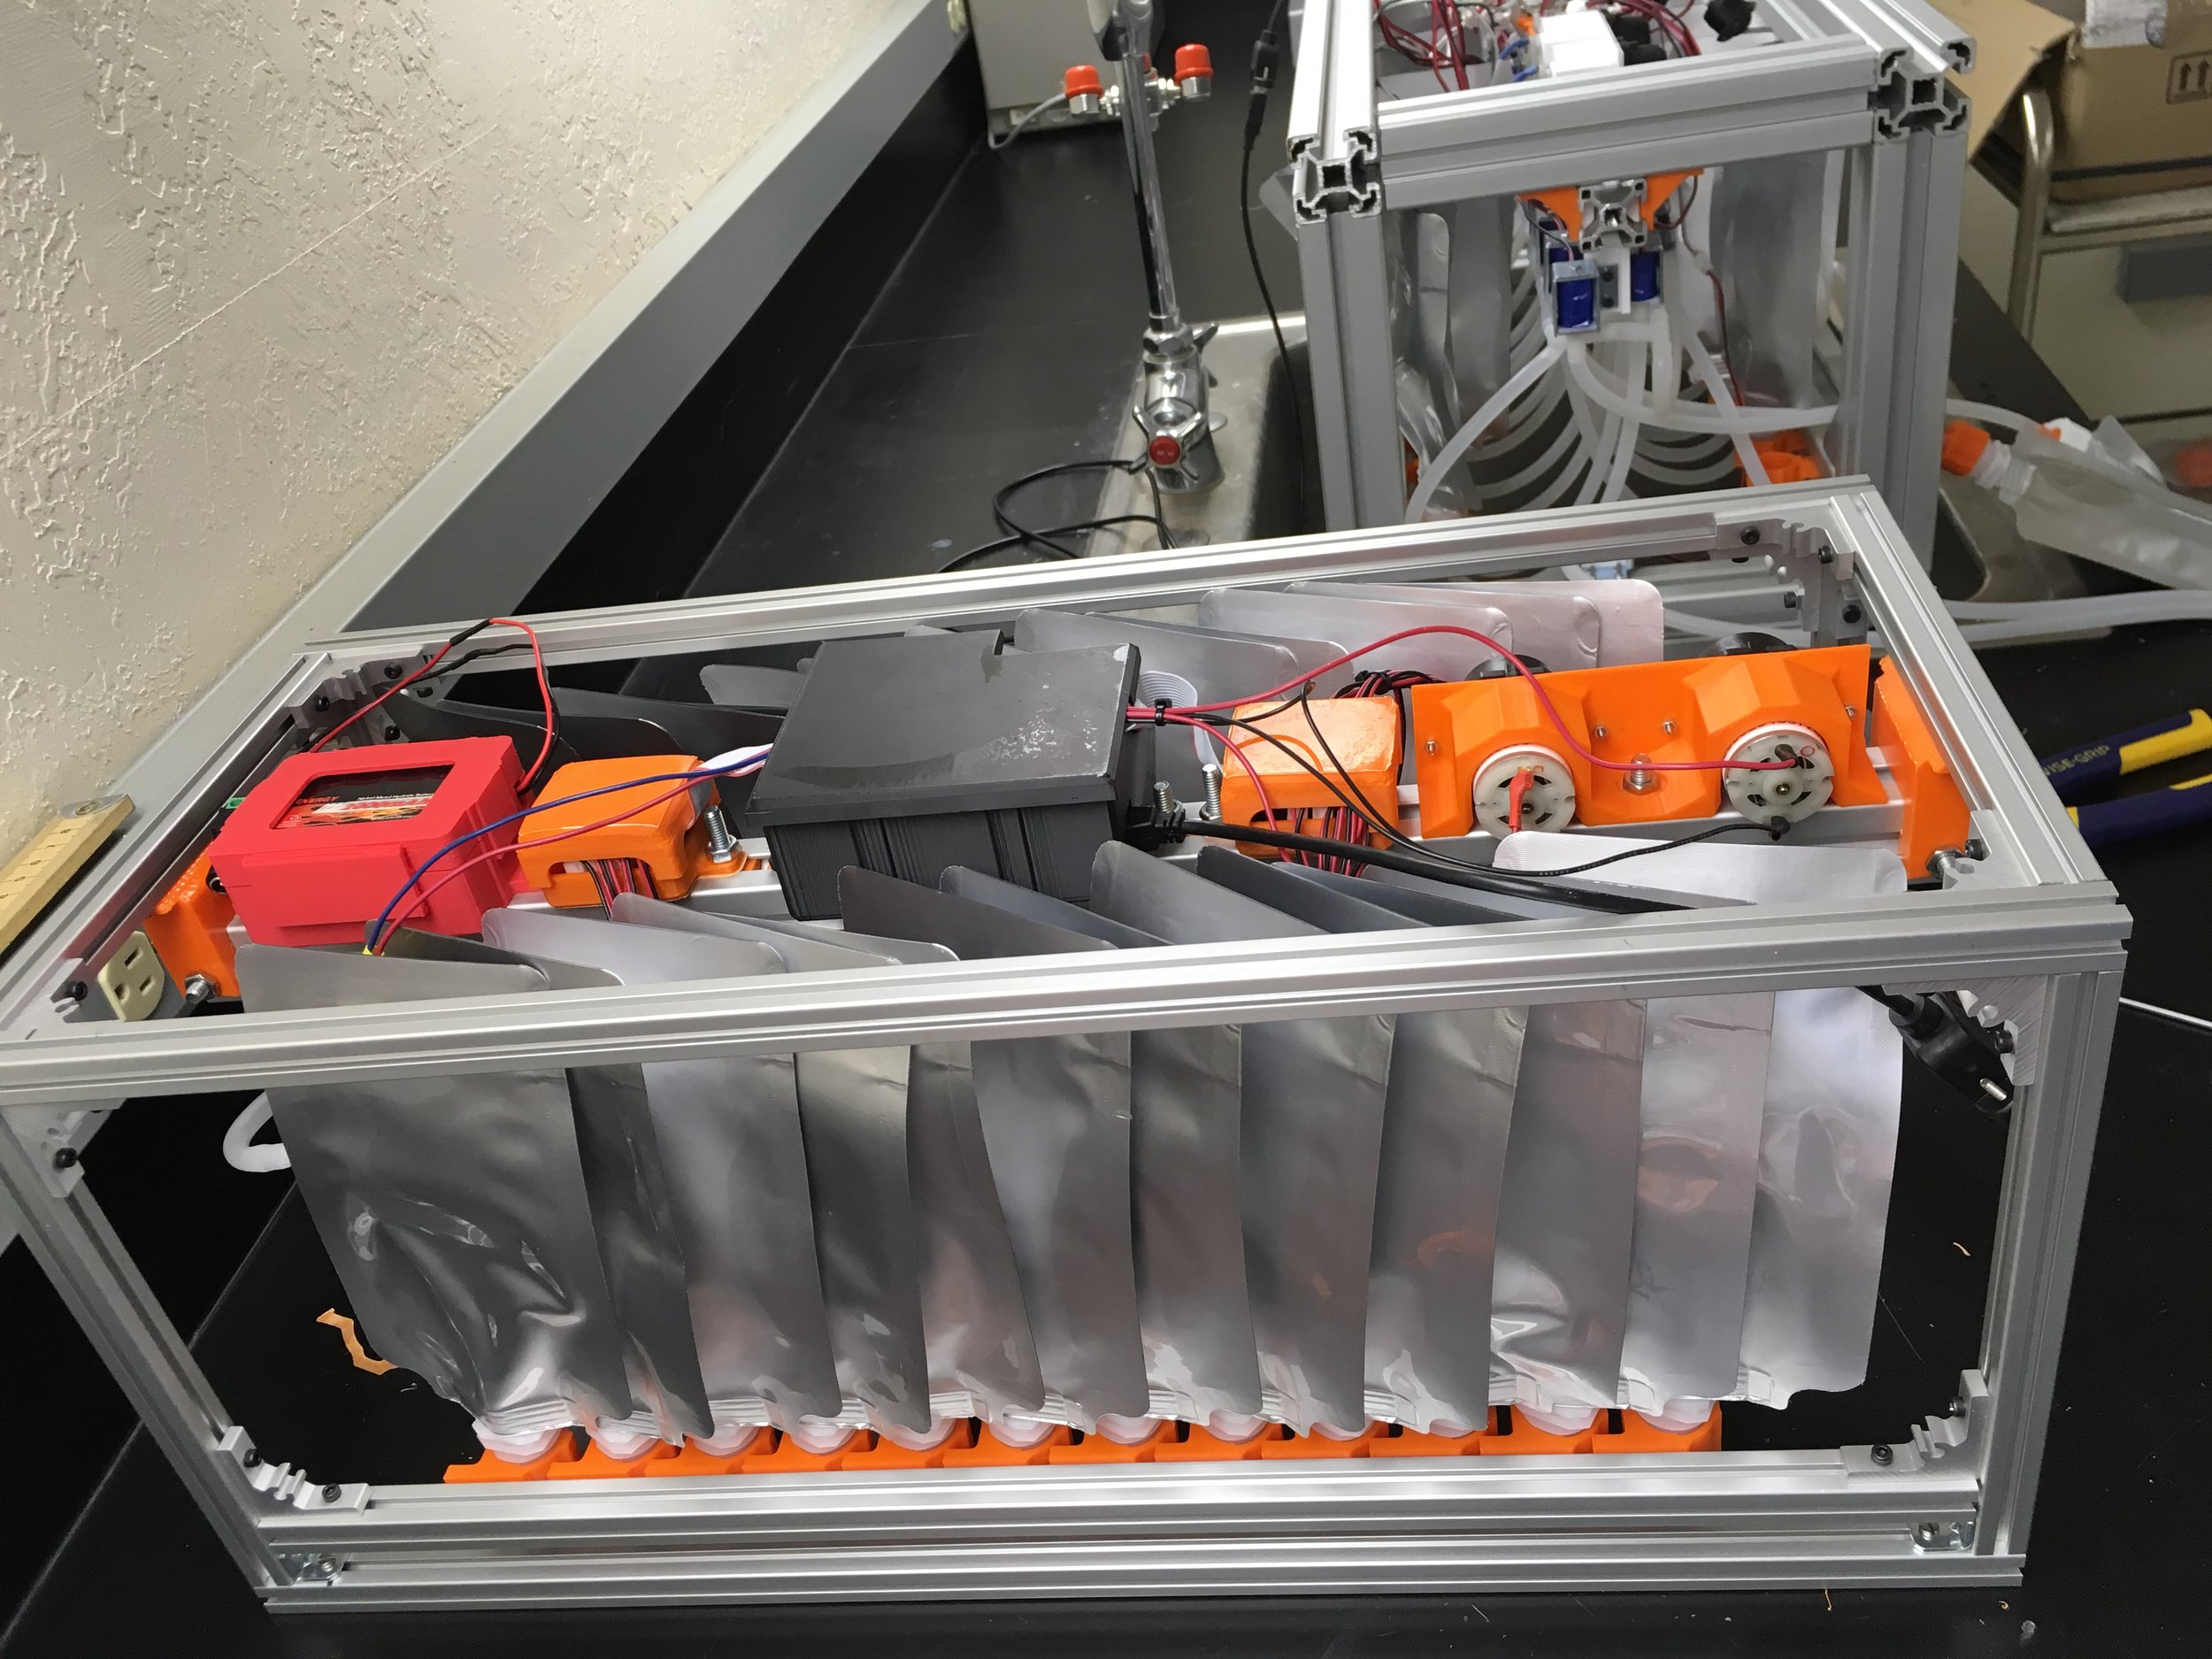
The sample-bag OPEnSampler frame was assembled by Adnan and I the other week and it fits snug in the Pelican 80QT rolling cooler. It fills up quite a bit of the space as intended, and there is extra room on the sides (the thickness of the wheel wells) for ice packs. Before more are assembled I think I will reduce the width of the sampler by about 5mm to account for the wells being slightly convex.

PCBs:

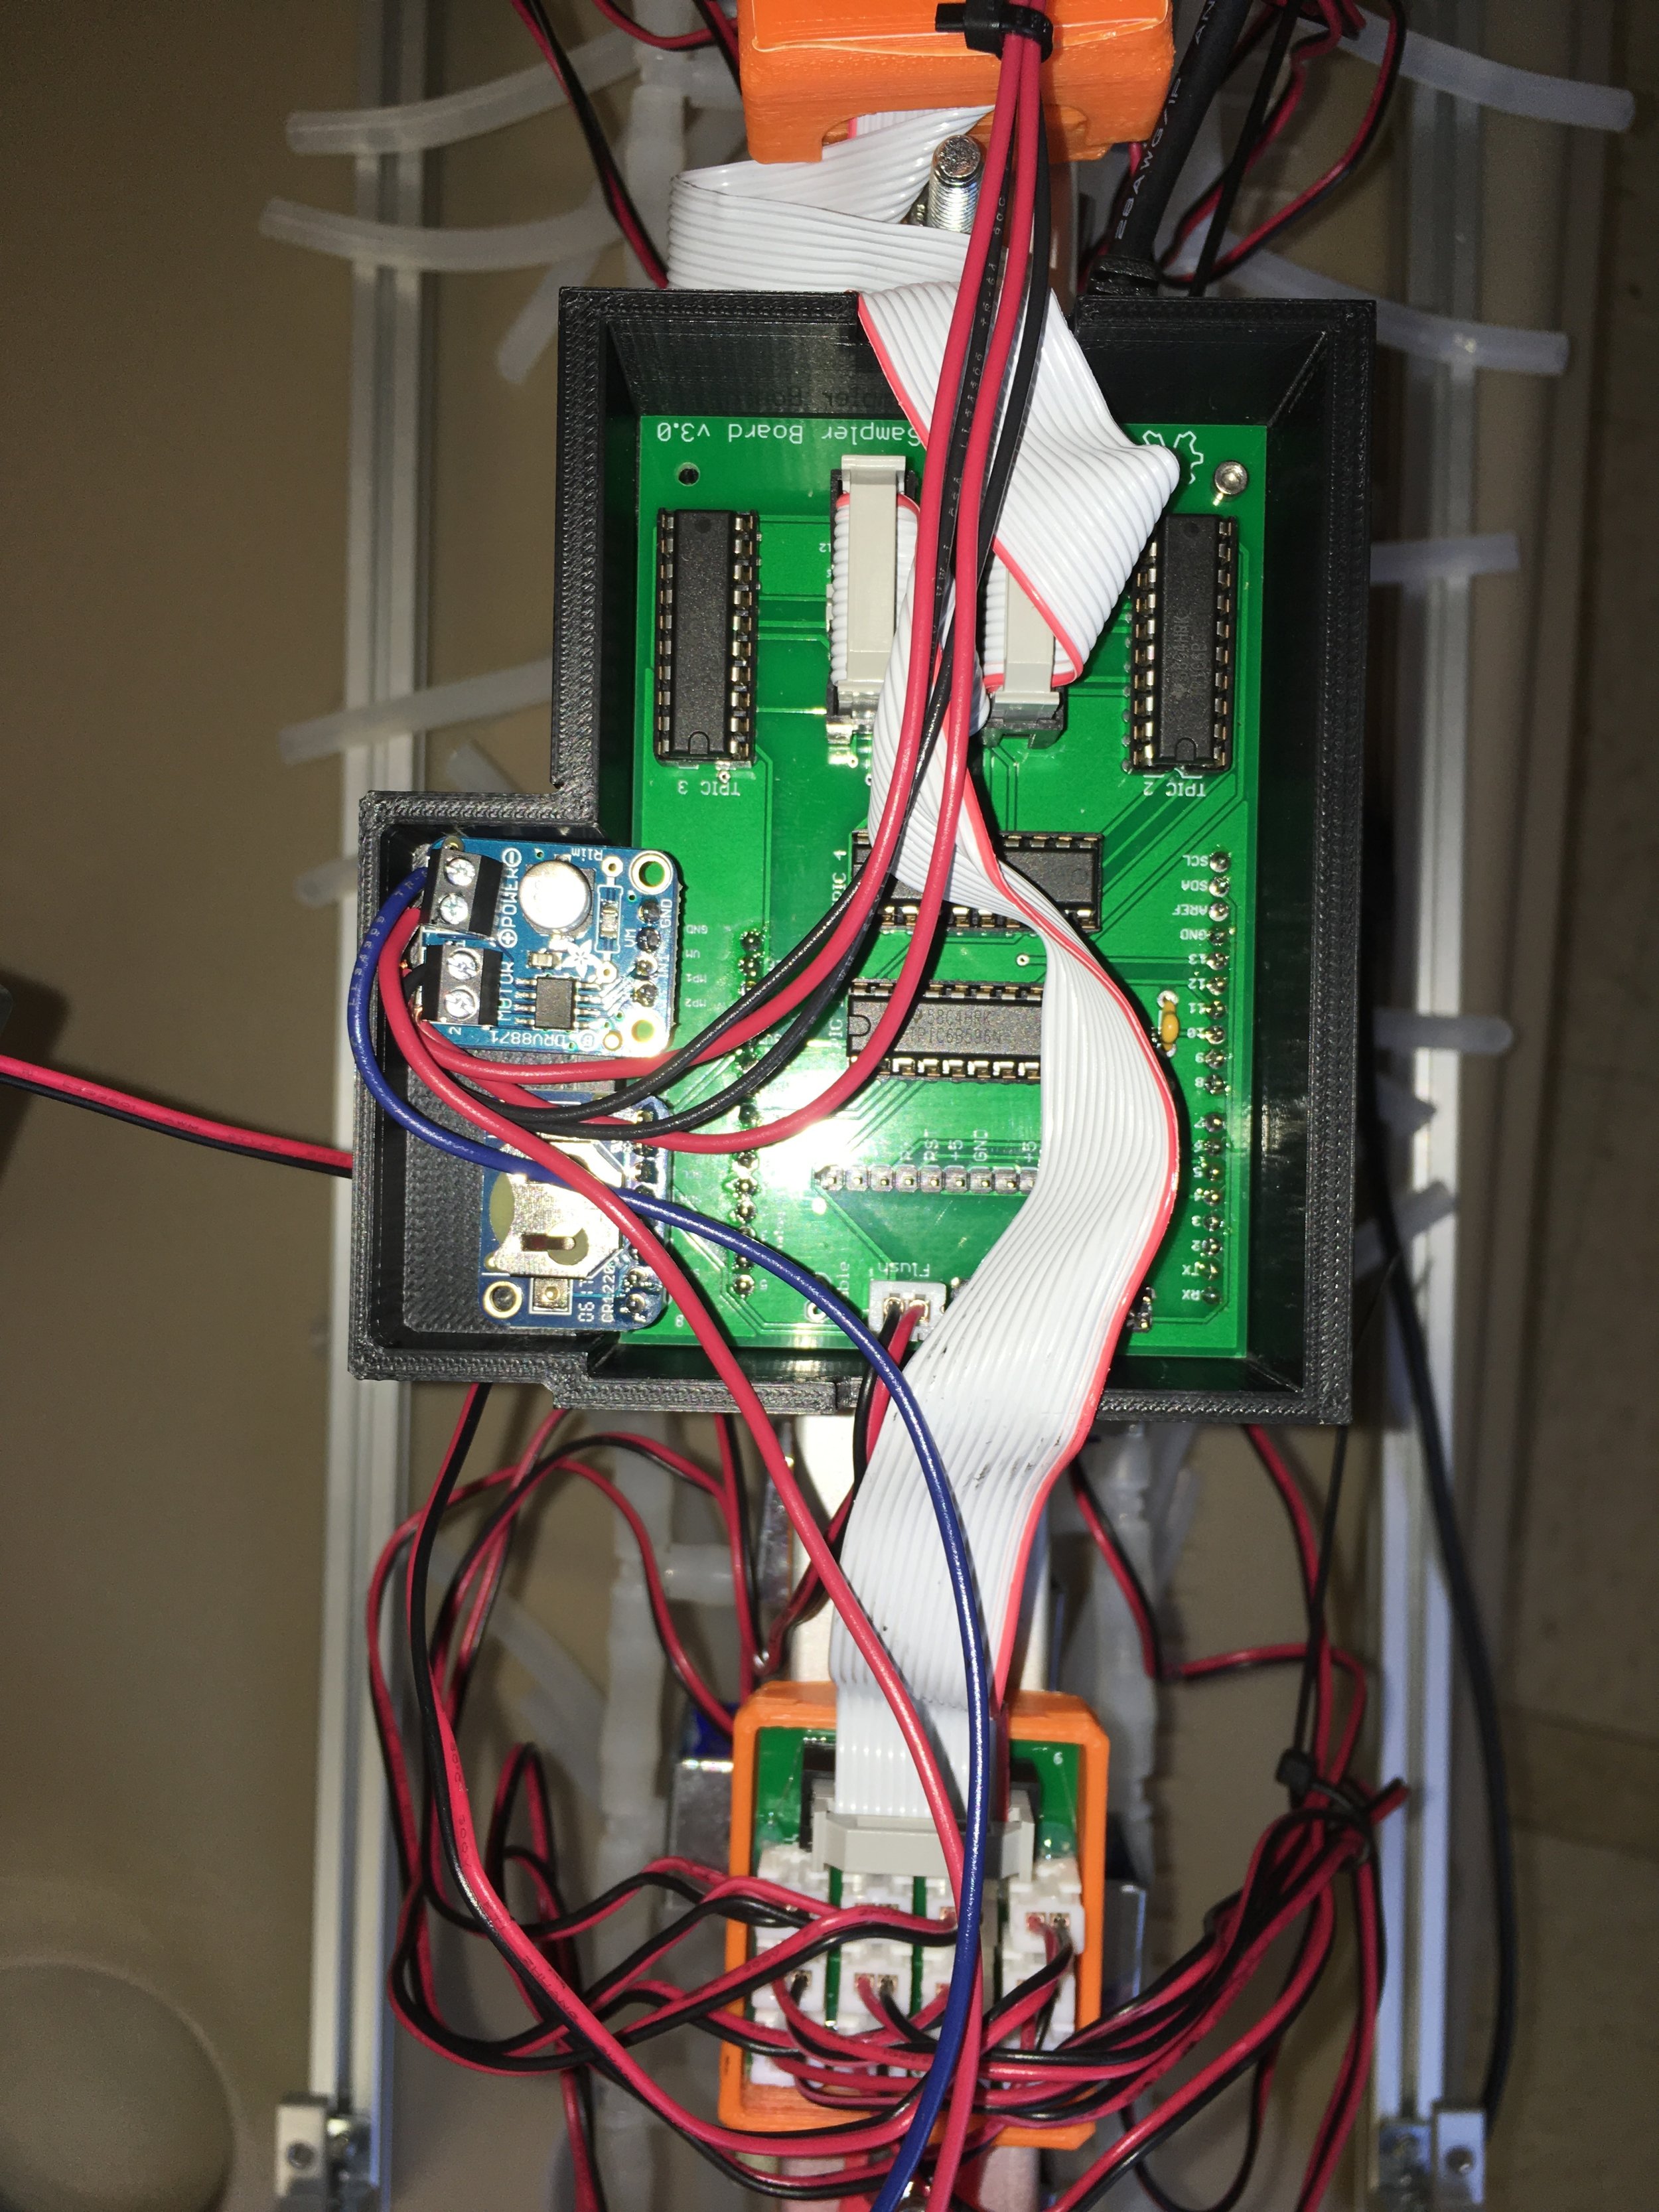
The Main Control Boards arrived the other week along with all the components of the two samplers. They look great! Azad and Adnan are soldering the components to them and will likely finish in a couple weeks.
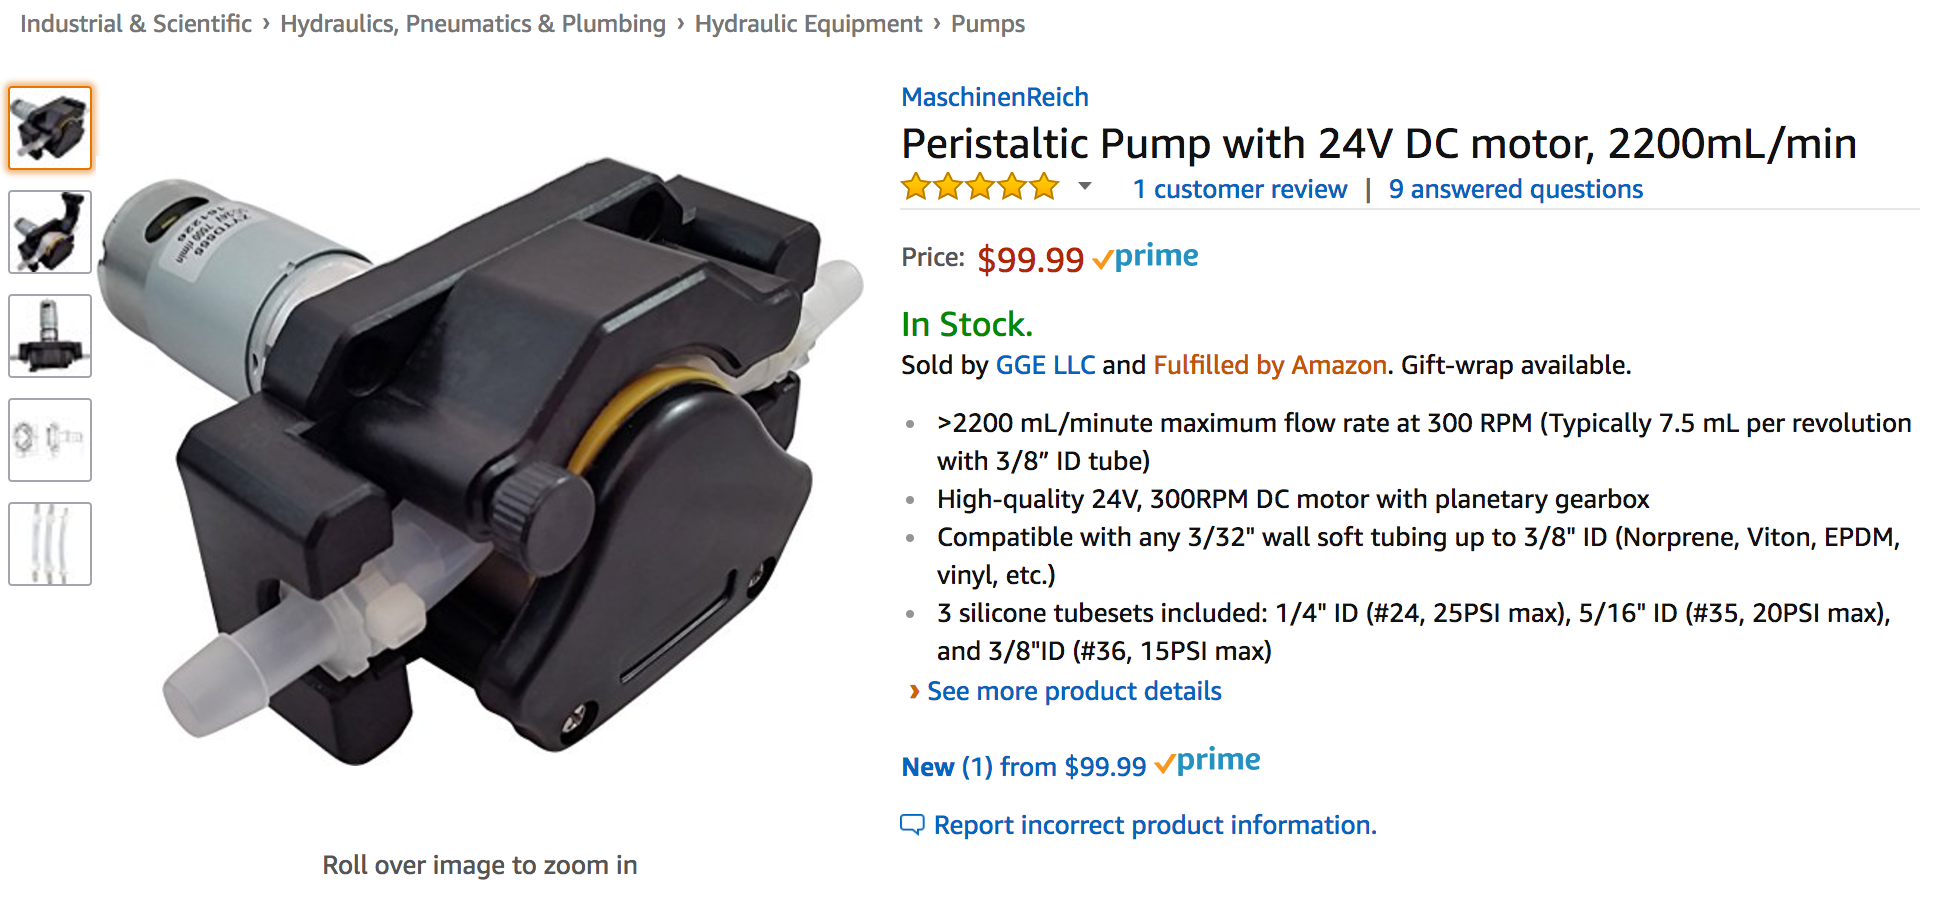
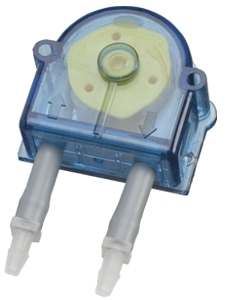
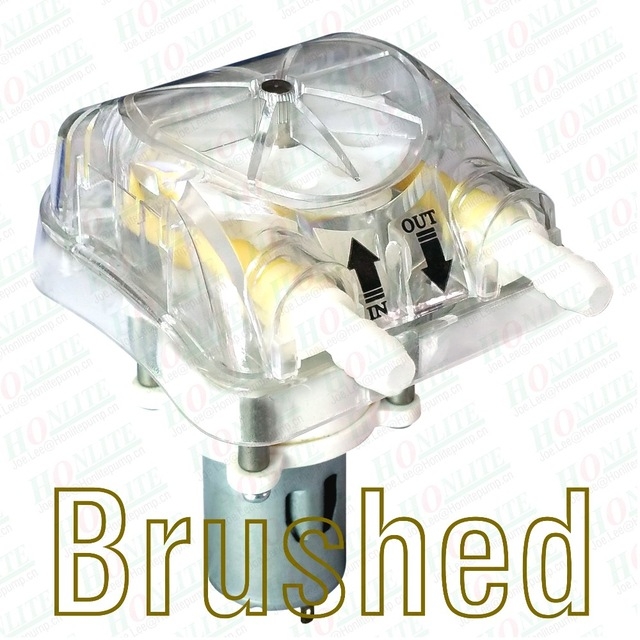
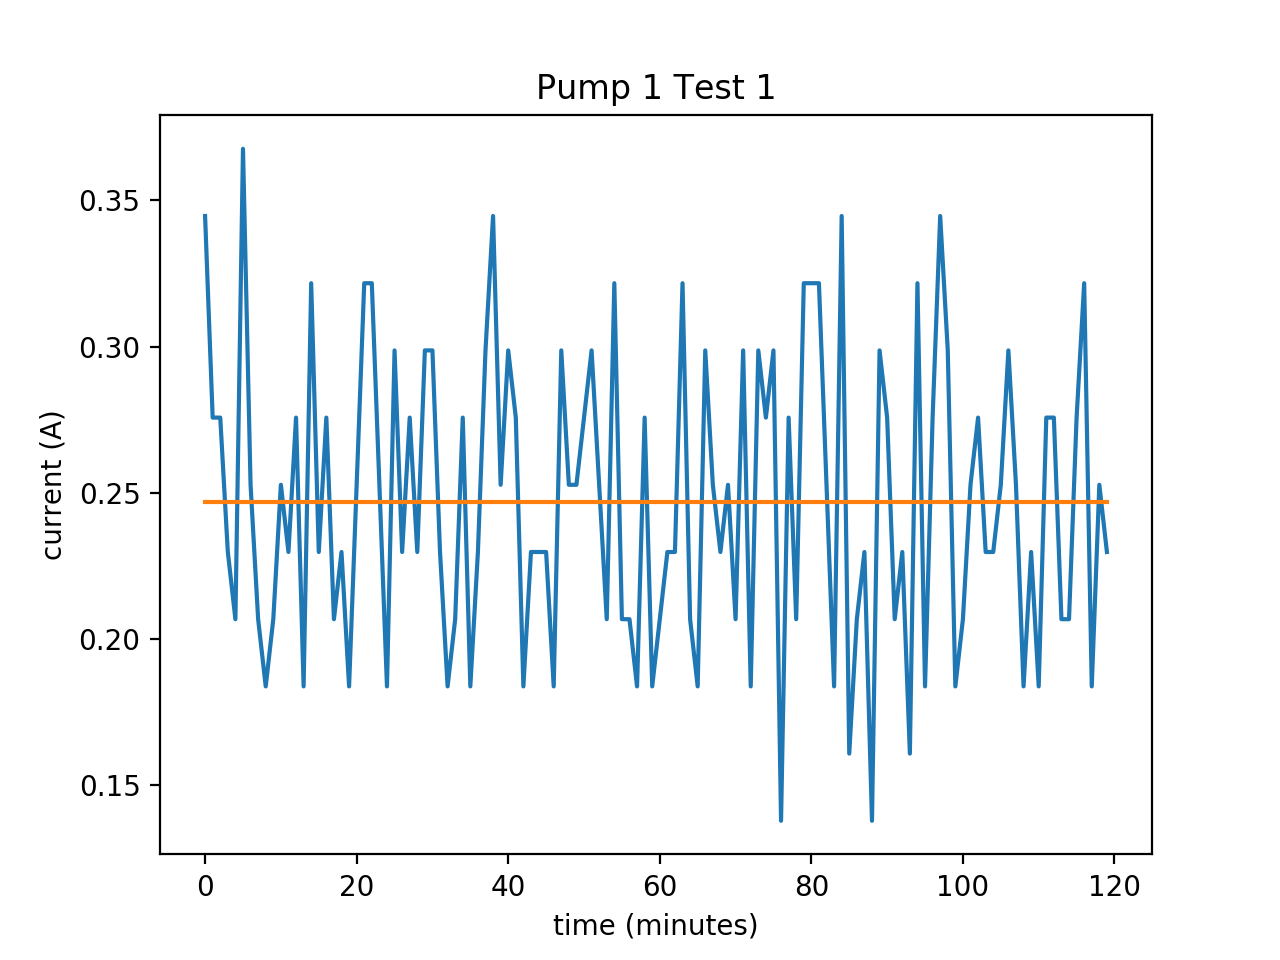
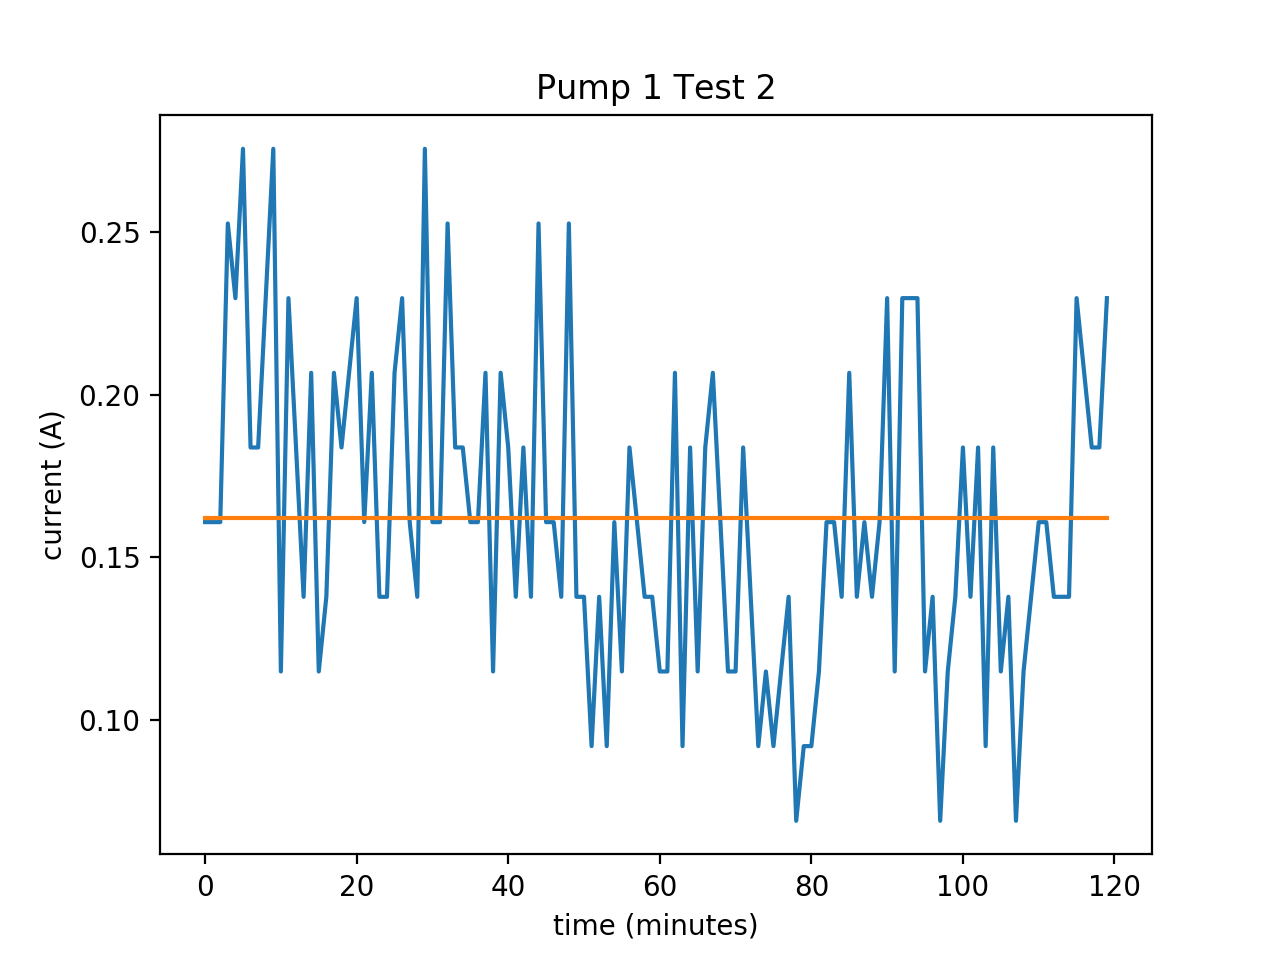
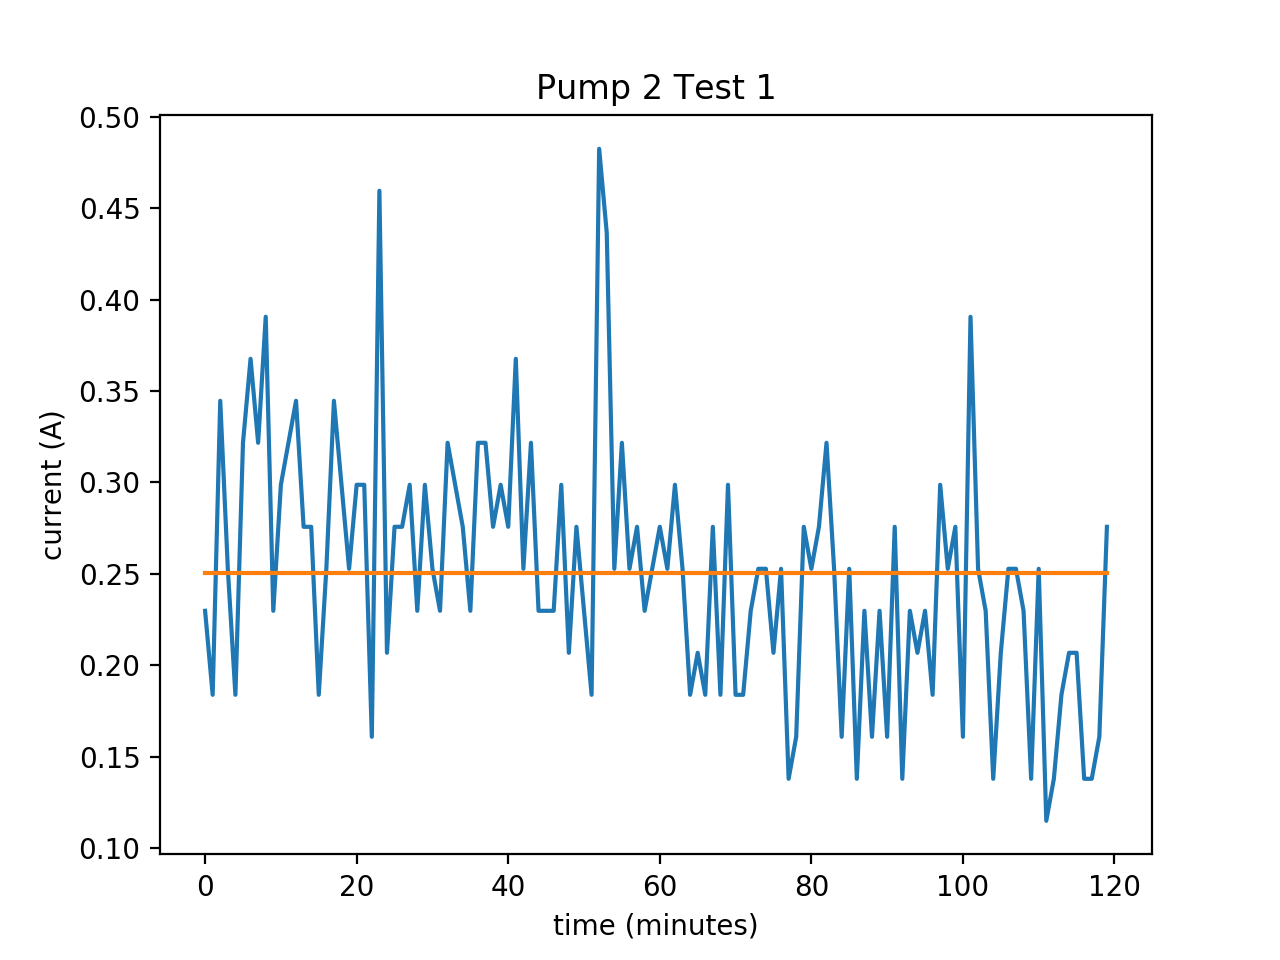
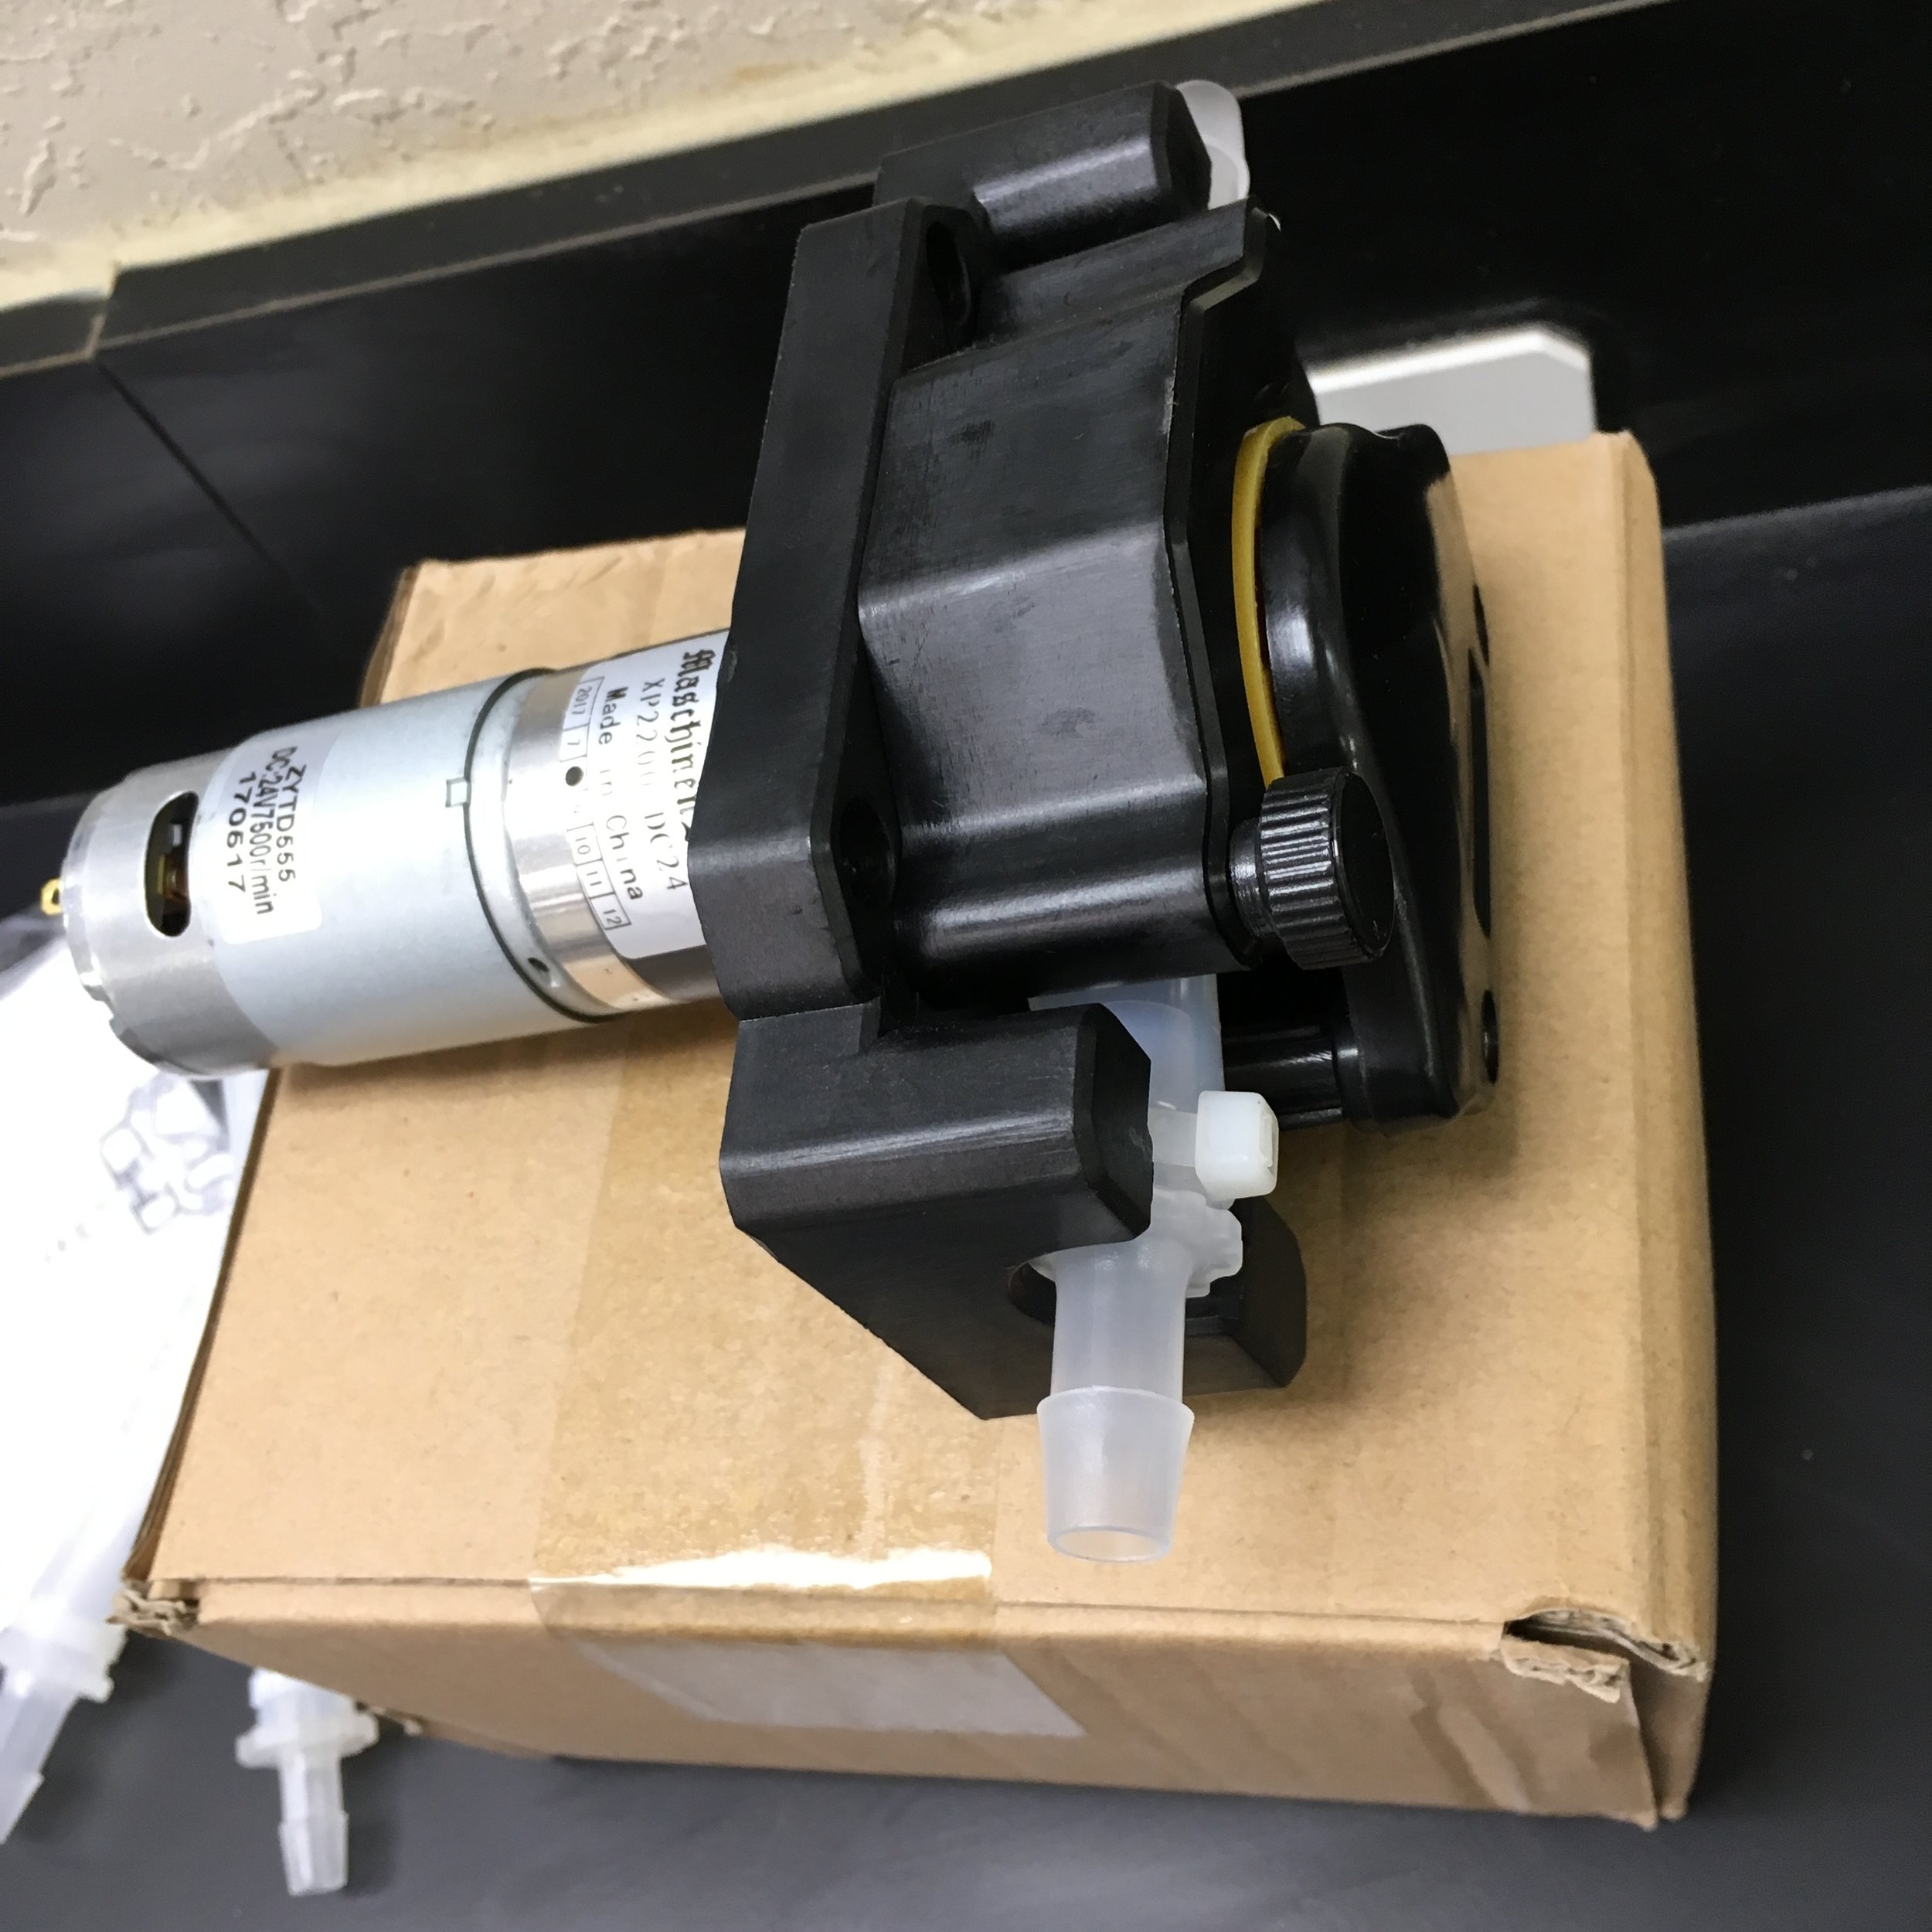
New Pumps:

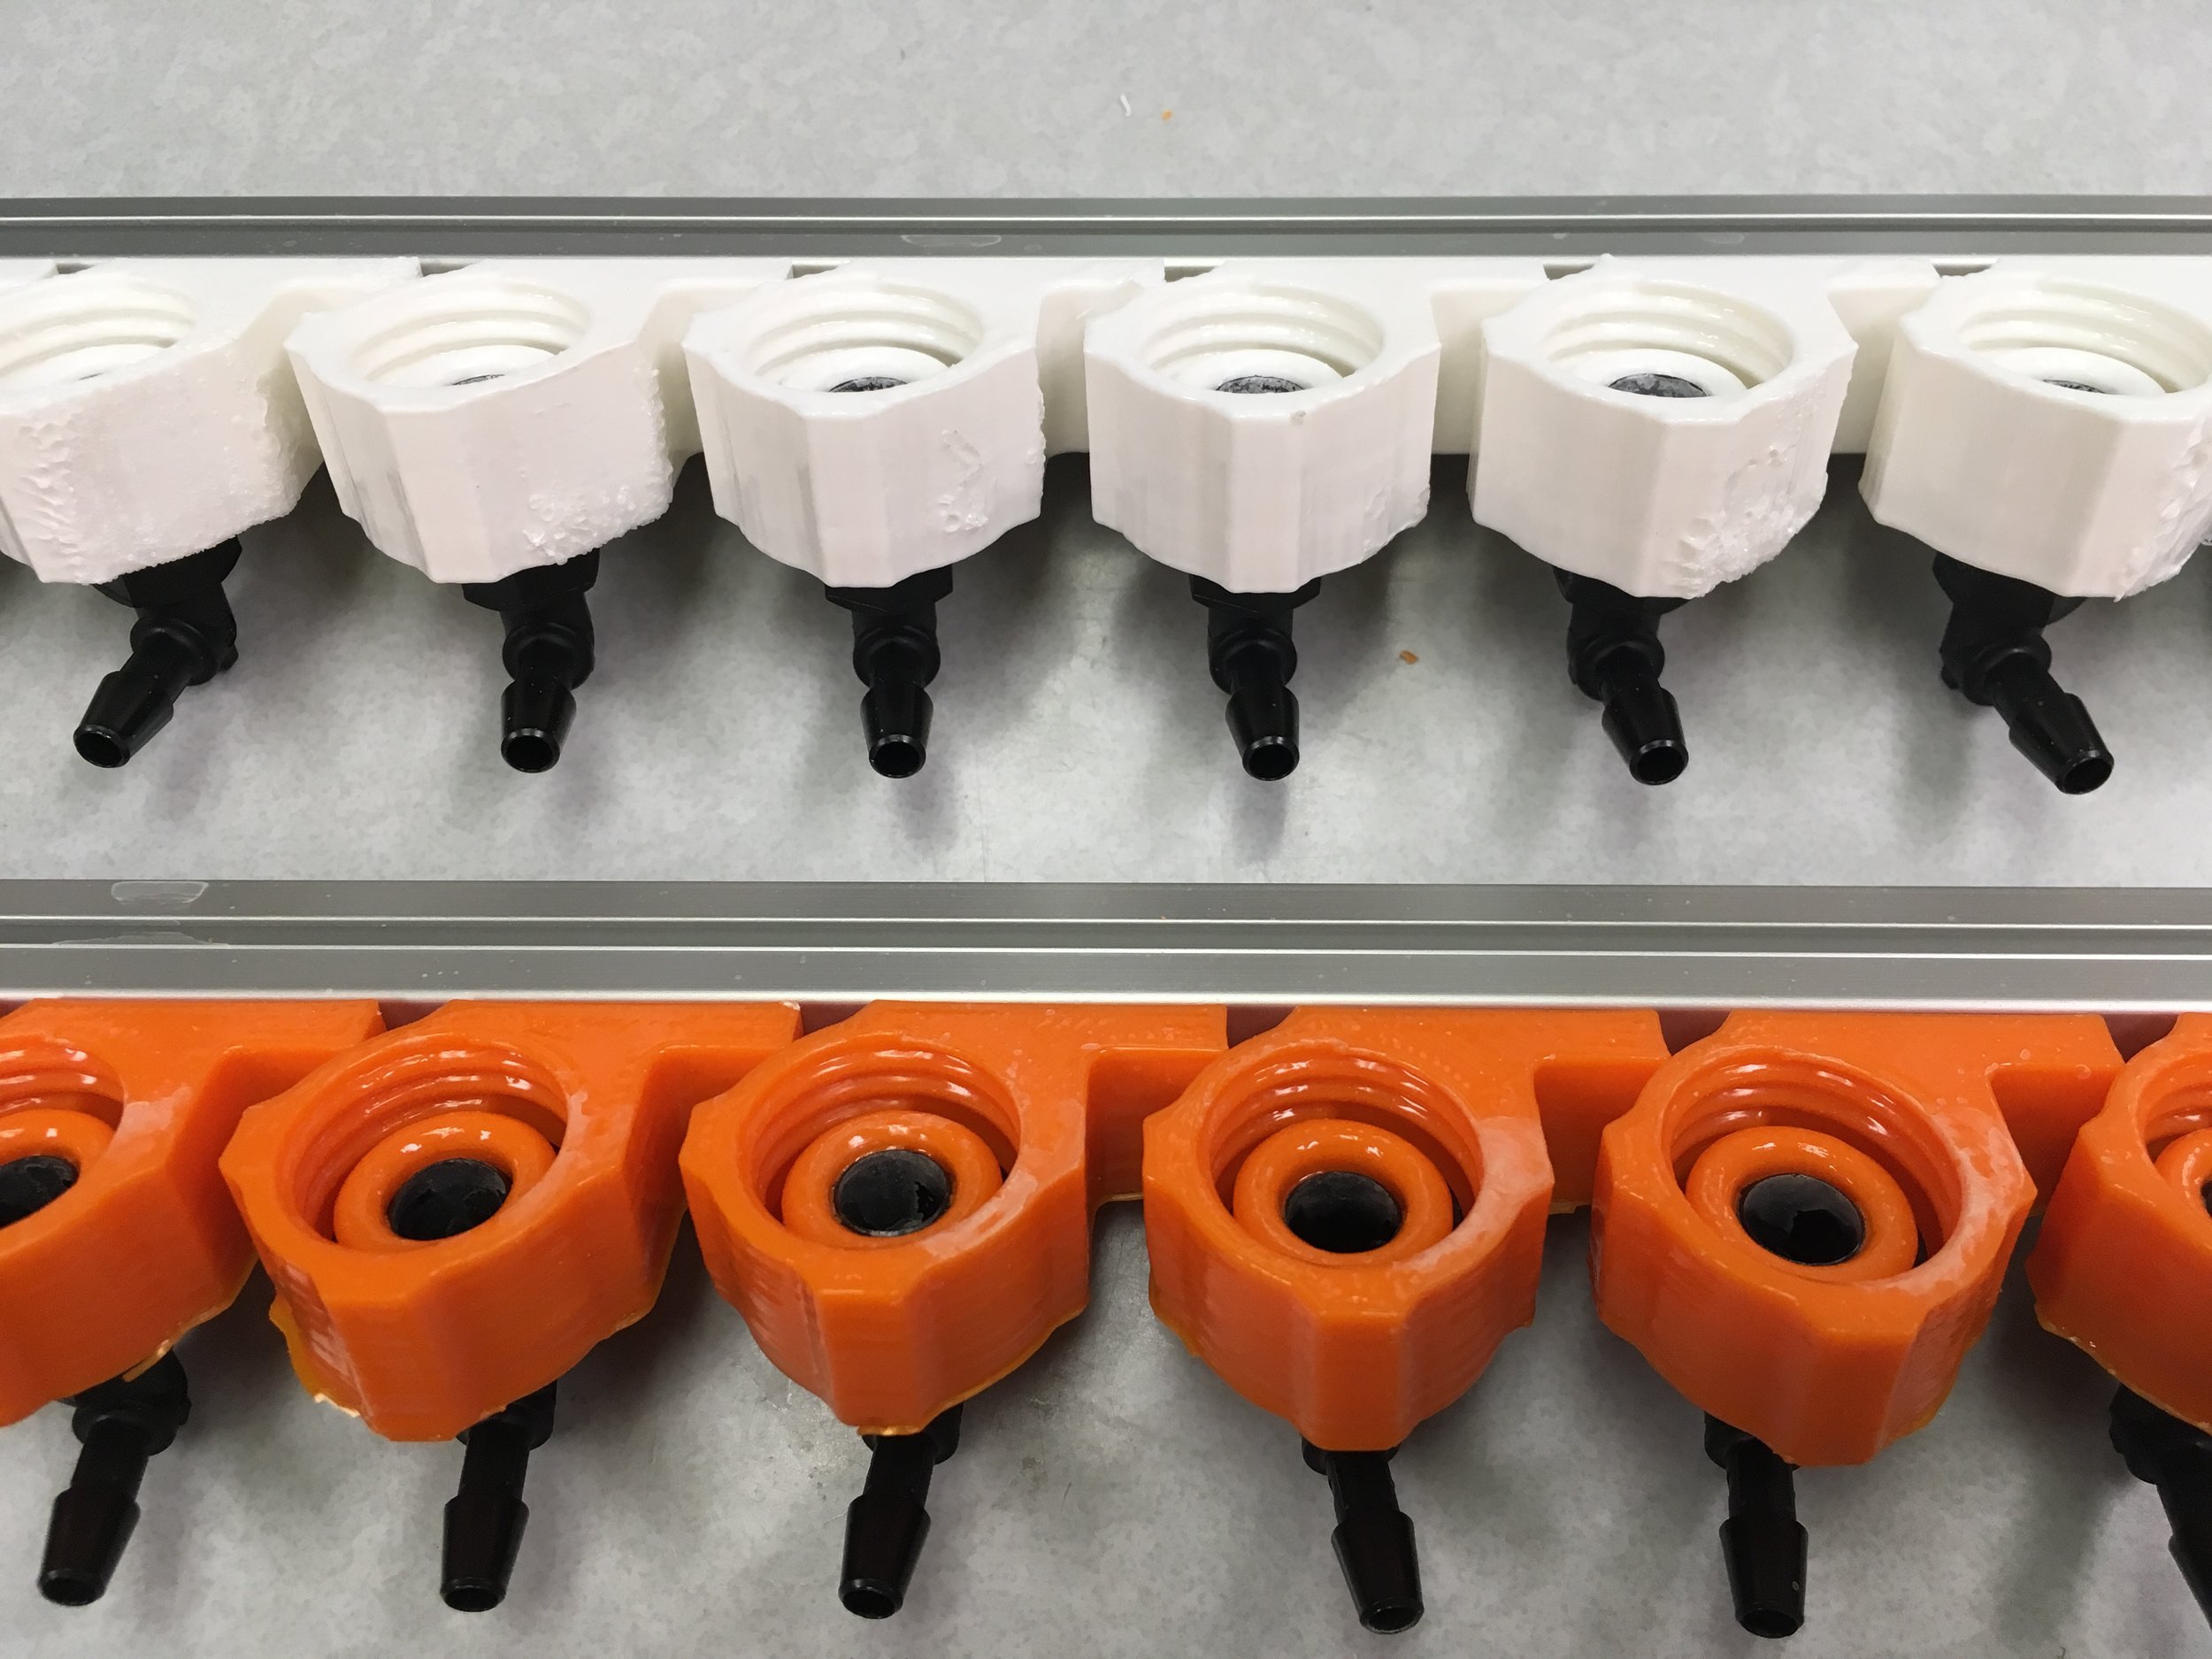
The new pumps arrived and we will be testing them soon. It looks proming but we will need to change either the tubing or the tube fittings to work with the rest of the sampler tubing. These will be added to the new samplers Azad and Adnan are assembling.

Android App:

In other news, three students will be working on adding an Android app to receive updates from and control the sampler remotely as their senior capstone project for their majors in computer science. In the coming weeks they will be contributing to the blog by introducing themselves and eventually posting updates on their work on the app.

Zurich Sampler Updates:

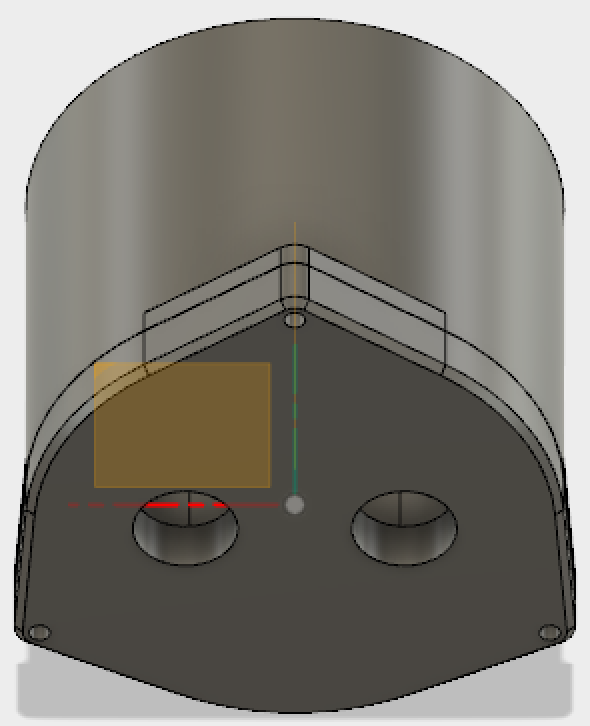
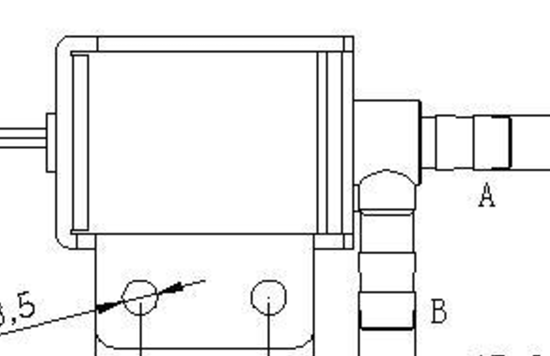
Quick Disconnect Fittings:

I finished the design of the endcap on which the two quick disconnect fittings are mounted and it is currently printing. Designing the endcap was more of a challenge than I initially predicted due to the awkward nature of the barbed fittings and the Pelican’s small outlet port. Because the threaded outlet on the Pelican cooler is too small to fit two fittings side-by-side, the endcap was designed in two pieces that would clamp together with an o-ring and three M2 screws. The male fittings can be threaded through the front panel with an o-ring to mitigate airflow. The sampler tubing can be pushed through the main body of the endcap while it is disconnected from the front panel, and then attached to the barbed ends of the fittings. The main body is then screwed onto the Pelican’s outlet port and the front panel is attached to the main body via M3 screws and nuts, completing the assembly. Intake tubing is attached to the intake fitting via the female quick disconnect fitting.

Filter:

The optional filters were quite easy to integrate into the design. The filter mesh is 470 micron stainless steel from Grainger with open ends. The front of the intake is blocked with a simple 3D-printed plate and the other end is blocked with another plate with a compression fitting screwed into it. All components of this assembly are glued with “ABS paste”, a solution of dissolved ABS plastic filament in acetone. The paste acts to weld the plastic components together.

Operator Interface:

The new Operator Interface turned out quite well. It consists of a 12V barrel jack port for powering the device with either a battery or a voltage regulator, a power On/Off switch, an enable switch for changing sampler modes (field use vs lab testing), an interrupt override button for initiating sampling in the field and also for lab testing, and a USB type B socket for communicating to the Arduino with a laptop. The panel is 3D printed and slides into the 15mm extrusion.

Conclusion:

There’s a ton of development happening on the OPEnSampler and I’m excited to showcase the new design once the two new samplers are completely assembled. In the coming weeks we will ship out the OPEnSampler for the first time, I will update the gitHub page with the latest designs and bill of materials, the capstone students will introduce themselves on this blog, the new pump will be tested, and the new samplers will be fully assembled.

Choosing a Different Peristaltic Pump


newpump screenshot.pngnewpump screenshot.png

Abstract:

An alternative to the previous Honlite 1000mL/min peristaltic pump was required: our department cannot buy from Aliexpress or Alibaba, and Honlite only sells their pumps on those sites. Luckily, I found a 24DC, 2200mL/min pump for $99 on Amazon! Let’s discuss why this is a big deal and how it will work.

Discussion:

Peristaltic pumps generally come in two categories: cheap with a low flow rate, and extremely expensive with a high flowrate. Perform a simple google search for “high flow rate peristaltic pump”, and you’ll quickly realize why the first design tried to get away with two $12 pumps in parallel. On top of this, high flow rate pumps often require greater supply voltages or even an AC current not compatible with the current electronics. 

The 2200 mL/min pump, despite its 24VDC rating, has a very affordable price for the specs. The 2200 mL/min is over 4 times the minimum requirement of 530 mL/min, based on the EPA’s recommended line velocity of 60cm/s or greater (source) and our chosen tube ID of 0.17” or 4.3mm. The manufacturer, in an answer to a customer’s question, said the user should expect their pump’s flow rate to increase linearly with supplied voltage. Based on this, we could expect the pump to provide a flow rate of roughly 1100 mL/min when powered from our system (12VDC). 

Other Considerations:

The new pump comes with barbed fittings on either end of its soft tubing that are too large for the teflon tubing ID of 0.17”. Barbed x Compression fittings are an awkward, hard to find (possibly non-existent) kind of fitting so instead a Barbed x Barbed reducing fitting should be purchased. US Plastic doesn’t stock anything close to what we need, but two of these 3/16” x 3/8” stainless steel fitting from KegWorks should do the trick since 3/16 is 0.1875.

Assembly Day 1


20170926_095157.jpg20170926_095157.jpg

Abstract:

Azad and I spent part of the morning assembling the frame of the bottle-based OPEnSampler. I found quite a few changes I will make when assembling the next sampler. In the end we found the device didn’t quite fit in the duffle bag and so some machining will need to be done to reduce a couple dimensions.

Assembling:

The assembly of the frame was a simple but tedious process. There were only a few unique parts: two different lengths of 15mm square aluminum extrusion, aluminum brackets, M3 screws, and M3 square nuts. The aluminum extrusion was cut by the manufacturer to specified lengths to skip right to the assembly stage. Azad and I each assembled an end face and attached a long extrusion, though it would have been easier to attach all the long extrusions to one face first and then attach the other face afterwards.

We found that attaching all the brackets at once to an extrusion resulted in sliding and flopping brackets while joining the opposite end to the frame; I’ll be sure to write the instructions so that brackets are attached only when necessary to avoid headaches. If that was unclear, most of the problems can be summarized as not attaching brackets when we should have attached them. 

Fitting into the Bag:

Unfortunately I failed to dimension the frame to fit into the bag opening, which is slightly smaller than the bag space itself. Additionally, the height and length of the sampler were a bit too large to fit in the space anyways, so tomorrow I will have to disassemble the frame and head down to the machine shop to reduce a couple dimensions. Luckily it is easier to reduce the size of the device than to expand it, and there seems to be plenty of space for the bottles if I remove the ice tray from the design.


IMG_0213.JPGIMG_0213.JPG


IMG_0214 2.JPGIMG_0214 2.JPG

Investigating a Solenoid Valve’s Strong and Weak Orientations


IMG_0200.JPGIMG_0200.JPG

Abstract:

We observed our $1 solenoid valves were failing under low pressure conditions. After some investigation and testing, we found we could safely orient the valves in  to ensure the flush valve will fail first while the sample valves will form quite strong seals when closed. This solution allows us to continue to use the cheaper valves and keep our cost of materials down.

Introduction:

Cost is a limiting factor when choosing components for the OPEnSampler. There are many repeat components, including the 24 sample containers, 52 compression fittings, 25 feet of tubing, 32 aluminum brackets, 16-20 pieces of aluminum extrusion, and 26 solenoid valves. Increasing the cost of any of these by several dollars would increase the total cost of materials by $100 to $200, depending on the component. We chose cheap $1 solenoid valves from AliExpress with this factor in mind, knowing the next best alternative were adafruit’s $7 solenoid valves. It turns out, however, that our $1 solenoid valves are quite weak and fail under normal use conditions due to the water pressure from the pump. Luckily, the solution was quite simple.

Explanation:

Solenoid valves open and close the flow of water with a linear actuator that pushes out or pulls in. In cheap normally-closed solenoids a spring holds the actuator out, pressing an o-ring against the face of the inlet as a seal. When current passes through the solenoid, the actuator pulls in against the spring and water is allowed to pass from inlet to outlet. The diagram below, taken from dyxminipumps.com, shows how our $1 valve’s inlet and outlet (openings A and B, respectively) are perpendicular to each other.


dyxpump diagramdyxpump diagram

Using A as the inlet and B as the outlet, the valve will fail under quite low pressures. This is because the actuator is only blocking flow because of the force of the small spring; a small pressure from a pump only has to surpass the force of the spring to force the actuator backwards, opening flow from A to B. Orienting flow in the reverse direction, however, yields different results. Any pressure applied from opening B acts perpendicular to the motion of the actuator, neither adding nor subtracting from its closing force. In this orientation the valve will stay closed under very high pressures and a pressure buildup will cause other components of the water line failing first, such as the tubing popping out of fittings. This is quite undesirable in the normal application of these valves, such as in coffee machines, but we can take advantage of the failure behavior of the two orientations for the OPEnSampler.

By directing flow in the sample valves from B to A they will stay closed in the event of a pressure buildup, maintaining the integrity of the samples by preventing cross contamination. If the flush valve is oriented opposite, from A to B, it will be the weakest point in the water line and will fail first, effectively becoming a pressure relief valve for the system so that the water is released out the drain before fittings break. 

This was tested in the lab by connecting the outlet of the pump directly to each of the valve’s openings in turn and running until failure. The pump ran for two minutes without valve failure while B was connected as the inlet and A the outlet, but failed after a few seconds in the A-B orientation.

Conclusion:

The sample valves will be oriented with flow from B to A and the flush valve will be oriented A to B. By taking advantage of the failure conditions of each orientation we can continue to use the cheap $1 valves without worrying about their low-pressure rating. This not only reduces further design work and prototyping but also saves about $150 per unit compared to the $7/piece alternative.

Choosing a Peristaltic Pump

Abstract

There are currently two pumps to choose from for the OPEnSampler: a low flow rate, unknown-precision peristaltic pump and a high flow rate, “low precision” pump. They have their pros and cons and this writeup will discuss the angles of attack for deciding which one is more appropriate for our system.

Specs:

The WMC Pump has the following specs:

  • 12V DC 400mA
  • 297 mL/min flow rate, among other lower flow rate options
  • 5mm Viton Tubing, among other options
  • Barbed Fittings

The Honlite Pump has the following specs:

  • 12V DC 1.2A – 3.2A
  • 1100 +- 8% mL/min flow rate
  • Tygon Tubing, among other options
  • Compression fittings for 1/4” OD tubing, among other options

Discussion


WMC Pump Head

The WMC pump has been tested on our prototype system and has proven to be reliable and true to its specs. It can reliably pump 250mL/min of water at zero net suction head, which is about three times as fast as our previous dual-pump system. Despite such an improvement, the flow rate is still quite low for attaining representative samples of suspended sediments, such as fine-grain sands [source]. A flow rate of 530+ mL/min is required to reach the EPA’s recommended 60 cm/s minimum line velocity for such sampling where the flow of the analyte heavily relies on the mass and specific gravity of the particulates [source]


Honlite Peristaltic PumpHonlite Peristaltic Pump

Honlite Peristaltic Pump

The Honlite pump from AliExpress has yet to be tested however the manufacturer supplies more specifications than the WMC pump. The defining characteristic of this pump is its 1100 mL/min flow rate at 12VDC, almost 4 times the rated flow rate of the WMC pump and twice the minimum recommended flow rate for sampling suspended solids. Some downsides are its high variance in flow rate of 8%, though further testing of the WMC pump could prove this is not an usual variance, and further testing of the Honlite pump could prove this variance is controllable. The pump head only has two rollers (three is standard) and so the rhythm of the pump could be noticeable, but will quite likely have a negligible effect on the sample quality.

One method of fixing the inconsistency of any pump used is to add a flow rate meter in series with the pump line. This flow rate meter can catch when the pump is struggling or increases its velocity significantly and adjust the PWM control of the pump driver chip, effectively increasing or decreasing the voltage supplied across the pump to account for the change in flow.

Conclusion:

Both pumps cost around $65 (the Honlite pump costs $30 with $35 shipping to the US) so reliability and flow rate are the most significant factors. Neither pump states its maximum suction head, though almost all peristaltic pumps seem to have a maximum suction head greater than 5m. This is why the Honlite pump was chosen for the Q4 2017 design, but several WMC pumps will be purchased as backups in the event we find the Honlite product to be faulty.

It is quite difficult to find a peristaltic pump with a sufficient flow rate for such a low cost and this is the primary source of skepticism for using the Honlite pump. How are they able to achieve such a large flow rate without increasing cost? The answer could be they are mass producing these pumps in a highly efficient system, or perhaps their pumps are not as reliable. Consistency in sample volume may not be a large concern, however an inconsistent sample volume is almost exclusively caused by a varying velocity of sampled water in the tubes. This varying velocity can certainly lead to varying turbidity and suspended solids measurements [source] [source], and so consistency is a huge factor in choosing a pump.


Reviewing the Diameter and Material of OPEnSampler Tubing

Intro

The EPA recommends a flow rate of 2 ft./s or greater to minimize the relative difference in velocities of suspended sediments. They also recommend a tubing diameter of 1/4 in. as well, but not for a particularly well documented reason. One unanswered question brought up in the design review meeting was the impact of tubing diameter on the quality of water samples. This short writeup discusses some of the considerations involved in the decision to use 1/4” OD Teflon tubing for future sampler designs.


Design Considerations

A paper published in 1985 collected some data on this subject [link to paper]. It discusses several trials where different concentrations of dissolved organic compounds were passed through tubing of varying diameters and materials at a known rate. The concentrations of the passed solutions were measured and recorded.

There are two obvious factors involved: the tubing absorption rate and friction. Absorption is based on contact time, tubing area, tubing material, and the analyte. Absorption is not a concern in suspended sediments but is critical when the analyte is dissolved carbons and gases. Contact time is based solely on flow rate. 

The friction coefficient is decided by the material and the force of friction will be proportional to the tubing diameter and flow rate. The force of friction will reduce the flow rate of the sample water, increasing contact time between the tubing wall and the sample water. Lower flow rates also reduce the accuracy of suspended sediment sampling where particle mass is a dominating factor that creates a differential velocity between the particulate sizes, shown by this study [link] mentioned to me by Dr. Babbar-Sebens.

The results of the experiment suggest the diameter of the tubing has a lesser effect than the material of the tubing on absorption rates for inner diameters between 1/4” and 1/2”, however increasing the tubing diameter decreases the absorption rate for the same material. This effect is unexplained in the paper and the relationship between tubing diameter and sample quality has very little research behind it. It is likely that the largest factor in choosing the tubing diameter is the maximum particulate size of suspended sediments, which requires a minimum diameter cross section throughout the entire hydraulic system including the solenoid valves and pump tubing. 

Both the study mentioned above and this other study [link] show that teflon tubing absorbs the lowest proportion of dissolved organics. The EPA in this paper [link] also suggest that a high velocity decreases the slime buildup against the inner surface. 


Conclusion

Because large suspended sediments (1mm+ diameter) are beyond the scope of the current sampler, Teflon tubing with a .17” ID and .25” OD will replace the current 3/16” ID Silicone tubing. Compression fittings will have to be used rather than barbed fittings. The change in diameter of the tubing will increase the velocity significantly and the teflon tubing will have much lower coefficient of friction, improving small particulate movement in sample water. Teflon tubing will be nearly impermeable to gases and will absorb extremely low amounts of dissolved compounds in the sample water, making it ideal for most of our intended applications, such as sampling for dissolved organics or volatile isotopes.


Accounting For Signal And Power Line Noise On An Arduino Caused By A Brushed DC Motor

A bug in the water sampler’s electronics has come and gone throughout the iterations of our design: the valves would reset intermittently when the pump motor was operating. First we moved the pump from the same shift register as the valves to its own dedicated MOSFET. We added a small capacitor for mild noise. The problem disappeared until later iterations. Then, we changed the MOSFET to a dedicated H-Bridge motor controller from Adafruit, equipped with its own 22uF and .1uF decoupling capacitors. The problem disappeared until we used a larger pump in a later iteration. So we talked to Jim Wagner about it and he cleared things up for us.

It turns out that brushed DC motors create a lot of noise, which is exactly as we expected but did not know how to fix. The brushes in the motors cause irregular noise in the power lines with pulse widths too small to pick up on a multimeter, but quite easy to see using an oscilloscope. I hooked up the arduino’s 5V pin and ground to a probe and ran the system under the conditions that would cause the valves to reset. The scope was set to trigger on a falling edge lower than 3.04v. Sure enough, the initially-open valve closed and water forced its way through the flush valve after building pressure.


Look a little closer at the oscilloscope:


The 5V rail dropped to nearly 0V for about a microsecond, more than enough time to drop the SCLR line to fall to a low state and reset the shift registers. This explains why the valves were resetting! It wasn’t just this one instance, either; the valve continuously reset as the command “V1 1” to open it was sent, and the oscilloscope was continuously triggering due to a falling edge like the one in the picture as long as the pump was running.


OK. We had already added a 100 uF capacitor between the Arduino’s VIN (12V) and GND pins. I removed that and bumped it up to 1000uF, reconnected the system to the oscilloscope and ran the test again, this time with similar but notably different results.


The valves were still resetting, and the oscilloscope was triggering often, but the voltage never dropped below 2V. A small victory, surely, however the problem remained. I decided to add a 100uF capacitor between the 5V and GND pins in addition to the capacitor that I had already attached between the 12V and GND. A retest resulted in the valves resetting after 8 seconds of stability, but the magnitude of the noise was still the same:


I read here after some quick research that multiple capacitors of different sizes in parallel would buffer different frequencies of noise. So I unplugged everything again and took the board to the soldering station, tacking on a 10nF ceramic capacitor parallel to the 100uF cap between the 5V and GND pins. This time the valves lasted 15 seconds before resetting on a much smoother blip, magnified to 250ns per division below:


The same signal magnified to 10ns per divison below:


So close! I carefully unplugged everything one more time, soldered on a 1nF capacitor in parallel, then set up the test one final time:


Finally, the valves stayed on! The system ran for a minute straight without so much as a whisper from the probed voltage. This solution can be used in the next iteration of the PCB after more research, calculation, and perhaps discussion with Jim in order to protect against a wider range of noise on more lines more efficiently.

OPEnSampler Update August 9, 2017


OPEnSampler_15rev1OPEnSampler_15rev1

Abstract

Much progress has been made with the OPEnSampler! The frame is lightweight, the entire system fits into the Pelican rolling cooler, and the sample control works as expected. 24 bags fit with room inside the frame, and the system can be set on any face without issues, easing maintenance, testing, transport, and drawing out samples. Some issues persist in this iteration, namely light leaking from the bags and a low flow rate due to the cheap pumps.

Electronics

The electronics of the sampler have evolved. They consist of an Arduino Uno connected to three custom PCBs: two Valve Breakout Boards (VBBs) and one Main Control Board (MCB). The MCB connects directly to the Arduino and includes the shift registers to control the valves, the motor breakout board for the pumps, the real time clock, and receptacles for ribbon cables connecting to the VBBs. The VBBs break out the open-drain outputs on the shift registers to 12 JST terminals each, corresponding to one valve each. Doing this reduced the wire-spaghetti caused by directly soldering wires to each valve. 


openSampler_electronicsopenSampler_electronics

Frame:

Slotted aluminum extrusion can be ordered at specific lengths with a tight tolerance for several dollars per piece, allowing the frame to be assembled in minutes with purchased corner brackets. A lighter but sufficiently strong 15mm aluminum extrusion was used, reducing the weight of the frame to just over 2 kg. The design of the frame allows the OPEnSampler to be tilted in any direction without issue.

Hydraulics:

Water to be sampled is pulled through an open end of 3/16” ID silicone tubing via two $12 peristaltic dosing pumps in parallel. The pumps claim to have a head height of “10m” and a flow rate of up to 150 ml/min, but in practice the numbers are about half those values. Further testing will be carried out, but the pumps will be replaced with a $60 peristaltic pump from a more reputable company supposedly capable of a 350ml flow rate.

Down-line of the pumps water fills the rest of the tubing, leaving the exit end if the flush valve is opened, or is pushed into a sample bag when its respective valve is opened. To draw sampled water out of a bag, its respective valve is opened and the pumps are powered in reverse using the H-bridge motor breakout board bought from Adafruit. 

Current Bugs

There are a couple known bugs in the system and one major design flaw that limits the functionality of the device. The first bug is mechanical: the bags leak when they are upside down. Initially, this was a very significant amount, draining the bags overnight. Teflon tape was wrapped around the elbow connectors that screw into the printed bag caps, and the leaking was reduced to a few mL per hour. Initial tests of new bag caps with changed O-Ring gland dimensions, a 3% smaller diameter through-hole for the elbow fittings, and the replacement of teflon tape with a gorilla-glue and acetone coat show very promising results with no leaking in the first two caps tested. 24 new caps were printed, processed, and are currently drying before testing tomorrow morning.


dryingBagCapsdryingBagCaps

The second bug is intermittent and will be difficult to fix. On occasion, valve 7 becomes permanently powered and will stay open regardless of what serial commands are fed to the Arduino. This is characterized by a lack of actuating sound when the command “V7 1” (valve 7 on) is sent, by bag 7 filling despite sending the commands to fill another bag, and by an actuating sound upon powering on the device. This bug is not consistent and the cause is currently unknown. Battery power was suspected initially, but when probed the battery read a high 12.7 volts. 

The major design flaw is the low flowrate of the pumps, including the new pump selected. The EPA recommends a line velocity of greater than 2 ft/s when sampling for suspended solids such as sediments (link). With 3/16” ID tubing, this equates to a flow rate above 600 mL/min. Low flow pumps were chosen because high-flow peristaltic pumps cost between several hundred and several thousand dollars. A 3D printed pump head with a store-bought DC gear-motor is being investigated, though a <$100, 1000ml/min 12V pump has been found on AliExpress and will be tested out before a DIY pump is developed. 

Conclusion

While a significant portion of this writeup was dedicated to discussing the current issues with the device, the OPEnSampler is working almost exactly as expected. If a solution to the leaking problem is not found soon, the bags can simply be reoriented to sit upright for this current version. The pumps will be sufficient in sampling for analytes that aren’t large-particle suspended sediments.

OPEnSampler Update, Bertha

By: Chet Udell

Abstract

Our efforts over the past moths have culminated in a robust lab-tested prototype of the OPEnSampler we endearingly call “Bertha.” We’ve determined this will be our in-house lab prototype that we will use as a testing bed for integrating new features and hardware. Lessons learned experimenting with Bertha will directly translate into field-deployable OPEnSampler versions to be distributed for use. This post details the technical specifications of Bertha, features, Serial Commands, and use cases.

Technical Specs

  • Frame dimensions are 24in x 12in x 12in and made out of 40mmx40mm extrusion.
  • 2 12VDC Peristaltic pumps (250ml water pumped in 2min)
  • 24 250ml aluminum-lined Mylar bags (spout packs)
  • 25 12VDC valves (24 valves attached to bags, 25th valve is used as a system flush outlet valve)
  • Arduino Uno, Microprocessor
  • Custom PCB with TPIC power-shits registers for handling valve actuation
  • Motor driver board
  • High Precision, Temp-compensated Real-Time Clock, for microprocessor sleep/wake(sample) scheduling.
  • Mode switch toggles between Sampler operation modes: standard operation mode, serial command mode.
  • EEPROM saves configuration of sampler parameters (sample duration, flush duration, next valve to sample, etc).
  • Serial command set for configuring the sampler’s behavior out in the field and for sending discrete commands (puppet-string) to turn on/off discrete components of the sampler. e.g. turn pups on/off/reverse and open/close specified valves.
  • Power-save Sleep mode, for ling battery life in the field. At the moment, drawing 24 250ml samples should require just 1 Amp Hour of a 12VDC battery. In standard operation mode, sampler stands by in low-power sleep in between taking samples. In serial command mode, electronics remain awake and stand by for configuration commands from computer.

Modularity

In consultations with many different researchers hoping to use this OPENSampler, we identified that the technical specifications of the sampler will vary depending on the context of use. This includes: What kind of water source is being sampled, what is being tested or analyzed, and environmental conditions and considerations in the field. To this end, we decided to make a “core” system that would be extensible using attachments for particular deployment contexts. This architecture is not dissimilar with many vacuum cleaner systems, where the core remains immutable but changes utility based on the attachments used.

Packaging: The frame is designed to be dropped into a variety of different “packages” depending on the field requirements. In many instances, a waterproof duffle bag may suffice for carrying the device into back-country environments. Rigid stack-able boxes made from corrugated plastic may be desirable for other deployments. For field deployments requiring samples be temperature protected (from wither extreme heat or cold), dropping this into a rolling lockable travel cooler such as the Pelican 80qt Elite.

Use

Switch the sampler into “serial command mode.” Not required, but should be done for best practice. After programming the Uno over USB, you may either switch the sampler directly into standard operation mode or send serial commands to configure your sampler’s parameters. Switching modes back and fourth may be done at anytime. In operation mode, a sample cycle is initiated whenever the specified time has elapsed.

Each sample cycle consists of the following states:

  1. System Flush
  2. Sample Draw (in next bag in sequence)
  3. System Sleep/standby

Samples may be removed from the device without manually removing bags. This is achieved by switching the sampler into serial command mode and typing commands into the Arduino Serial Monitor window to draw samples out one by one in any desired order. See commands below. This process may be automated (and should be) using a program to send a sequence of timed commands. A sample python script can be found on the project GitHub site.

Sampler Configurable Parameters and Factory Defaults Are:

  • IsDaily = True (Take a sample either daily or at a set periodic rate throughout the day)
  • 8:00 (default daily time to take sample)
  • Sampler Duration = 100 seconds (takes 120 seconds to fill 250ml)
  • Flush Duration = 30 seconds (this will need to be set based on the length of tubing away from main sampler – longer tubing requires longer flush duration for full system purge)
  • Sample volume = 250 (in ml, this isn’t being used right now, but there in case features need in the future)
  • Sample Valve Number = 1 (next bag to draw sample into)
  • Sample Period = 3 (if the IsDaily flag is FALSE,

The above parameters may be changed at anytime by switching into Serial Command Mode. Parameters are saved in EEPROM and are preserved even if the sampler looses power. Sampler operation will proceed with the new configuration behavior when switched back into operation mode.

Serial Command Set

  • CLK, Checks the current RTC time, Hr:Min:Sec – useful for checking before using SA to set sample alarm
  • SAD (int)X (int)X, sets “Daily Sample Alarm” Hr:Mn to take samples daily at time. Uses 24hr format.
    ex: SAD 9 30 sets sample alarm to 9:30AM daily.
    ex: SAD 16 22 sets sample alarm to 4:22PM daily.
    Also sets Is_Daily flag for initialization if power-down restart, clears Is_Hourly flag
  • SAP (int)X, sets “Periodic Sample Alarm” to take samples at specified period duration in Min.
    ex: SAH 30 sets sample alarm to go off every 30min.
    ex: SAH 47 sets sample alarm to go off 47min.
  • FD (int)X, sets “Flush duration” period in ms, should be about 20sec, but will change with the length of tubing you use to get from sampler to water source
  • SD (int)X, sets “Sample Duration” time that pumps run water into each bag in milliseconds
    ** removed for this version : SV (int)X, sets “Sample Volume” in ml, a transform of Sample Duration, may not be 100% accurate, 2min per 250ml,
  • VN (int)X, Sets the next valve/bag to place sample. Sampler saves curent valve number during operation in EEPROM in case of power failure, it picks up where it left off. This ensures you can reset the valve count before each new deployment, or manually skip to next available bag should the sampler malfunction
  • RST, Full system “factory” reset – set default sample period, sample duration, reset vlve counter, writes defaults to EEPROM (over-wirghting previous settings)

Pupet-String Commands:

  • Vx (int)#, Turn valve on/off where x is valve number (starting at 1, V0 is flush valve). # is 1 for on (open) and 0 for off (close) example: V1 1 opens valve 1. V1 0 closes it.
  • M #, turn motor on/off and direction. #=0 for off, #=1 for draw water into sampler, #=-1 for draw water out of sampler    example: M 1 will begin drawing water into sampler.

From here, you may use Arduino IDE, Python, or other software to send timed sequences to sampler. For example: V0 1 followed by M 1will begin flush.  The sequence (press return where you see / ) V0 0 / V1 1 / M 1will disable flush and draw water into bag1
You could also make a “macro” or timed program in something like Python for drawing water out of the sampler sequentially into your analysis machine without removing bags! Example of this is on the project GitHub site.

Features to be integrated for Zurich Version

The Zurich version is underway, with frame being constructed out of much lighter 15mmx15mm extrusion. This will make the total sampler weight (without filled with water) about 10lbs!

Packaging: The frame is designed to be dropped into a variety of different “packages” depending on the field requirements. The package for Zurich is intended to be a waterproof duffle bag. However, for field deployments requiring samples be temperature protected (from wither extreme heat or cold),

Currently, all sampler status messages are reflected on the Arduino IDE Serial Monitor window when sampler is attached to host computer. We’re evaluating an OLED display that will show all status information during sampler operation.  There will also be a wake button for the display that will show the status of the sampler at anytime during its sleep cycle.

Features for future versions

One major issue is not knowing the operational status of your sampler when left out in the field. Instead of being forced to check in on the sampler in person, we plan to integrate a GSM extension for the core, which will send updates over texts or emails using any 2G SIM card.


A Simpler Pump Test: No SD

Introduction

This is a follow-up to the previous post, “A Simple Pump Test”. There were several complications with storing the pump data on an SD so this post will describe a new method that stores data on the Arduino’s own memory.

Background

In the field, the pumps will be run for 2.5 minutes per sample for 24 samples, resulting in one hour of total runtime. As described in the previous post, the pumps used in the sampler are poorly documented and information on their lifespan and behavior under long periods of use is needed. 

The SD breakout board used in the previous test was a 3.3v board and was not compatible with 5v arduino logic without some voltage conversion in between. While it worked some of the time, it resulted in corrupt data after a few points. Rather than using a 5v board or something to step down the signal voltage, the Arduino’s own memory can be used to store a small amount of data.

Arduinos have a small amount of available memory that doesn’t get reset between power cycles, known as EEPROM. A single byte can be stored per register, and an Arduino Uno has 512 available registers.

Setup and Method

A 12v peristaltic dosing pump is wired such that the positive end is connected to a 12v source and the negative end is split between a .85 Ohm resistor and the Arduino’s A0 analog input pin. The Arduino’s GND is connected to GND on the power source and VIN is connected to 12v. The other end of the .85 Ohm resistor is connected to GND.

A jumper wire connects GND to the Arduino’s digital pin 3, which is initialized to INPUT_PULLUP.

When powered on, the Arduino continuously checks that pin 3 is LOW. If it is, the voltage across the .85 ohm resistor is effectively measured via an analog read of pin A0 and the value is stored in a register of EEPROM. The register address is incremented and the loop resets.

If pin 3 is HIGH, data collection is turned off and the Arduino checks for a serial input of “p”. If the user inputs in the serial monitor “p” then it prints all the data from the registers separated by spaces. This data should be copied and pasted into a text file, but can be reprinted as long as pin 3 is HIGH.

Code

// A simple voltage logger that is 

#include <EEPROM.h>

const int sensorPin = A0;
const int startPin = 3;

long sTime = 0; // last sample time
int maxPoints = 240; // maximum number of points to store
int sDelay = 30000; // delay between samples
int addr = 0;

void storeData();

void setup() {
  pinMode(startPin,INPUT_PULLUP); // if grounded, enable recording
  pinMode(sensorPin,INPUT);
  Serial.begin(9600);
  Serial.println(“Initializing…”);

  
  analogRead(sensorPin);
  delay(1000);
  analogRead(sensorPin);
  delay(1000);
  analogRead(sensorPin);
  delay(1000);
  analogRead(sensorPin);
  delay(1000);
  
  Serial.println(“Initialized.”);
}

void loop() {
  
  //If datalogging is enabled, store data in a new address
  if(!digitalRead(startPin)){
    if(millis() – sTime > sDelay){
      Serial.println(“reading data point ” + String(addr));
      storeData();
    }
  }
  else{
    Serial.println(“Enter ‘p’ to print out data”);
    
    while(digitalRead(startPin)){
      int input = 0;
      
      if(Serial.available() > 0){
        input = Serial.read();
      }
      
      if (input == 112){
        for(int i = 0; i < maxPoints && i < EEPROM.length(); i++){
          Serial.print(EEPROM.read(i));
          Serial.print(” “);
        }
        
        Serial.println();
      }
    }
  }
}

/*
 * store the sensorPin voltage and increment the address. If the address has
 * reached the limit of number of the points or hit the last address of
 * the EEPROM, don’t store data and return from the function.
 */
void storeData(){
  if(addr == EEPROM.length() || addr == maxPoints){
    Serial.println(“Max addr reached”);
    sTime = millis();
    return;
  }
  EEPROM.write(addr, analogRead(sensorPin)/4);
  sTime = millis();
  addr++;
}
 

Python Code

# This code will take in data via a text file that was collected using
# the pumptest arduino code. Data points should be separated by spaces.

import matplotlib.pyplot as plt

data = []
splitter = []
voltage = []
current = []
average = []
avg = 0

with open(‘pumplog_2_p1t2.txt’) as f: #file name for test data to be graphed
    reader = f.readlines() #read in the data

for line in reader: #split up the data. Could be conbined with converting to int but is more readable this way.
    splitter.append(line.split())

for point in splitter[0]:
    data.append(int(point) * 4) # turn each point of data into an int. Data values were divided by 4
                                # to fit into EEPROM.

for point in data: # calculate the voltage at each point.
    voltage.append(point * 5 / 1024)

for point in voltage: # calculate the current at each point.
    current.append(point / .85)

for point in current: # calculate the average current.
    avg += point
avg = avg / len(data)

for point in data: # turn average into a plottable list
    average.append(avg)

plt.plot(current)
plt.plot(average)
plt.title(“Pump 1 Test 2”) #rename based on test
plt.xlabel(“time (minutes)”)
plt.ylabel(“current (A)”)
plt.show()


Initial Results

Conclusion

Three tests have been run so far. They were graphed using Python 3 and matplotlib.pyplot. Another test is currently being run on the second pump. The data between the two pumps will be compared using a two-sample T test to check if the two pumps perform the same. The same method will be used for the pumps under condition of pumping water.

The initial three tests might suggest that there is a long term decrease in the pumps’ current draw. Future tests should be conducted for a full day and a linear regression analysis should be performed. More importantly, such inconsistency in the current draw suggests the flow rate though these pumps is not constant. A test should be conducted to observe the trend and variance in the mass flow rate of water through the pump via a logging scale. A better conclusion can be made once the first round of testing is finished and statistically analyzed.