Author: Brett Stoddard
Hello Everyone!
This last week I’ve been working on getting a system to log data that I will use to calibrate the Smartrac Dogbone RFID moisture sensing tags in soil
Abstract and Objectives
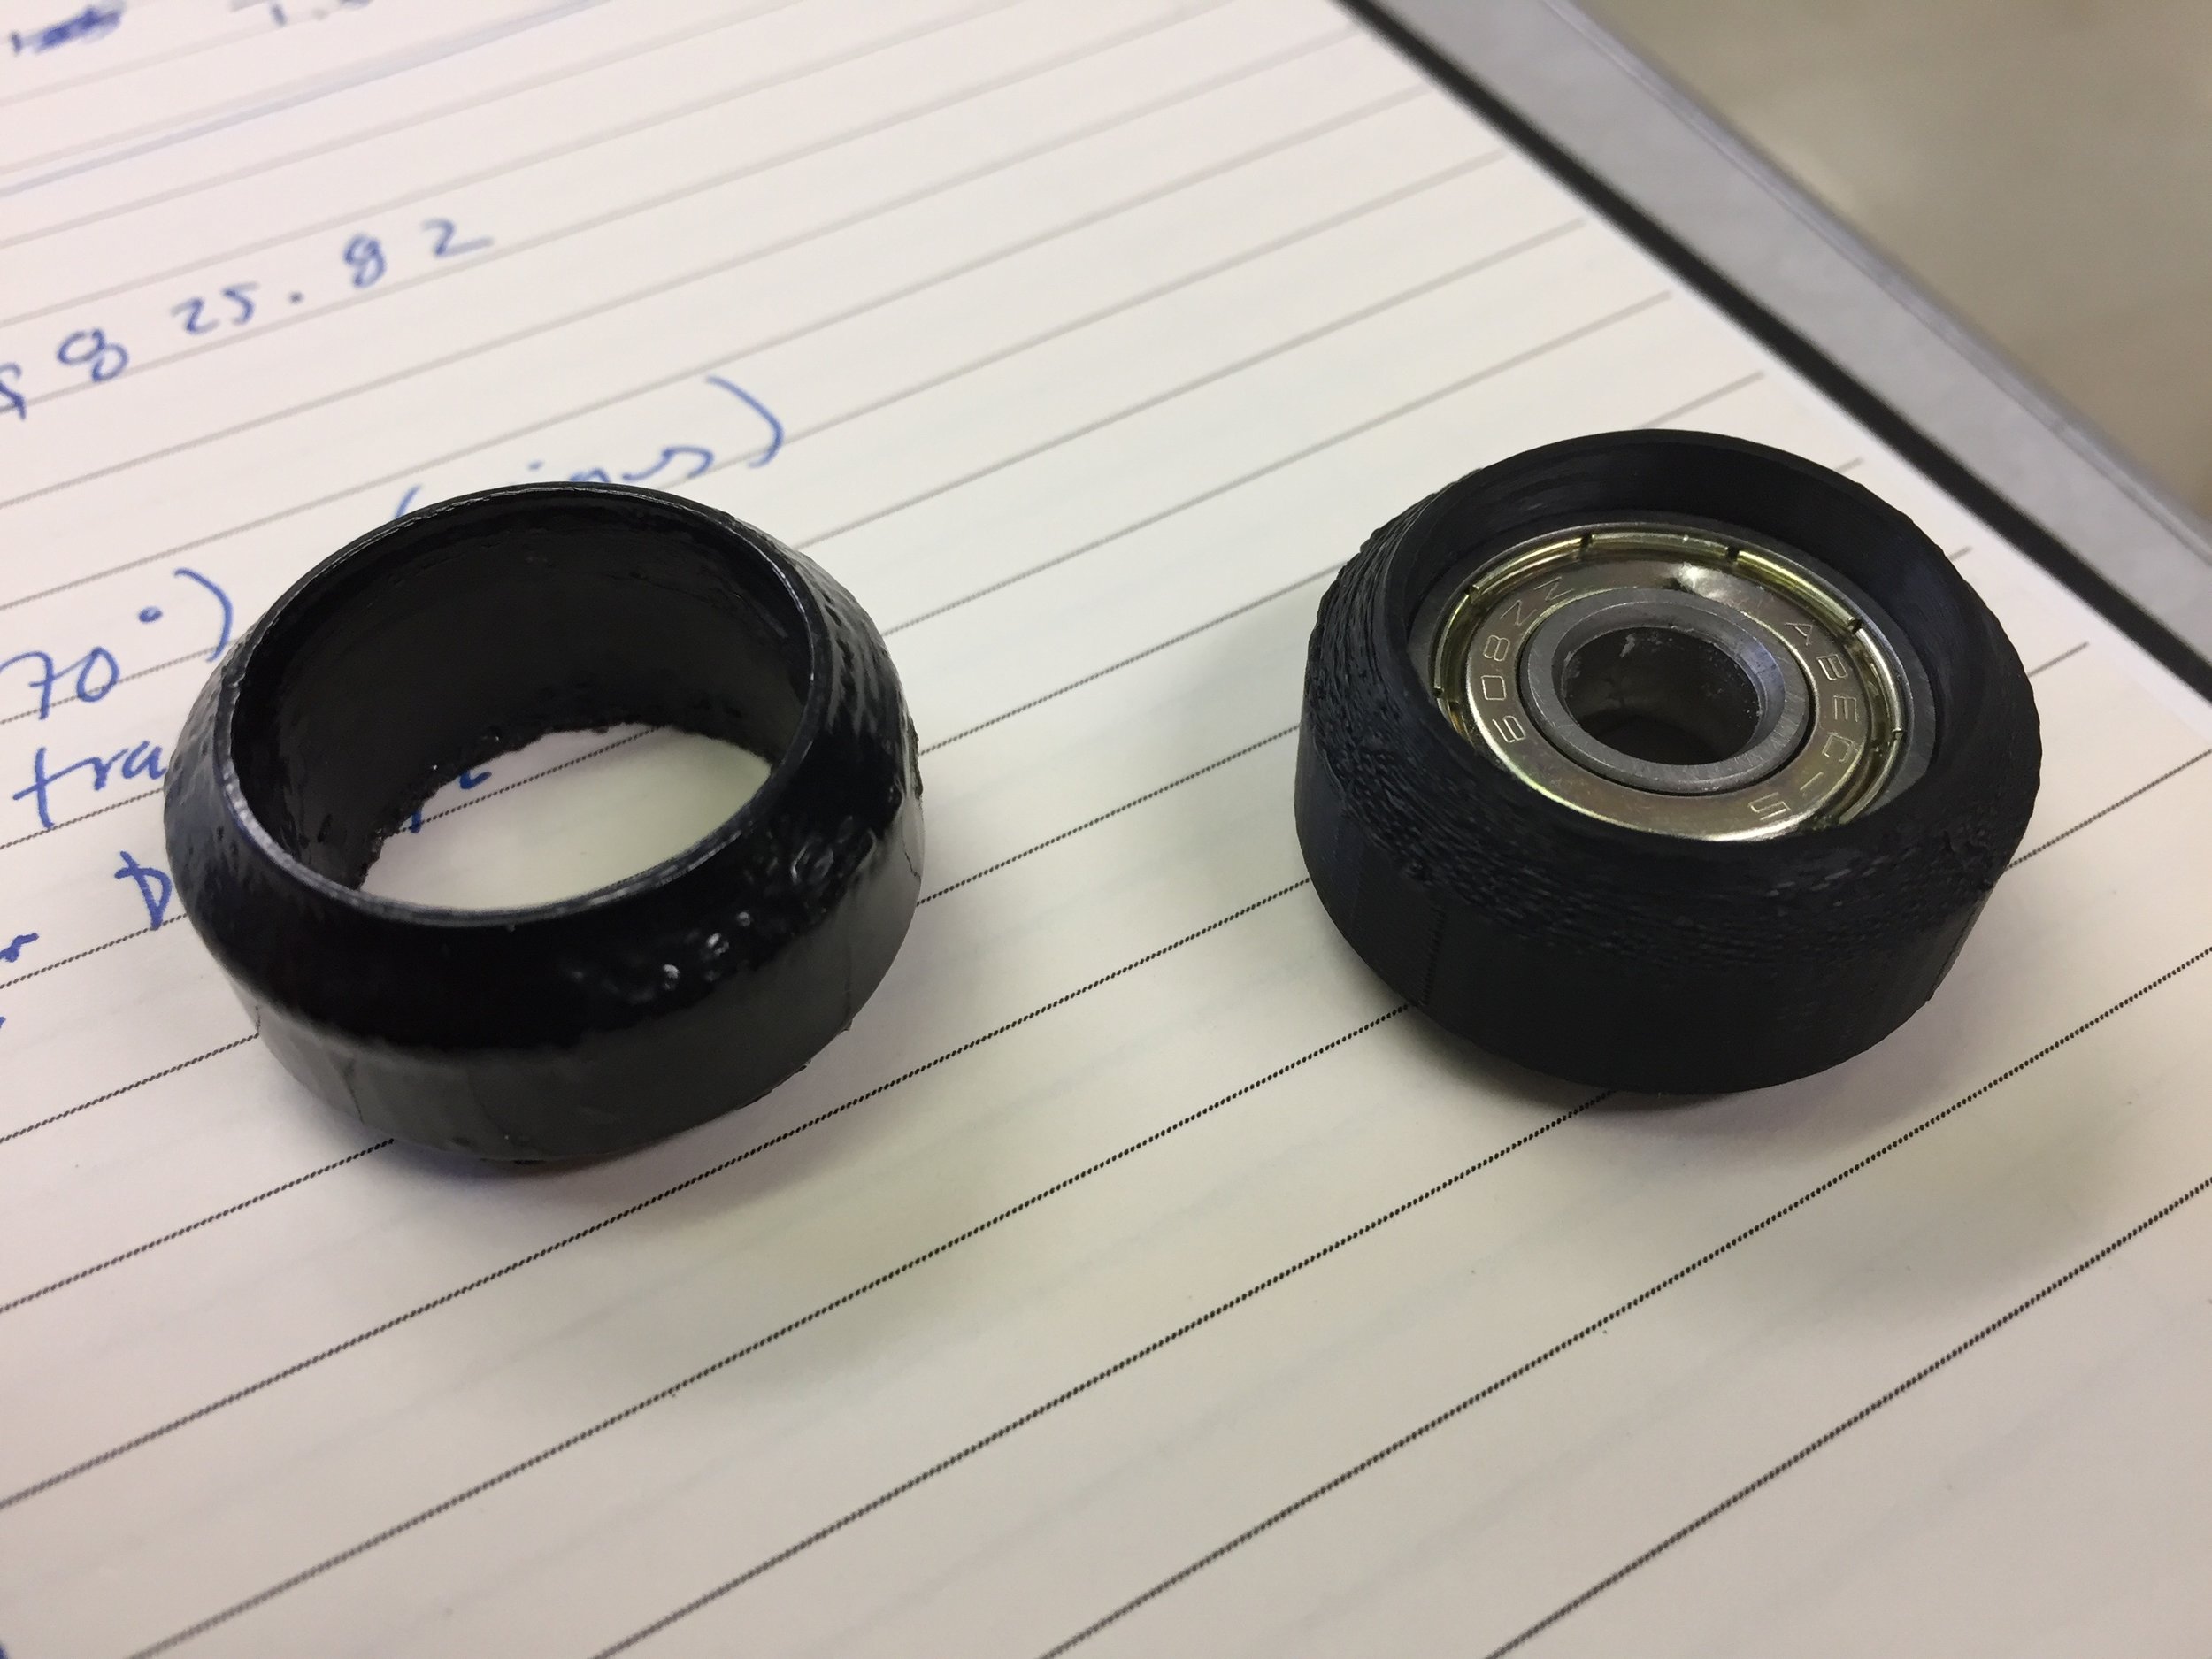
This blog post describes a system to log data that I will use to calibrate the Smartrac Dogbone RFID moisture sensing tags in soil using a Decagon 5TM moisture sensor. The goal of this system is to log both 5TM’s electric permittivity readings (ε) alongside Dogbone’s moisture sensor levels over a long period of time to make a relationship and eventually properly calibrate the Dogbone tags to the current industry standard, dielectric permittivity.
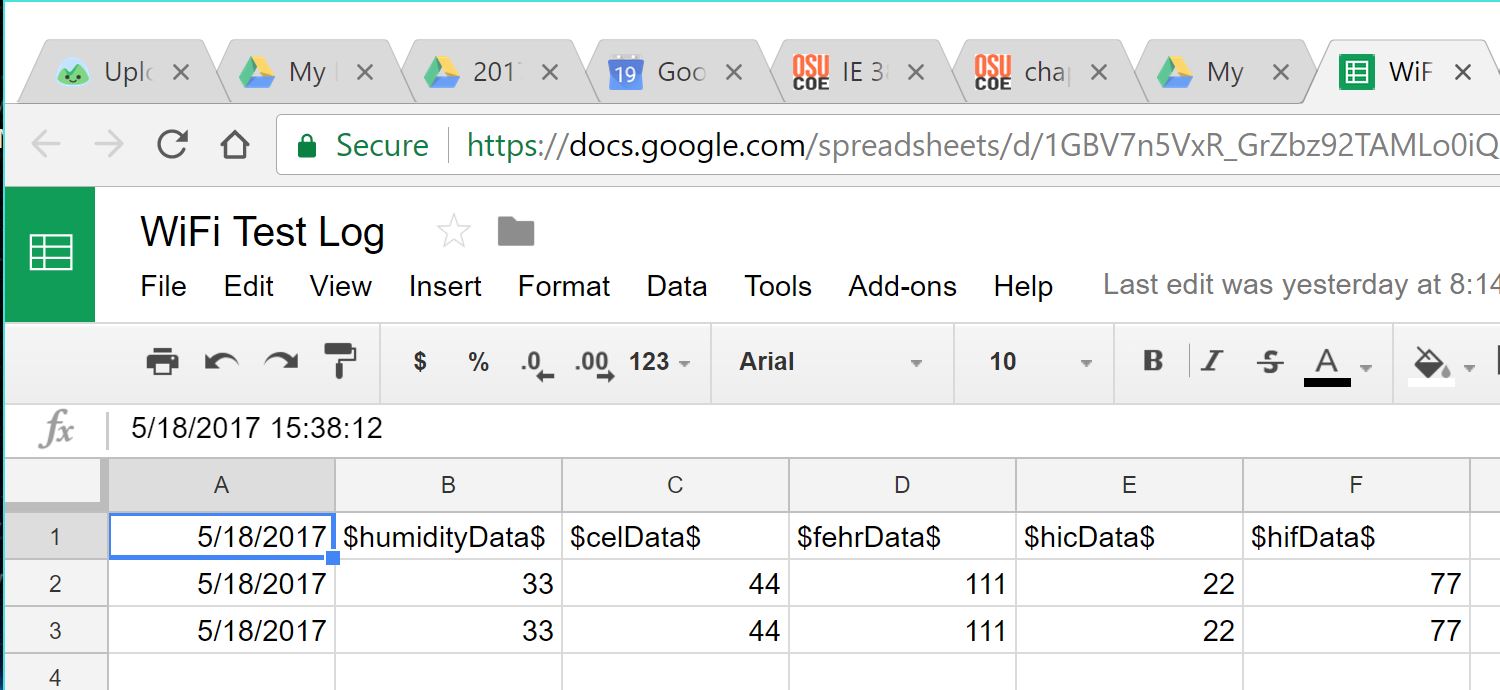
Using a 2GB SD card, this system will be able to record 82 million data points, more than enough for our system (each data point takes up around 26 bytes and 2*230/(26) = 82*106 ). The period that the measurements are taken at can be changed easily, but is currently set at 10 minutes which gives a solid resolution but is still small enough to analyze easily. Theoretically, measurements could be taken with a minimum period of 5 seconds. The logged data points will be saved as a CSV file because those can be read by Excel which will make analyzing data fairly trivial.
Materials
-
2 Arduino Unos
-
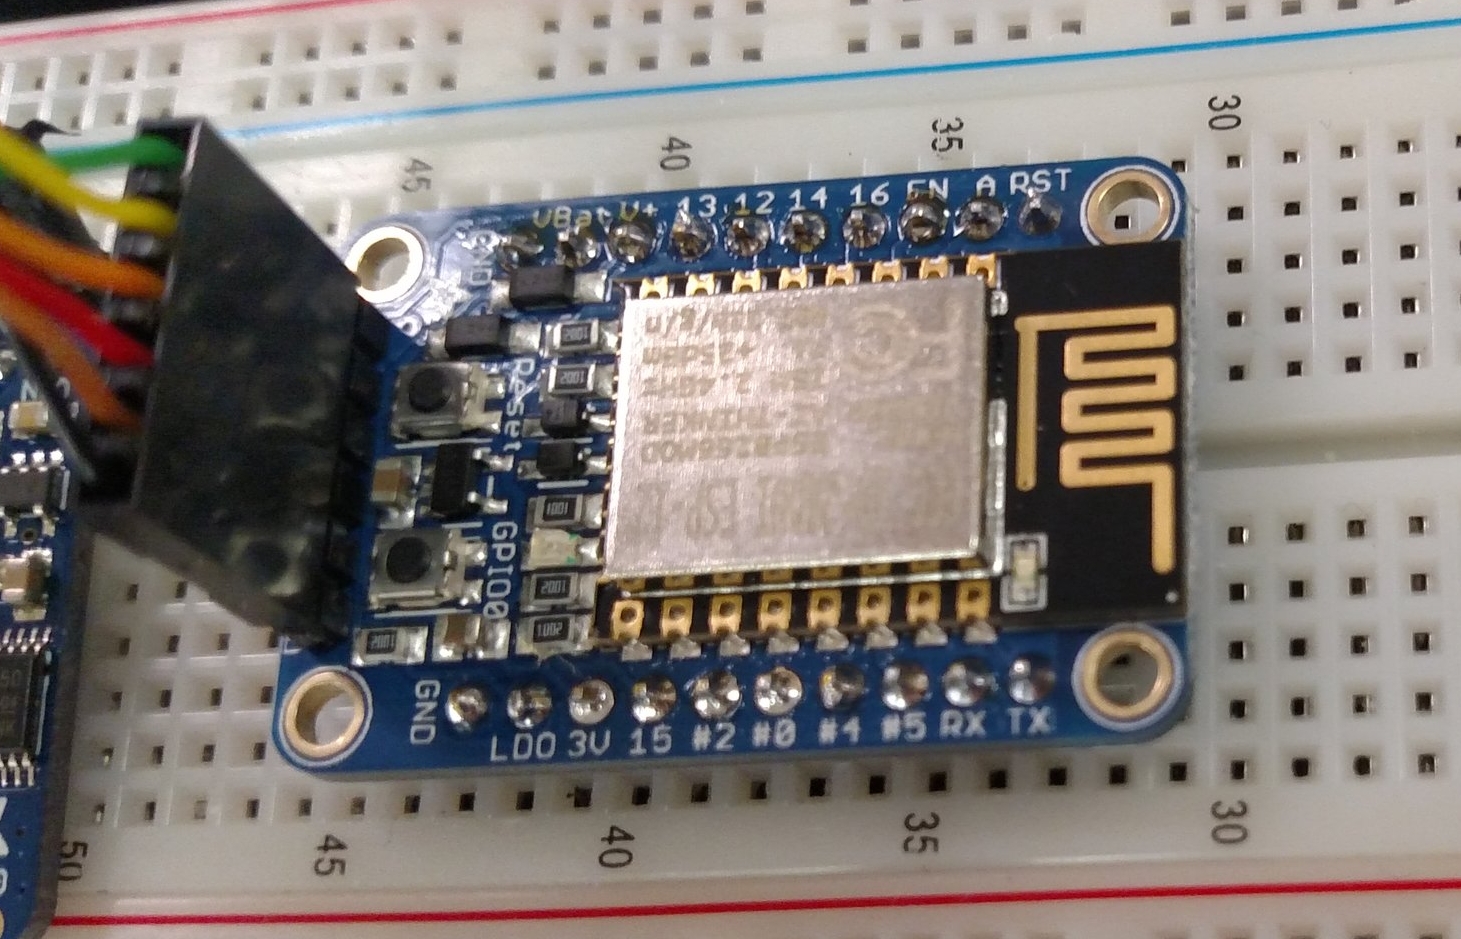
Sparkfun GPS SD logger shield (any SD card logger could work, I just had this handy)
-
Breadboard, prototyping wires
-
2 GB μSD card
Libraries
-
Master Arduino
-
SoftwareSerial (default)
-
SPI (default) for SD card
-
Bill Greiman’s SdFat Lightweight SD card library
-
Wire (default) for I2C
-
-
Slave Arduino
-
Jordan Beasley’s SDISerial Library for reading Decagon sensor
-
Wire (default) for I2C
-
Description
After encountering a few problems, the system that I settled on was two Arduinos that would communicate over I2C. I was forced to do this because the “SDI Library” that is needed to communicate with the 5TM soil sensor I was using is incompatible with the “SoftwareSerial” that was critical for debugging and testing the code.
I2C communication was originally developed for and is usually used for multiple chips on the same embedded electronic system to communicate over the same bus. It’s useful for when tasks need to be split between multiple Arduinos. I2C is implemented in Arduino using the Wire library. For this situation, the slave Arduino was the one reading data from the TM5 sensor. The nice thing about I2C is that it is relatively trivial to add additional sensors to any sensors to a setup in case we want to make multiple readings at the same time. The code for implementing this setup was written by following this tutorial
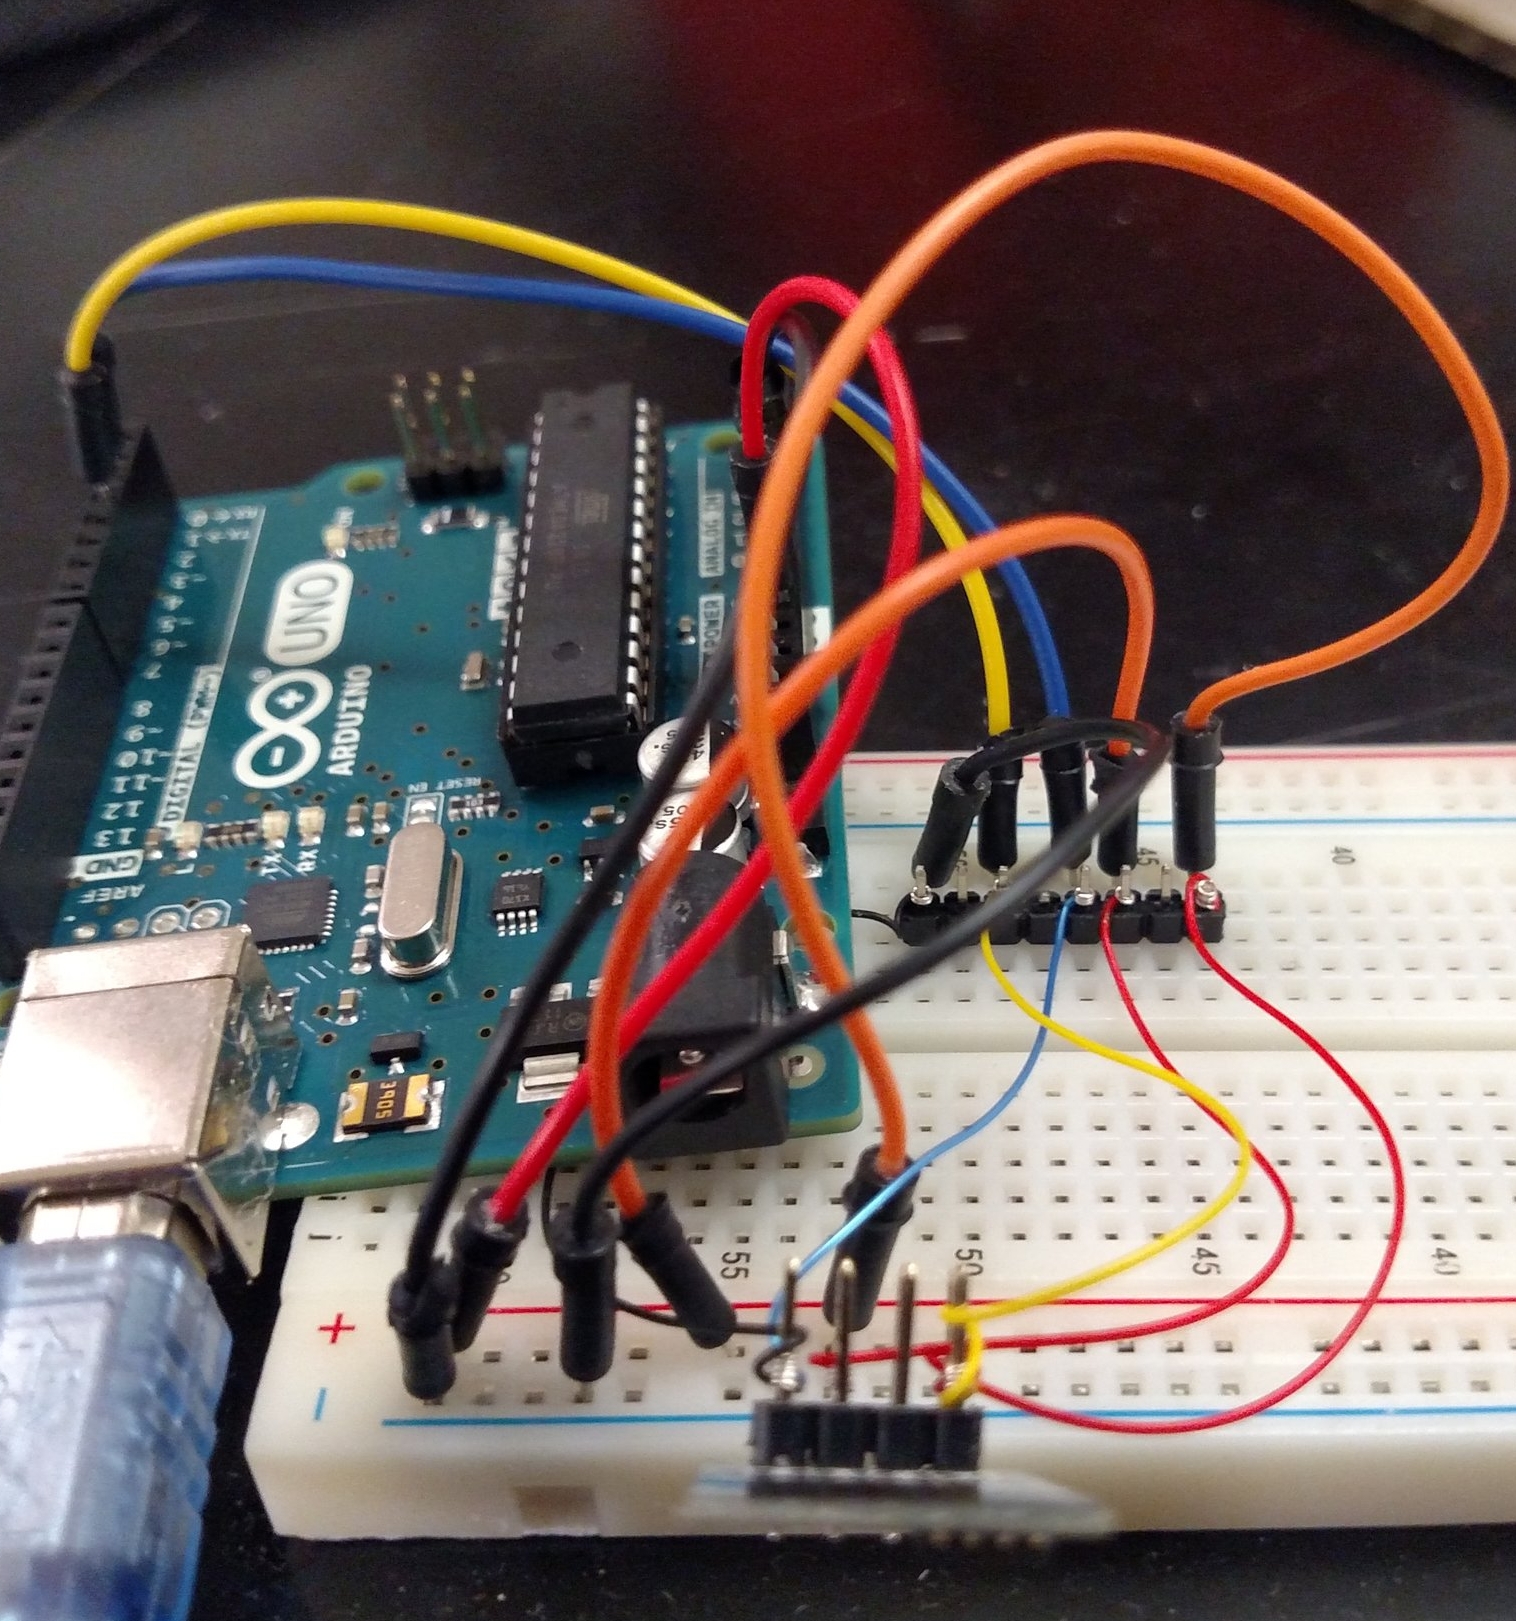
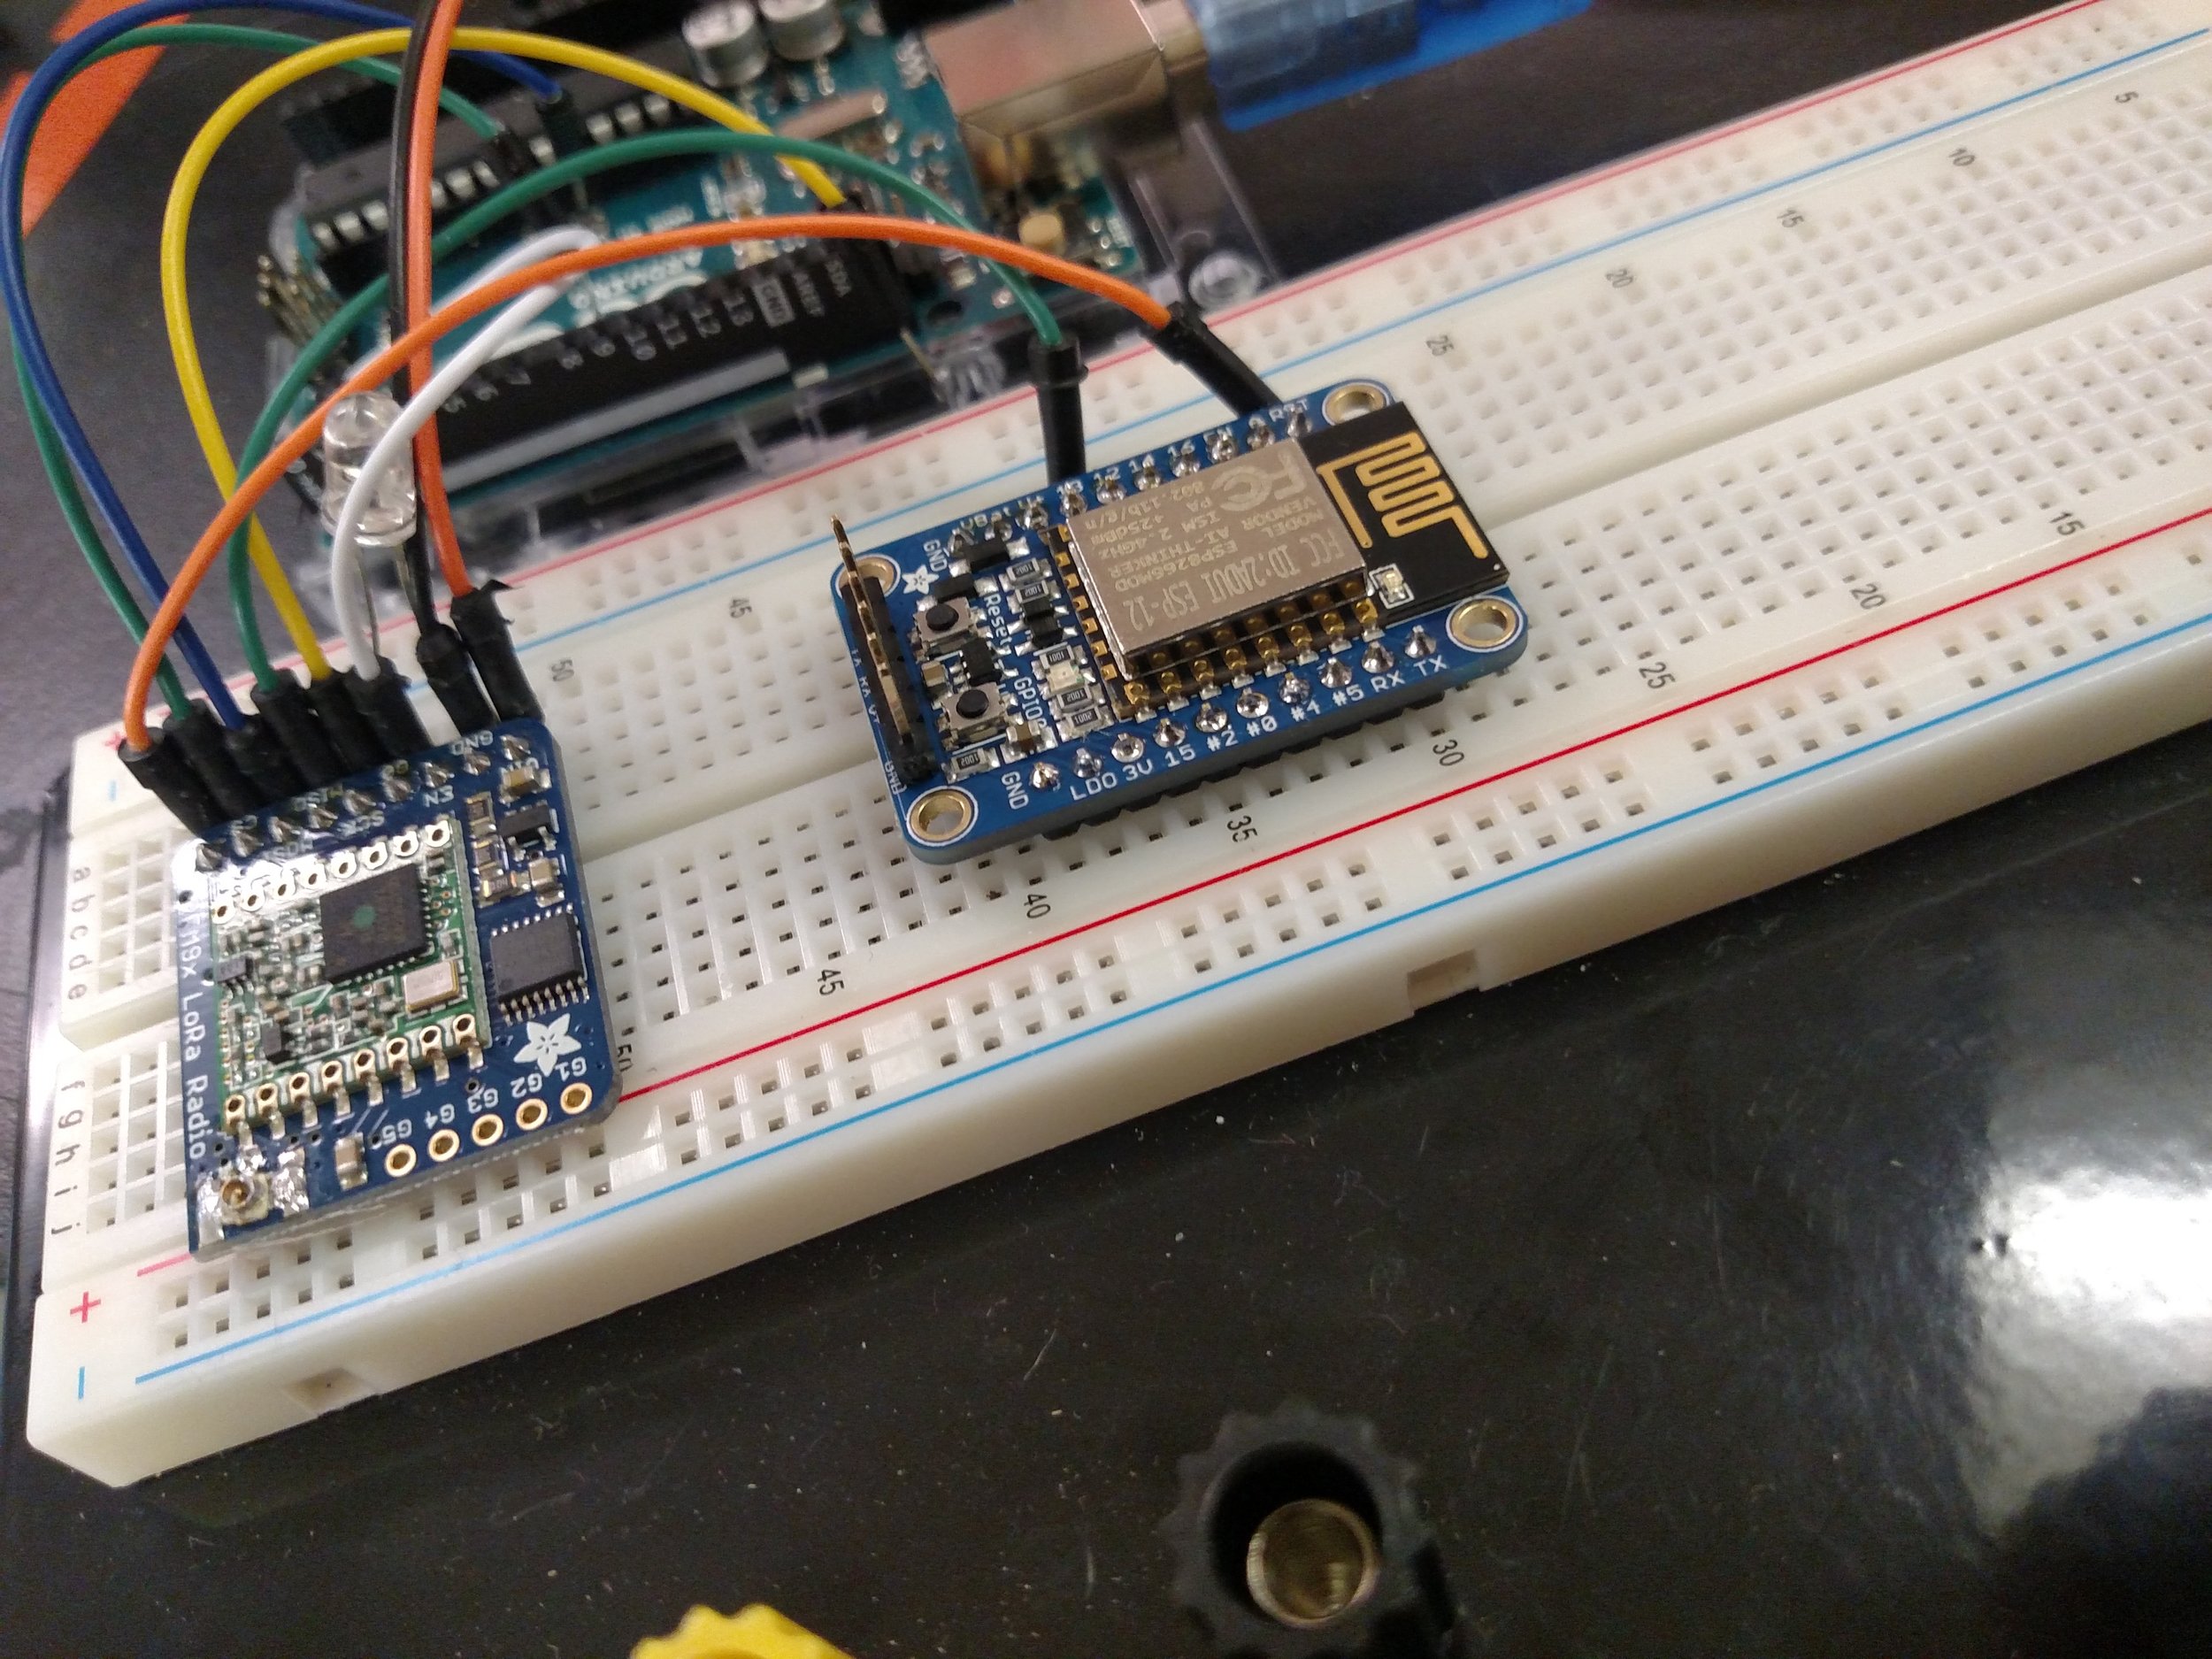
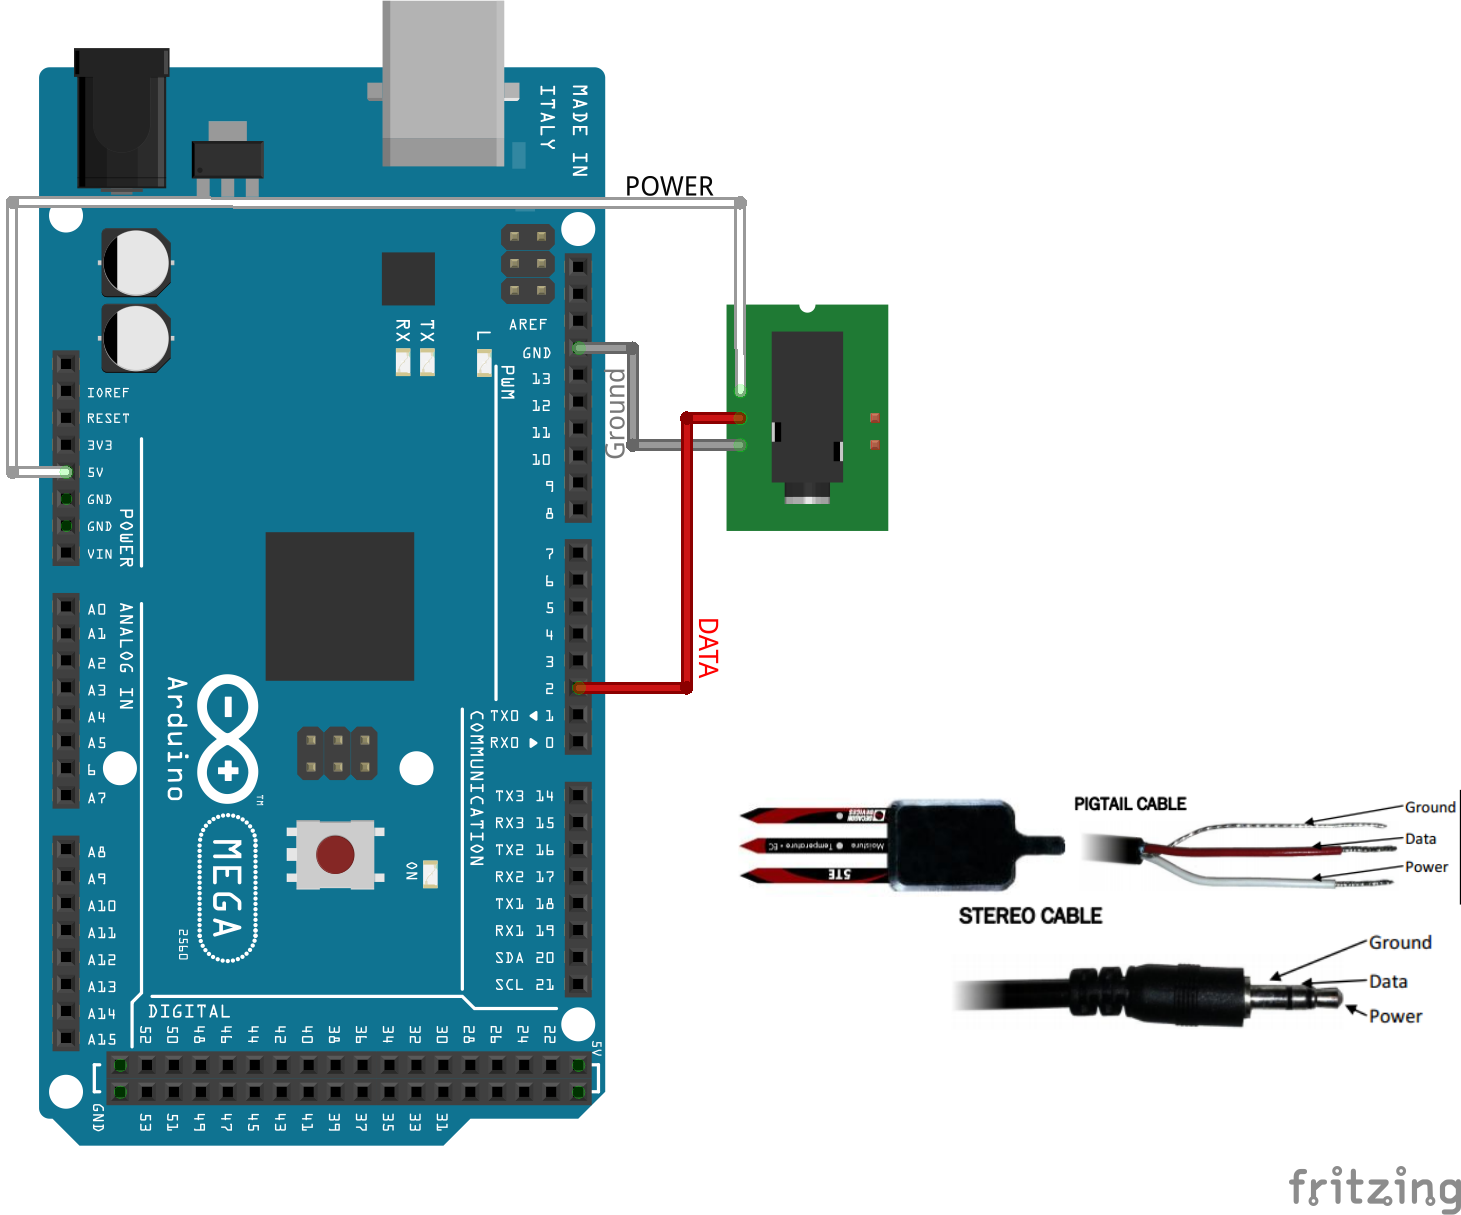
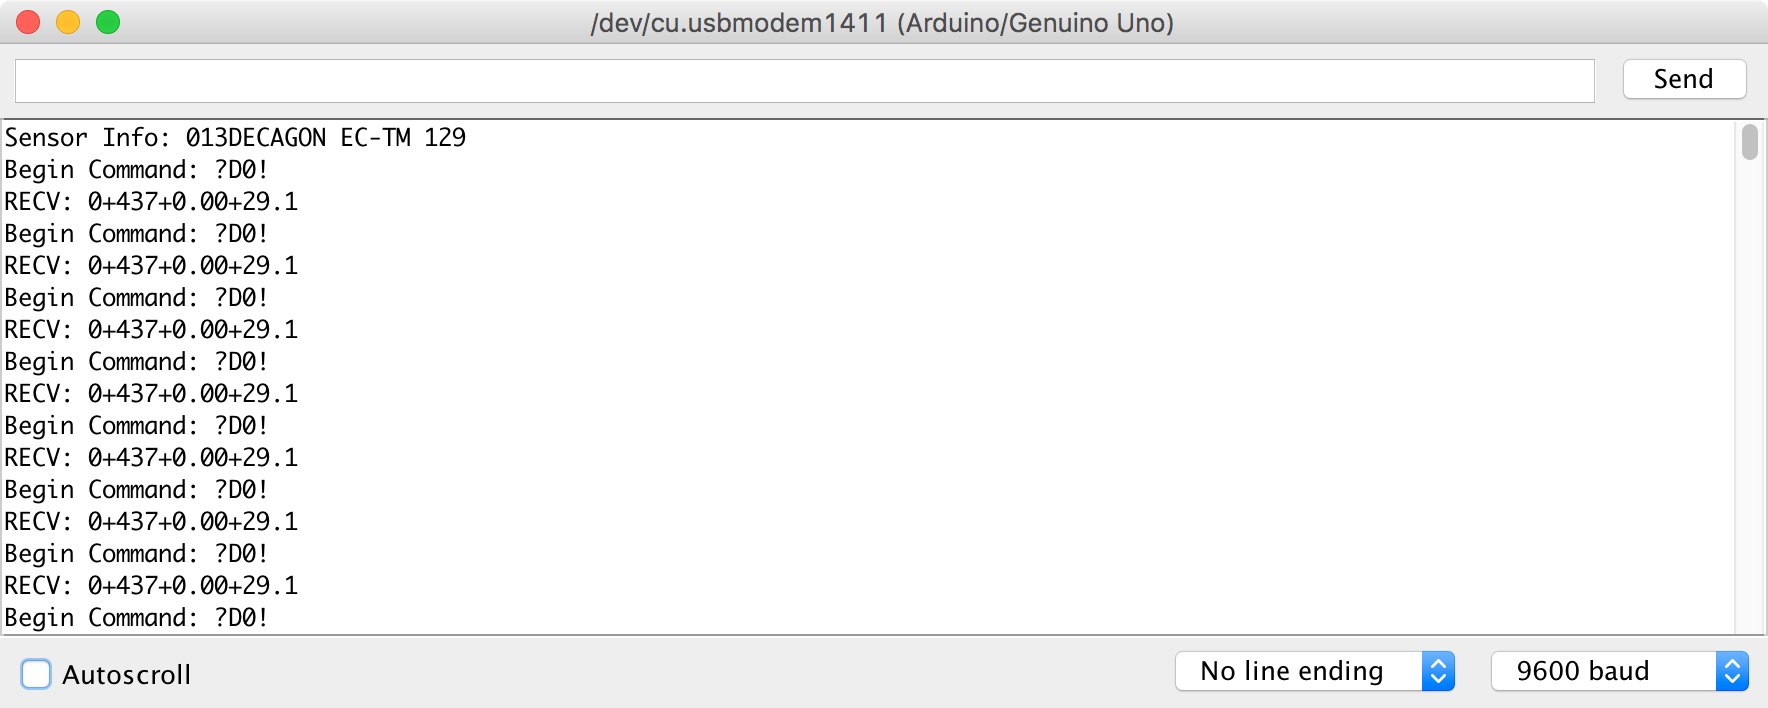
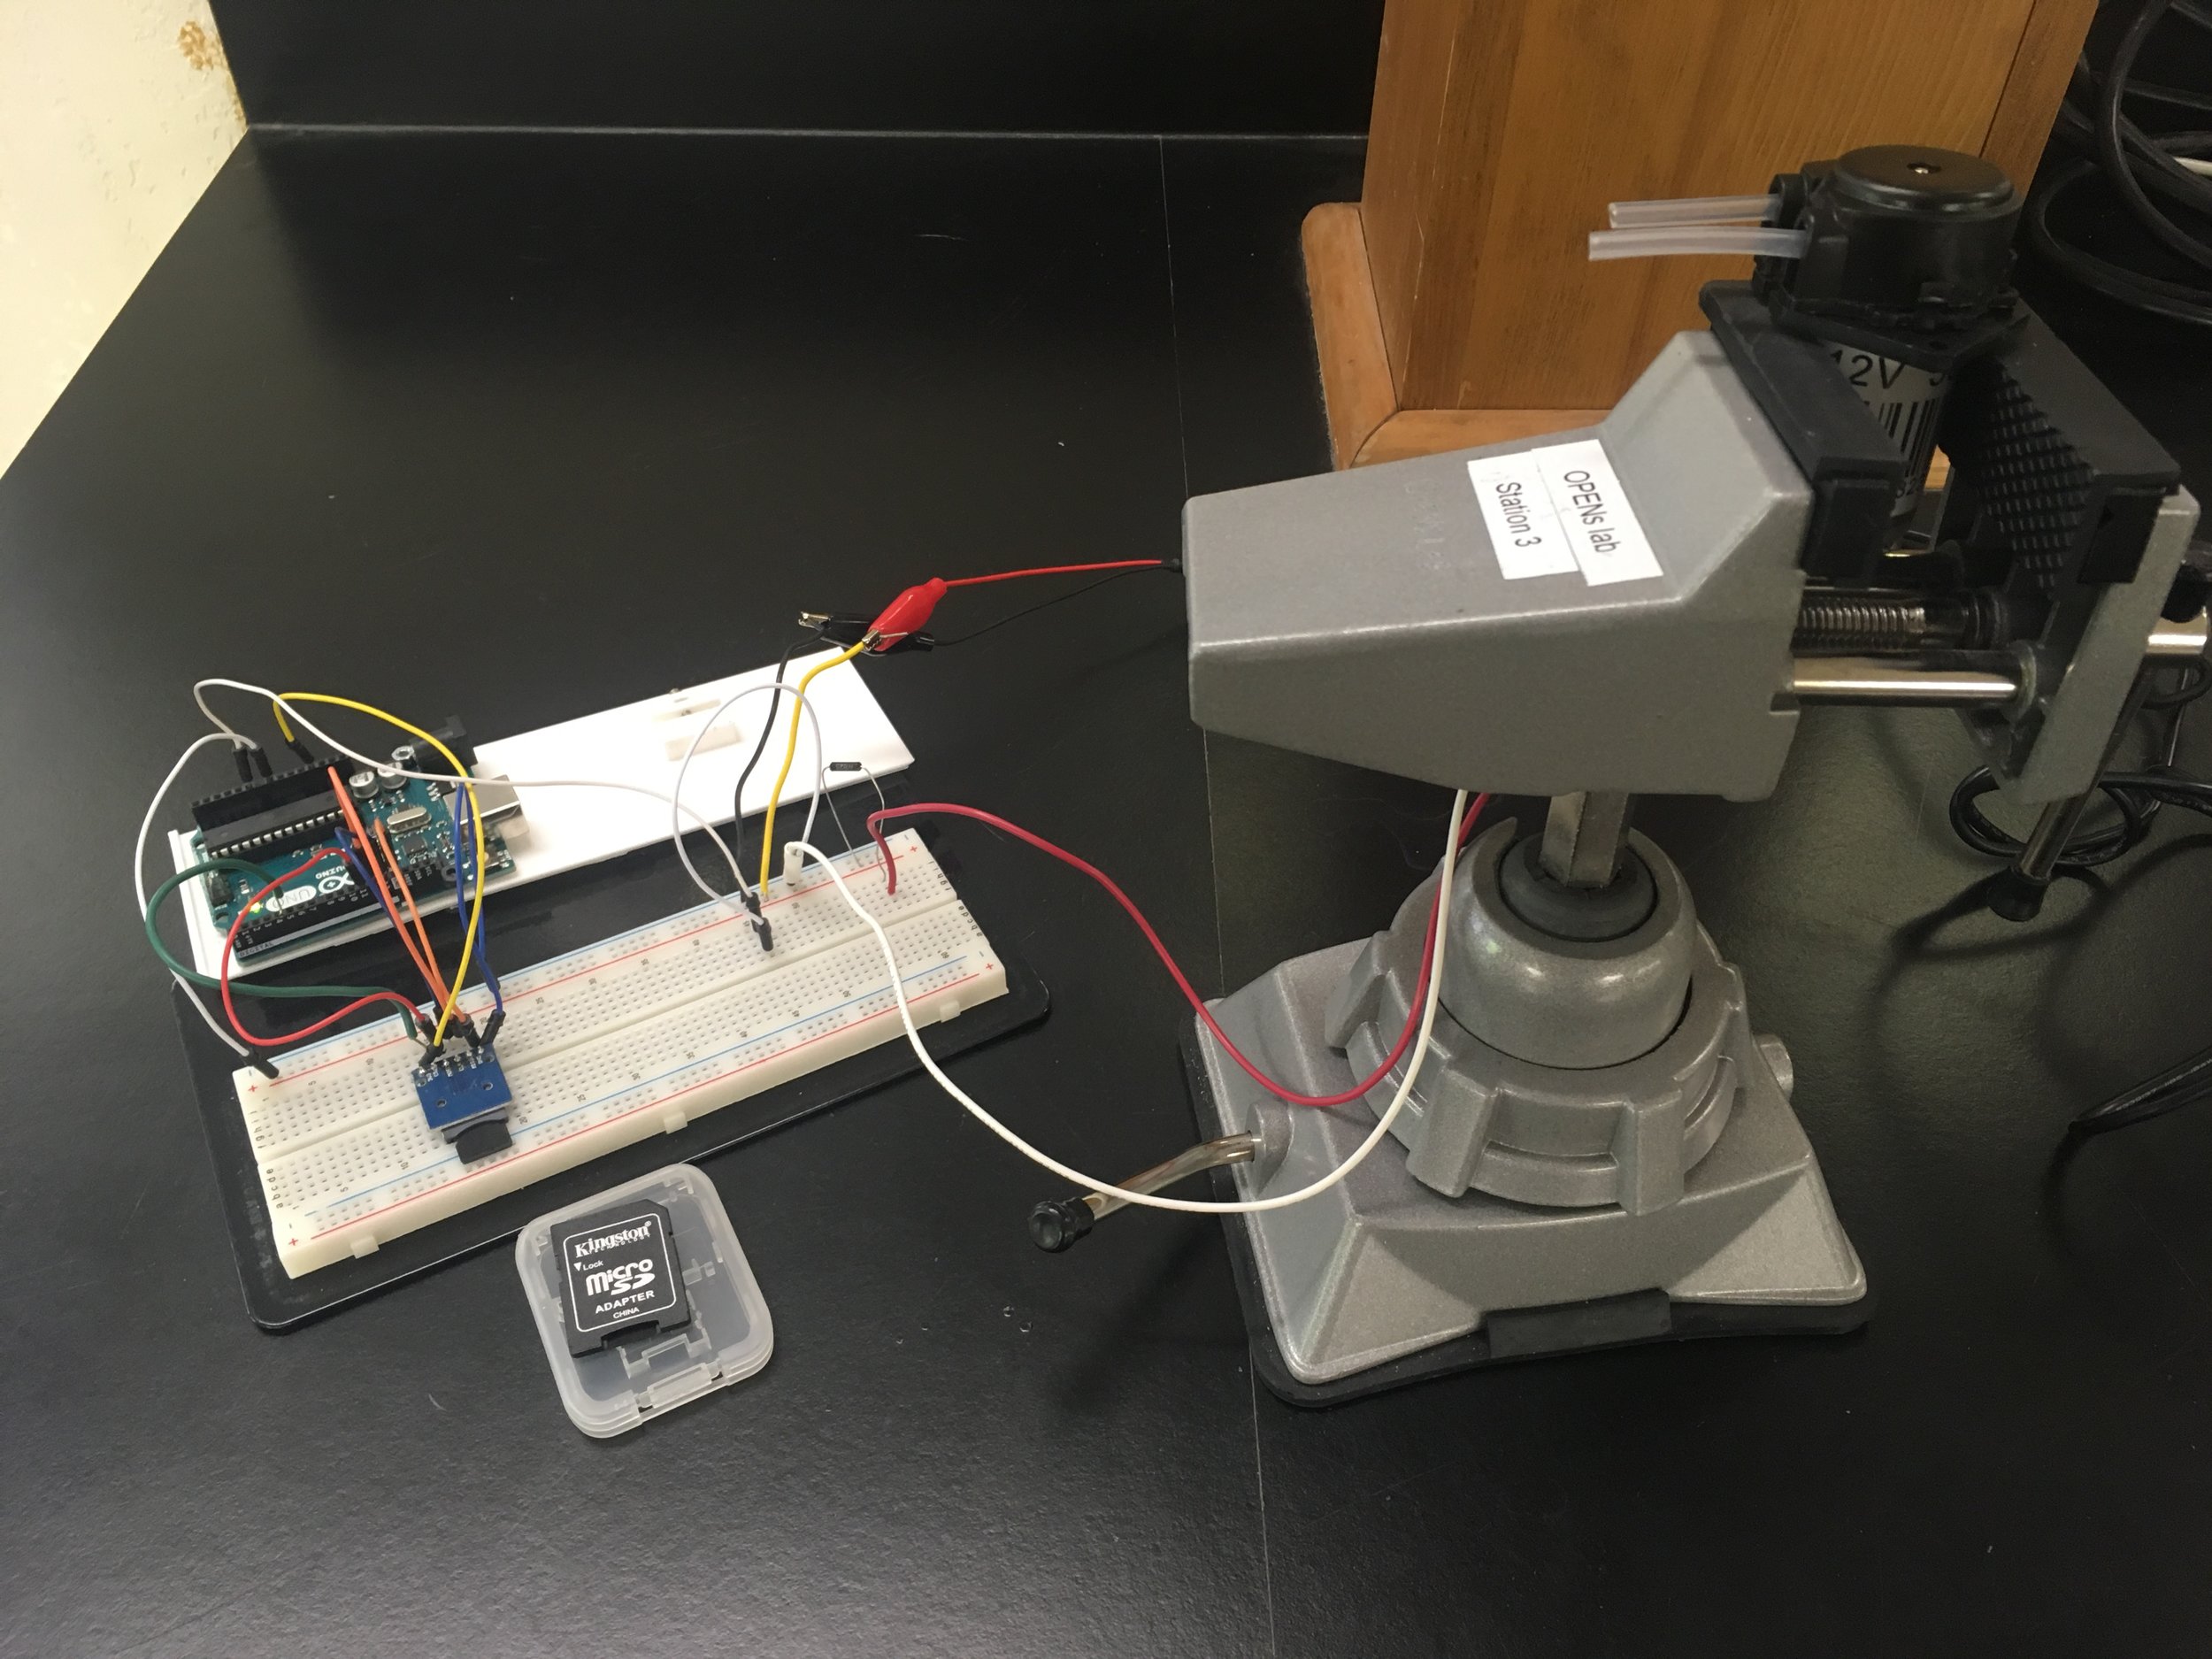
One Arduino was set as a slave and read the data from the 5TM sensor. I followed Chet’s Decagon 5TM sensor guide to set this up. The master Arduino had the GPS logger, and RFID reader shields on it to record the values. The RFID reader shield uses pins 2 and 3; the GPS SD logger pins 13, SCL, and SCA; and I2C pins GND, A4 and A5 on the master Arduino. The 5TM sensor used pins 6, 5V, and GND; and I2C pins GND, A4 and A5 on the slave Arduino. The hardware diagram shown below illustrates this.
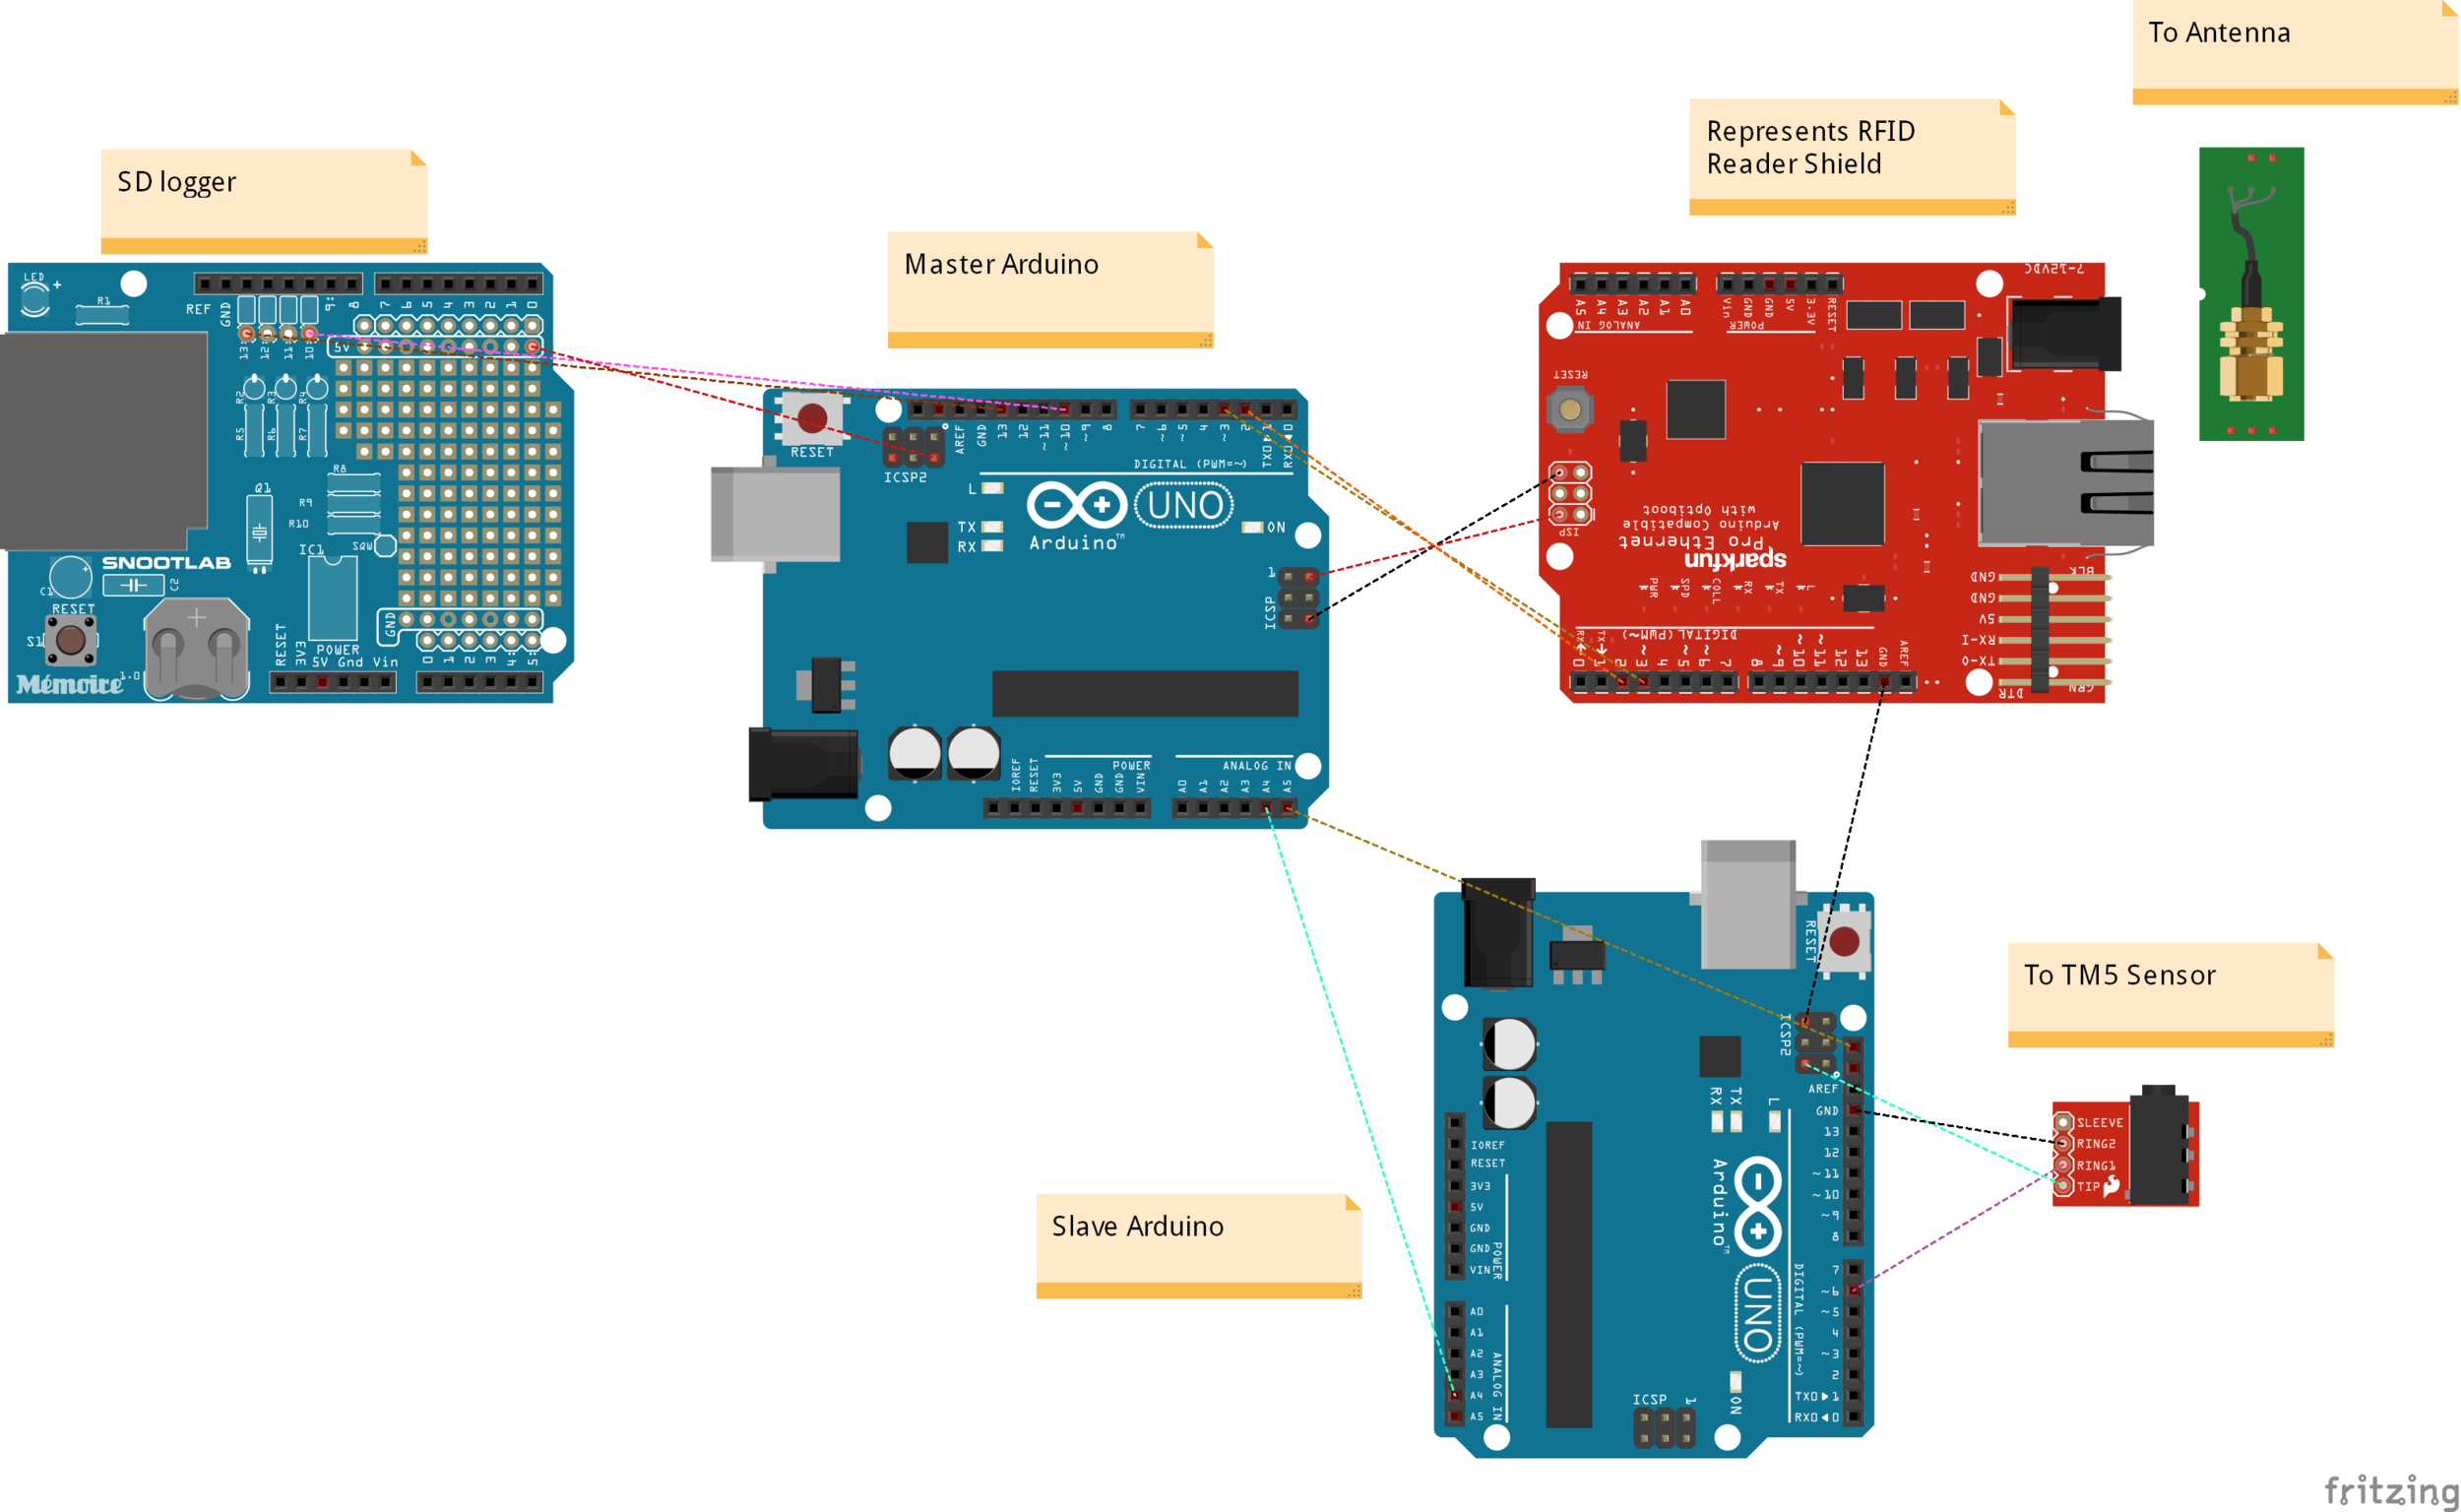
The code for this system will be posted in the examples folder of my RFID Github library under the title “Calibrator example”.
Results
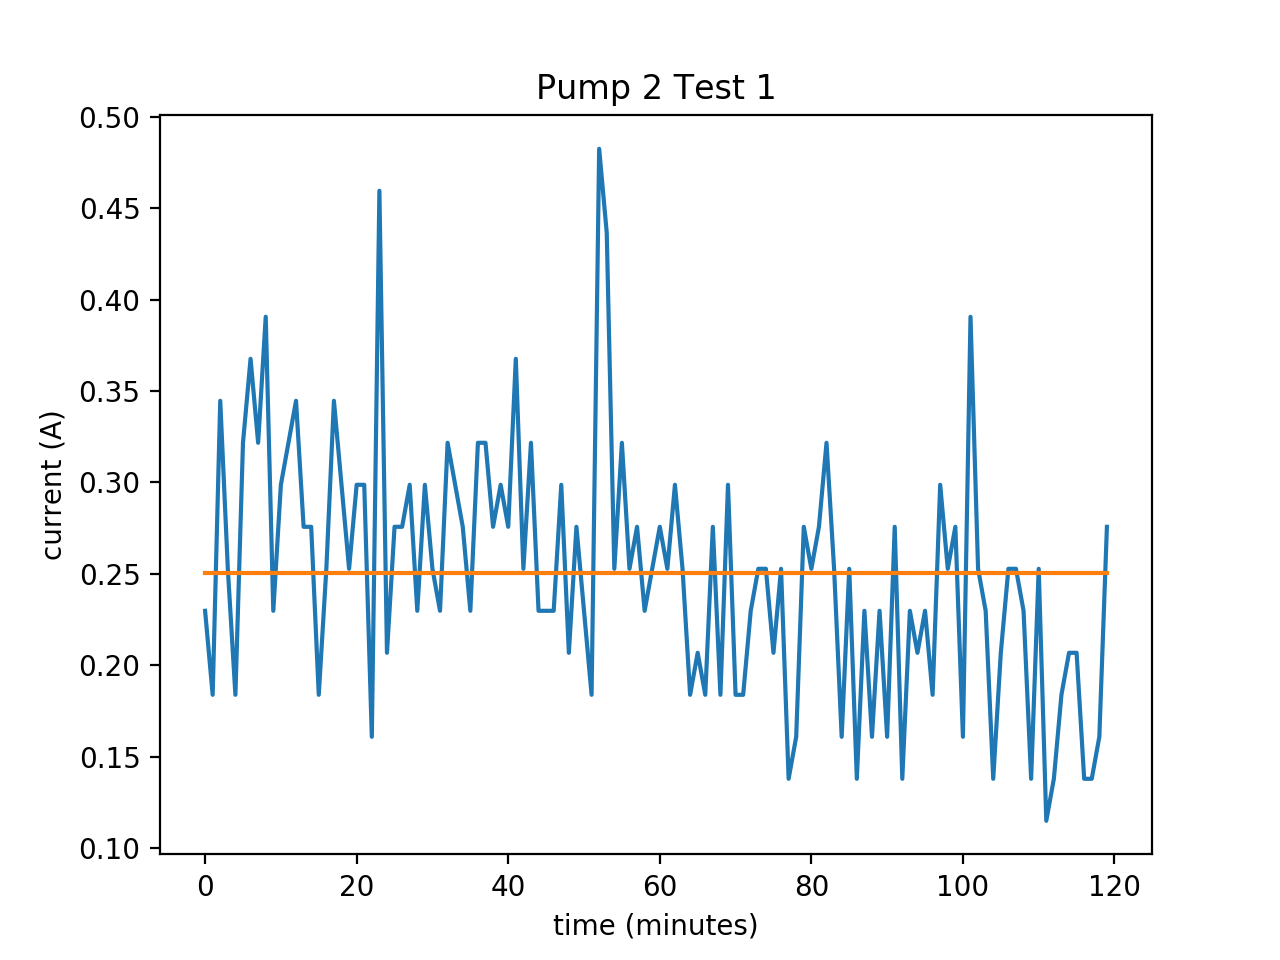
Last night, the first data set was collected using this setup over the course of 16 hours. Below is the graph (made in Excel) that shows the Dogbone moisture values (units not named) vs the 5TM conductivity measurements (dielectric permittivity, ε). There was a recorded R^2 value of .75 which means there was a moderately high correlation between the two. As one can see from the graph, over time the 5TM’s electron permittivity decreased slowly as the soil slowly dried out. Longer-term tests where the soil has time to go from saturated to dry will be key for properly calibrating the Dogbone tags to the current industry standard, dielectric permittivity.
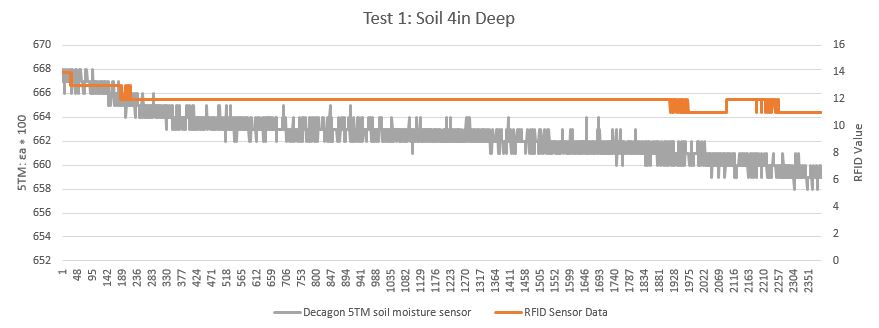
The x-axis has units of number of 10 minute intervals